The U.S. Dollar Is Still Trying To Confirm A Top
 By
By
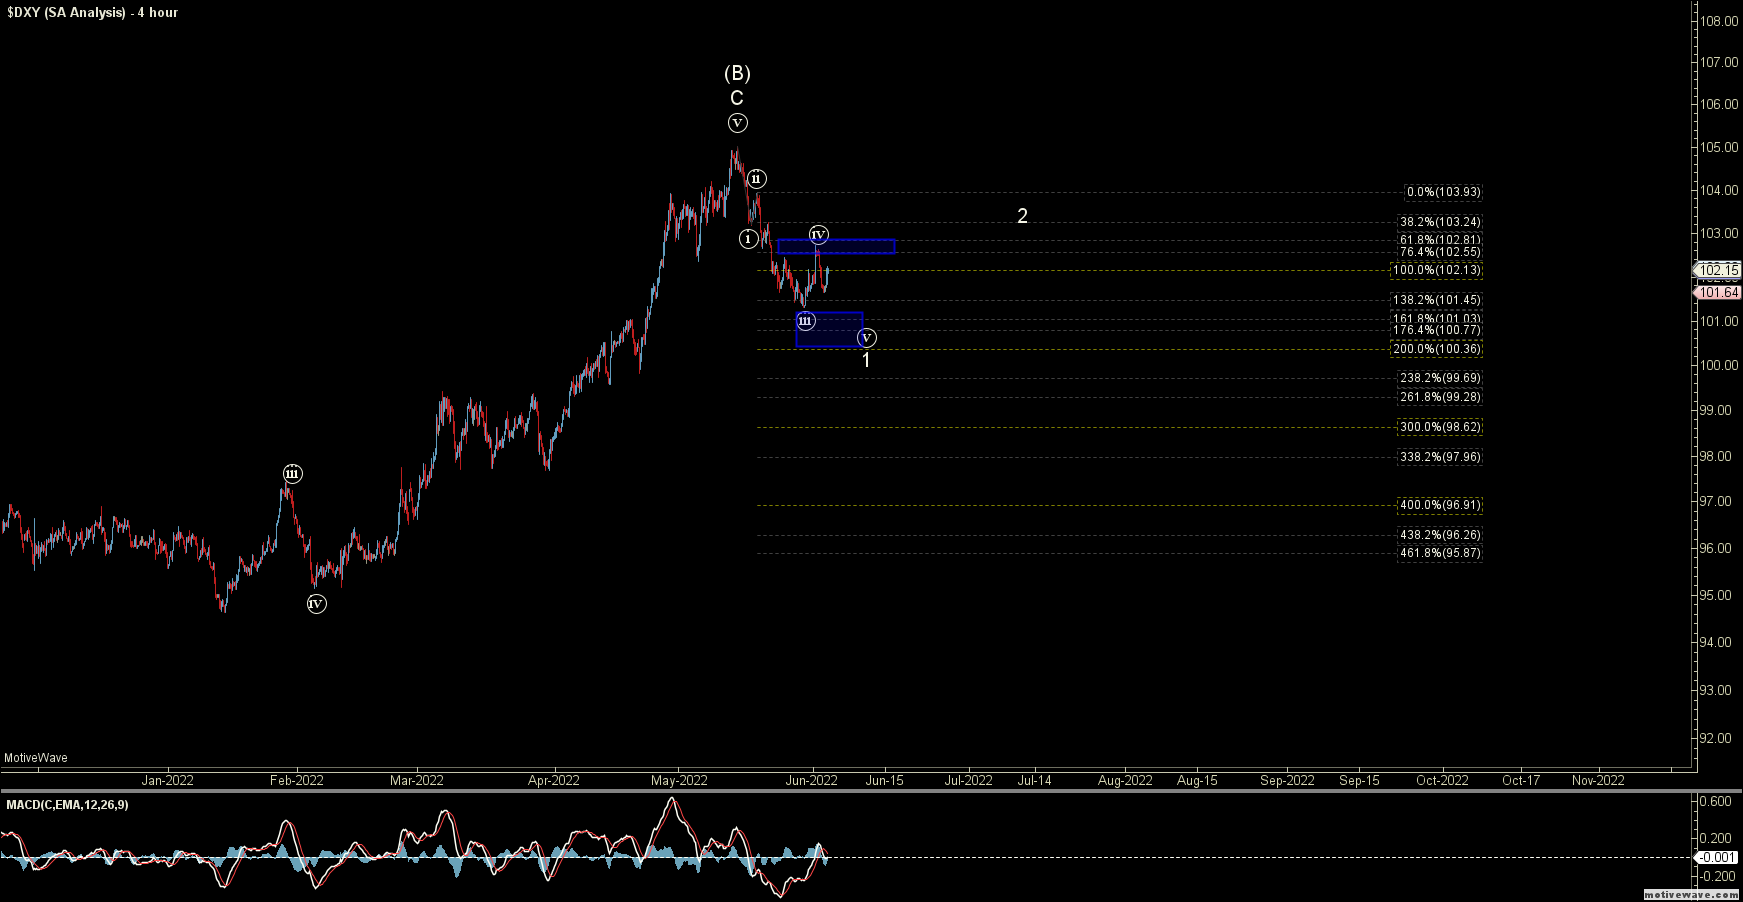
This week the DXY pushed slightly lower before turning up again and then lower into the end of the week. All of this price action occurred near the bottom of what I am counting as a wave ((iii)) on the four-hour chart and then back up to the wave ((iv)). This price action is still fitting within the potential to see a full five down off of the highs and is following the expected fib pinball guidelines however we do still need to see this push a little lower to finish off a potential five down off of the highs thus giving us the initial level of confirmation that we have indeed topped in the white wave (B). Until we do see that full five down off of the highs I remain a bit cautious but we should know next week whether we will see final follow-through to the downside under this case.
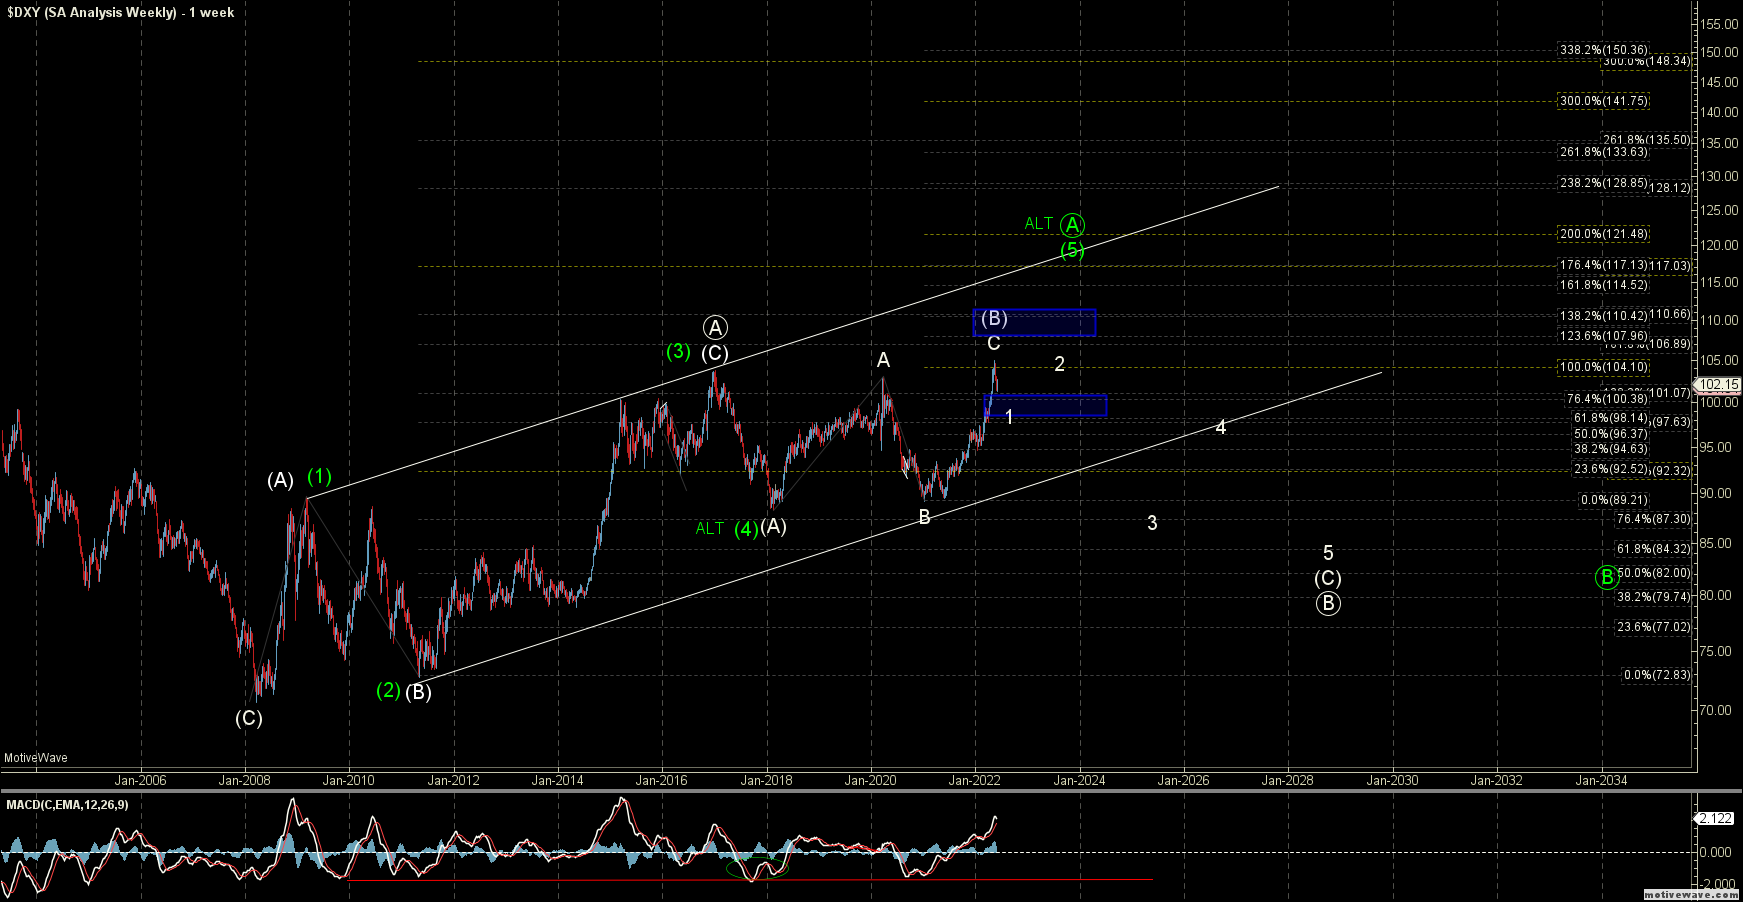
In order to see that full five down off of the highs, we still need to hold under the 102.55-102.81 zone overhead and make another lower low into at least the 101.03-100.36 zone below with a move into the 99.28-98.28 zone preferred to finish off the wave ((v)) of 1. That five wave move should then be followed up by a corrective retrace for a wave 2 which would then provide a downside setup on the DXY for a move down into the mid to low 80s over the course of the next several years. If we are unable to hold under the 102.81 level before seeing another lower low then it would be a warning sign that we may not be following the white count and open the door to the green count once again.
Under that green count, I would still want to see a push back up through the 107.96-110.42 zone then to give us confirmation that we would likely be following the green count, but again a push over the 102.81 level would certainly be a warning sign that the white count is not going follow-through. This green count would ideally still see a push higher towards the upper end of the Trend Line that was established off of that 2008 low and see this move up towards the 117-120 zone before finding a top in the larger wave ((a)). From that point, I would then be looking for a larger wave ((B)) down to take this much lower over the subsequent decade. The green path would of course still have some more work to do to the upside before a top is seen the larger degree pattern on both the white and green paths are still quite similar in structure. The white count of course would have already put in a top whereas the green count still would have a bit more work to do to the upside.
I will reiterate that both of these counts are far from ideal and neither has what I would consider a highly reliable pattern. If however, we can see a full five down off of the highs as laid out on the four-hour chart it would go a long way in giving us some confirmation that we have indeed put in a larger degree top in the U.S. Dollar. At that point, I would better be able to lay out the path to the downside and provide more accurate parameters to watch. Until that occurs however I do still remain a bit cautious in this region however we do seem to be getting a bit closer to a resolution on this week or at the latest next week.