The US Dollar Is Still Bouncing But Remains Well Under Resistance
 By
By
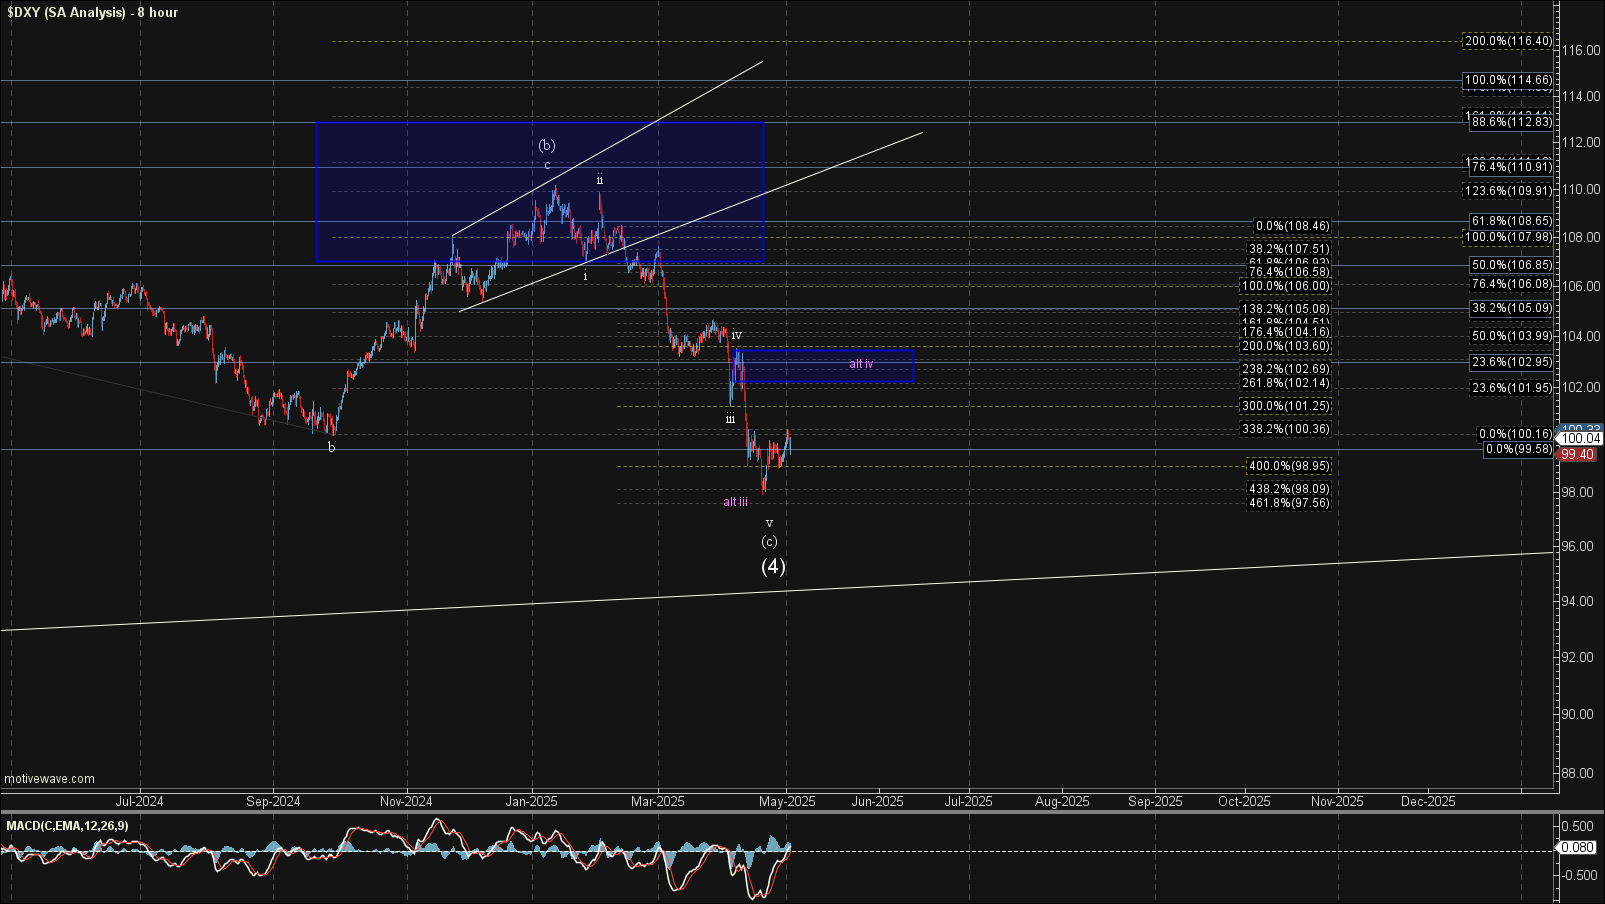
This week The DXY continued to retrace higher and while we do still have enough waves in place to consider all of the wave (c) completed off of the January highs this would still look better with a push a bit lower before a larger bottom is found. So with that as as I noted last week, while I will allow for this wave (c) to have completed as long as we remain under resistance, I am going to give the benefit of the doubt that we still have a bit lower to go before an ultimate bottom is found.
Shorter Timeframes
As noted above, we now can technically consider all of the wave (c) off of the January high completed. With that being said the larger degree fibs are still supporting a move closer to the 98.85-95.59 region, the top of which we are hitting in the Sunday night session. So with that as long as we remain under the 102.14-103.60 resistance zone the near term pressure will continue to remain down on the shorter timeframes. This support zone also lines up with the larger degree trend channel that is coming in near the lower end of that support zone close to the 95.59 level. If we are able to find a bottom in that region, followed by a break back over the 103.60 level then we can consider the abc pattern off of the 2022 high completed. From there we would then shift our focus to the bigger picture larger degree counts.
Bigger Picture
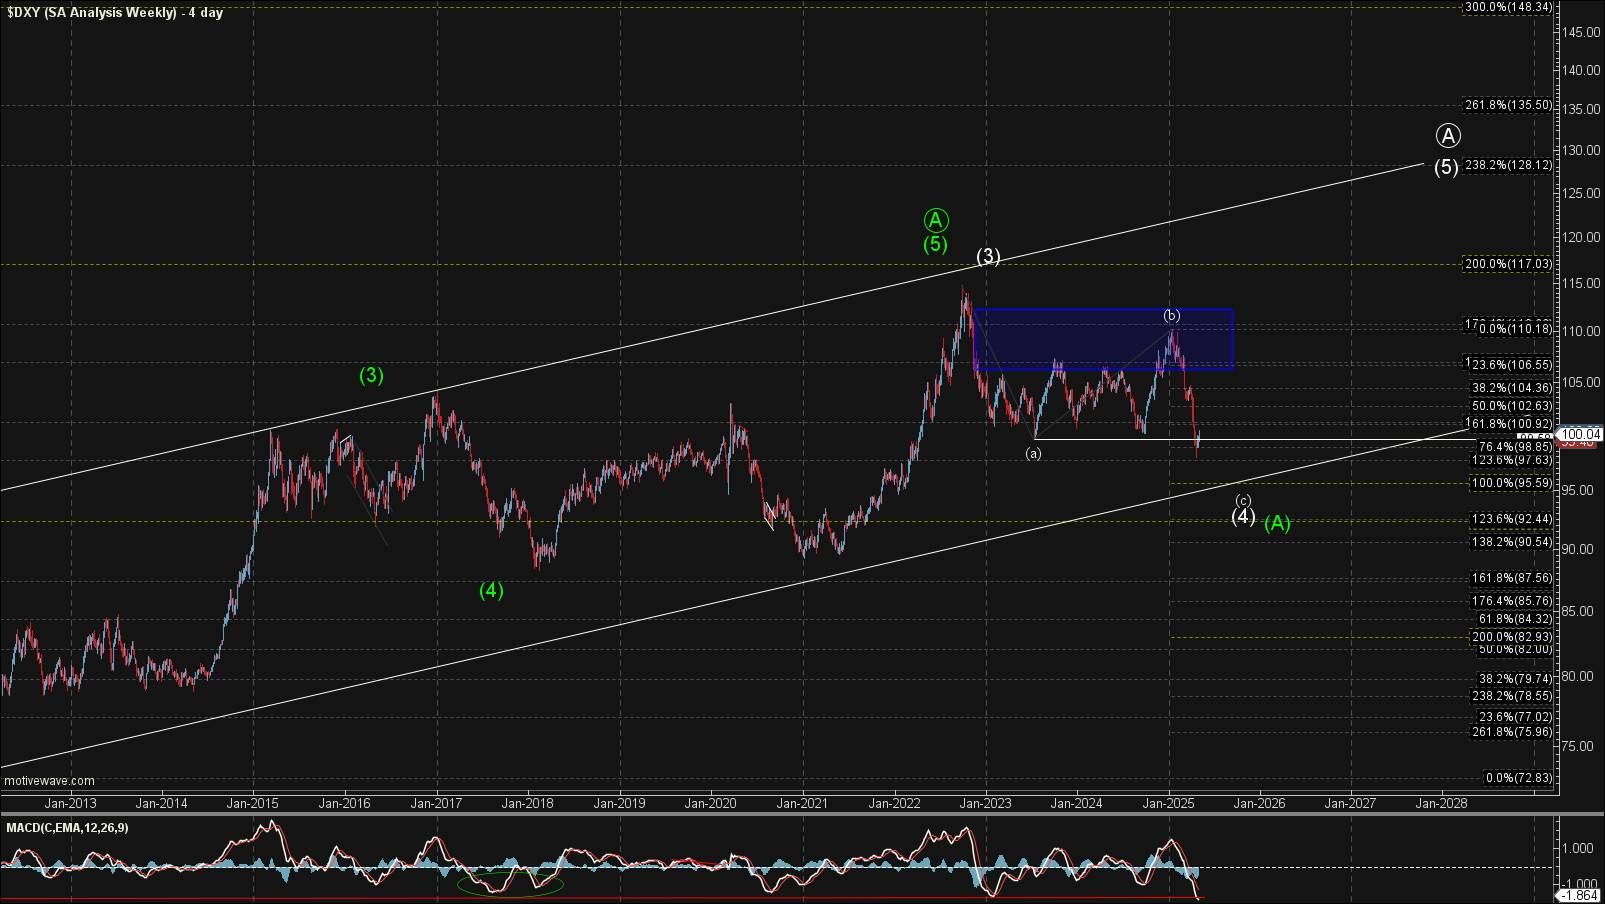
As I have noted previously, I am counting the top in October as either the white wave (3) or the green wave (5) of ((A)).
The white count is now moving closer to the lower trend line, filling out the potential wave (4). If we manage to hold that trend channel and the 95.60 level then we will look for a corrective push higher to begin the wave (5) up. Because we would likely be dealing with a large diagonal count up to new highs, it would be difficult to determine whether we are indeed following the white or the green counts.
We would have to wait for the first significant move back lower after the initial push higher to see the structure of that wave action. If that action lower remains corrective in nature then we can continue to expect higher levels over the next several years. If however, that move down starts out with five waves to the downside, then we would be looking towards the green count.
Additionally, should we see a direct and sustained break of the trend channel and the 95.60 level then it would be more suggestive that the green count is filling out however, we still would need further confirmation by seeing the structure of the next larger degree move lower after retracing higher as noted above. We still likely have quite a bit of time before we are faced with that situation but it is something that we will be watching in the months and years ahead.