The U.S. Dollar Finds Support Once Again
 By
By
After breaking down last week the DXY found support at the upper end of the support zone that I had laid out on last week’s chart. So with the inability to break through this support and the fact that this initial move down off of the highs still counts best as three waves I still have to allow for this to still see yet another higher high. If we can manage to break down under support in the coming weeks then I will be finally able to confirm an initial signal to a top but for now and as long as support holds I still can't rule out that this will see yet another higher high.
Shorter Timeframes
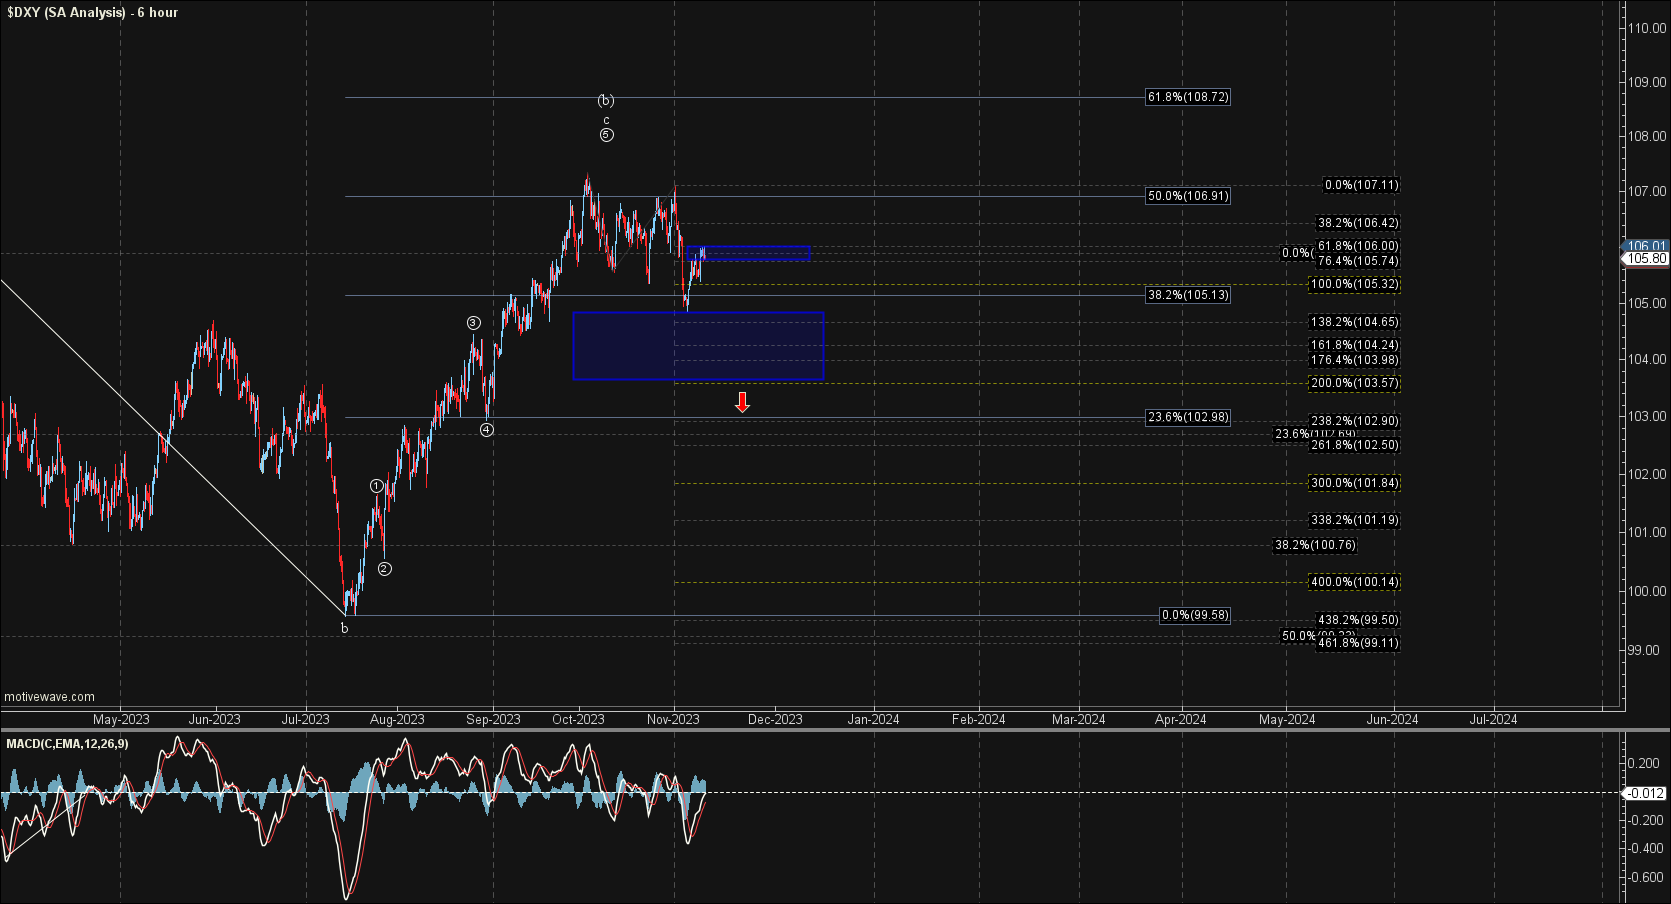
Under the expanded (b) wave count we still have a full pattern into current levels and have the potential to see a top at any point in time. We do still need to see this break back under the 104.77-103.95 zone and then the 102.64 level to give us a signal that we have indeed topped and unless and until that occurs we still can continue to grind higher and see a higher high.
As I noted last week, if we are topping in a wave (b) then the next leg down should come in five waves. So we should see both a break of support from a price perspective and a five wave move down from a structural perspective to confirm a top.
The initial move down off of the highs and into the low that was struck on October 23rd is not a terribly clean potential five wave move down. So while I can allow for it to be a i-ii with the October 23rd low being an expanded b wave it’s still very hard to rely on that at this point in time.
If we can hold under the 105.74-106.00 zone and move lower then we still can keep the potential for a top to be in place for the larger wave (b). If we break back over that zone then it would open the door for this to still need to see a higher to finish off the larger wave (b). Further confirmation of this would come with a break back over the 107.11 level.
Due to how sloppy the micro count is I am still going to rely a bit more on the larger support below and from a purely price perspective a break under the 102.64 level will give us initial confirmation that a top will come with a break under the 100.55 level and final confirmation with a break back under the 99.23 level. This will then lead us into the larger degree count as discussed below.
Bigger Picture
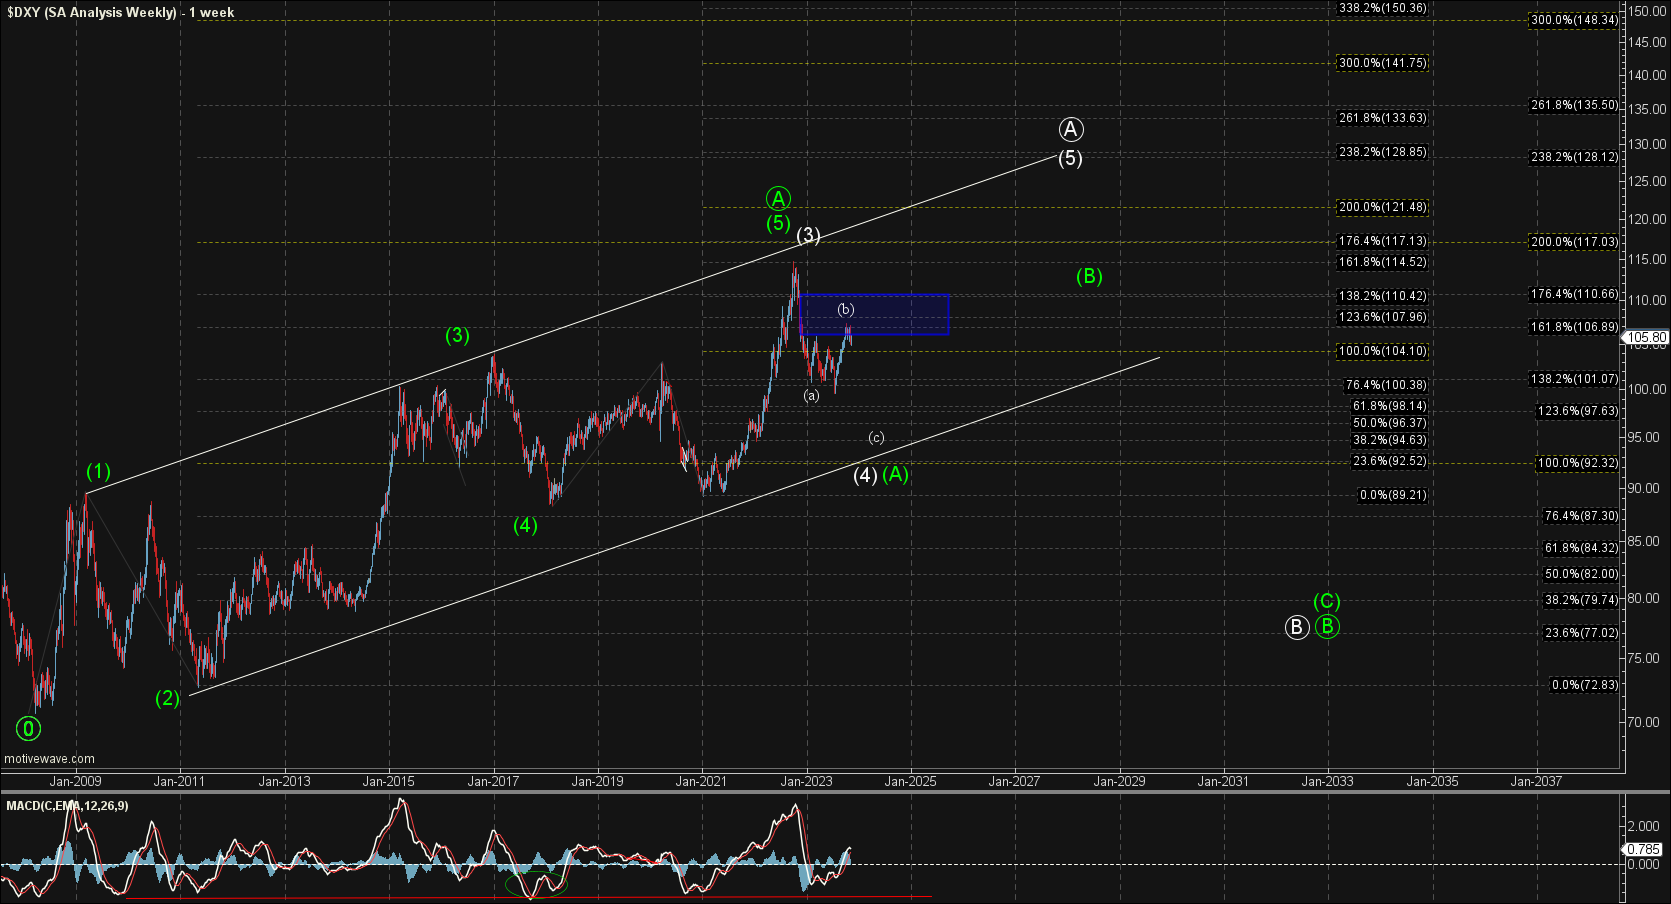
There is still no significant change in the bigger picture count, and as I have noted previously, I am counting the top in October as either the white wave (3) or the green wave (5) of ((A)).
The white count should head down towards the lower trend line to fill out that wave (4) before pushing higher once again to finish off the larger degree wave (5) of ((A)). The exact bottoming level for this potential wave (4) has become a bit more clear as noted above as we have likely topped in the wave (b) of that (4). Ideally, I would be looking for that to come in at the 93.11-90.20 region as this is the target zone for the wave (c).
The green count is suggestive that we have topped in all of the larger degree wave ((A)) and we are already in the wave ((B)) down. Both the white and the green counts are going to look very similar in the early stages of this move as they both are corrective in nature. The green count of course would give us a much deeper retrace for that larger wave ((B)) before turning higher, whereas the white count should find support much higher before getting that higher high.