The U.S. Dollar Finally Turns Lower
 By
By
After grinding higher over the last several weeks the DXY finally turned lower this week after hitting just over the 105 level. While still a bit too early to call a top just yet we have held under the key resistance level that needs to hold to keep the immediate topping count in play. So as long as we are able to hold under resistance in the weeks ahead I am still leaning towards the more immediate topping count as laid out on the charts. Should this begin to breakout over resistance it would open the door for higher levels before a top is seen but for now the primary count remains intact.
Shorter Timeframes
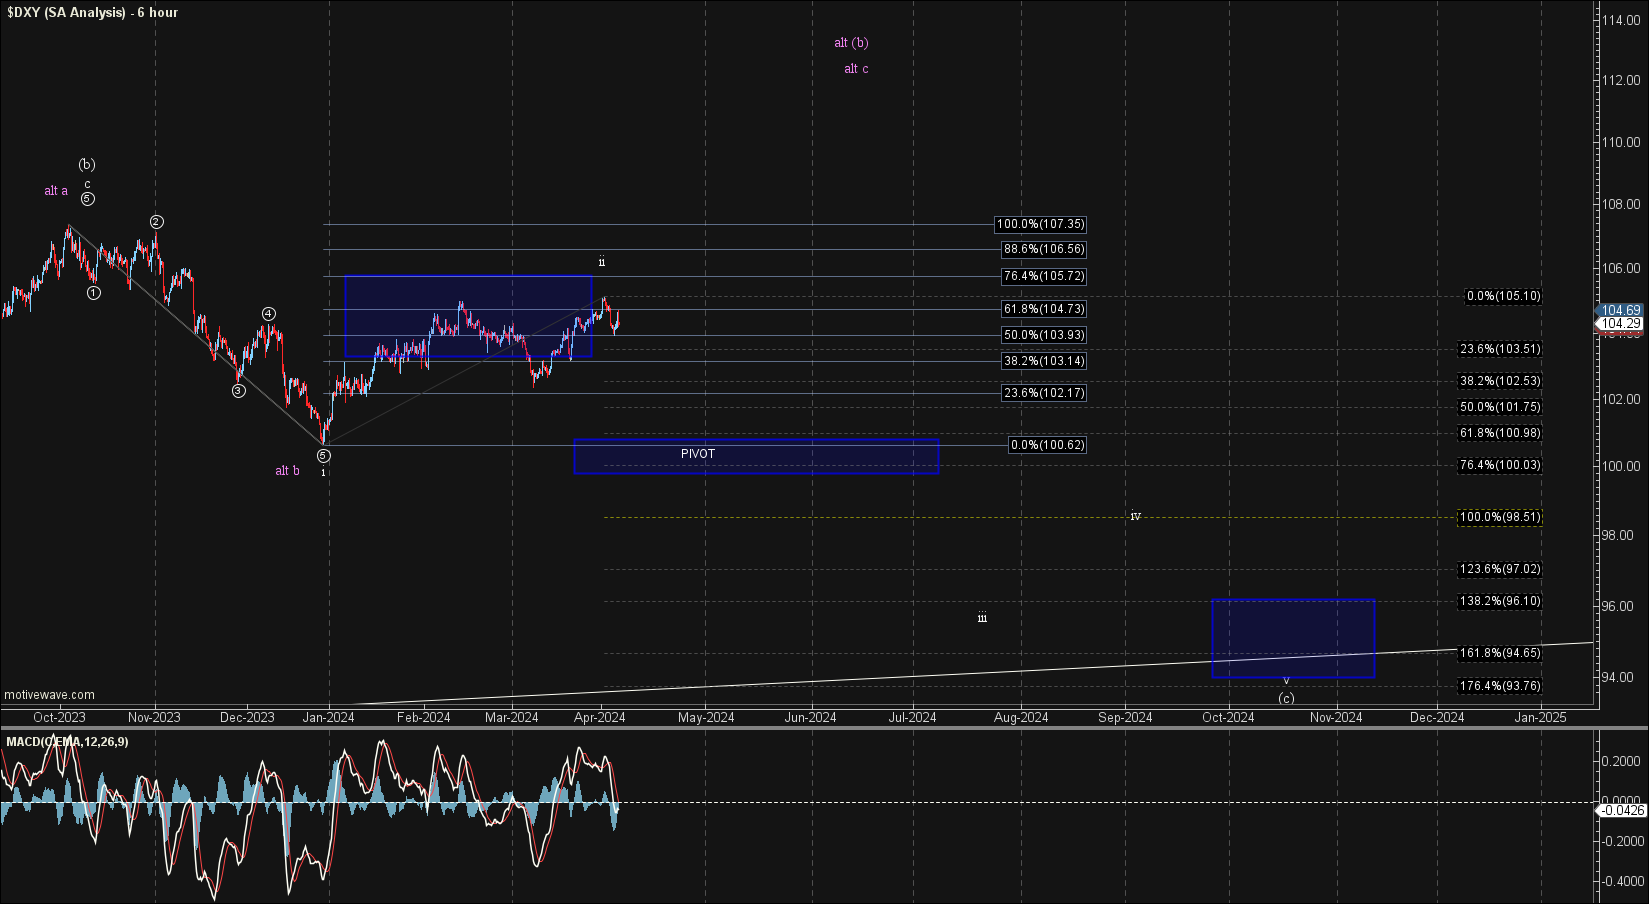
This week’s break over the 105.04 level has invalidated the more immediate bearish count however we are still holding under the larger 76.4 retrace of the move down of off of the 107.35 high. So while the structure of the move is far from ideal at this point we are still holding the key resistance level that is needed to keep the more immediately bearish white count in play.
So from here, I will continue to look for a move through the 100.84-99.89 zone while holding under the 105.72 level to give us initial confirmation that we have indeed topped in all of the wave ii. I would view a break of the 102.17 level as an early signal of a top however it really would need to go along with a five-wave structure until the pivot is broken below.
If we move back up over the 105.72 level then it would open the door for this to be following the new purple alternate count. Under that case I would be looking for a wave c of (b) to move back up over the 107.35 level and potentially test the 110.41-113.63 region before a top is seen. For now however and as long as we are under the 105.72 level this purple count will remain an alternate path.
Bigger Picture
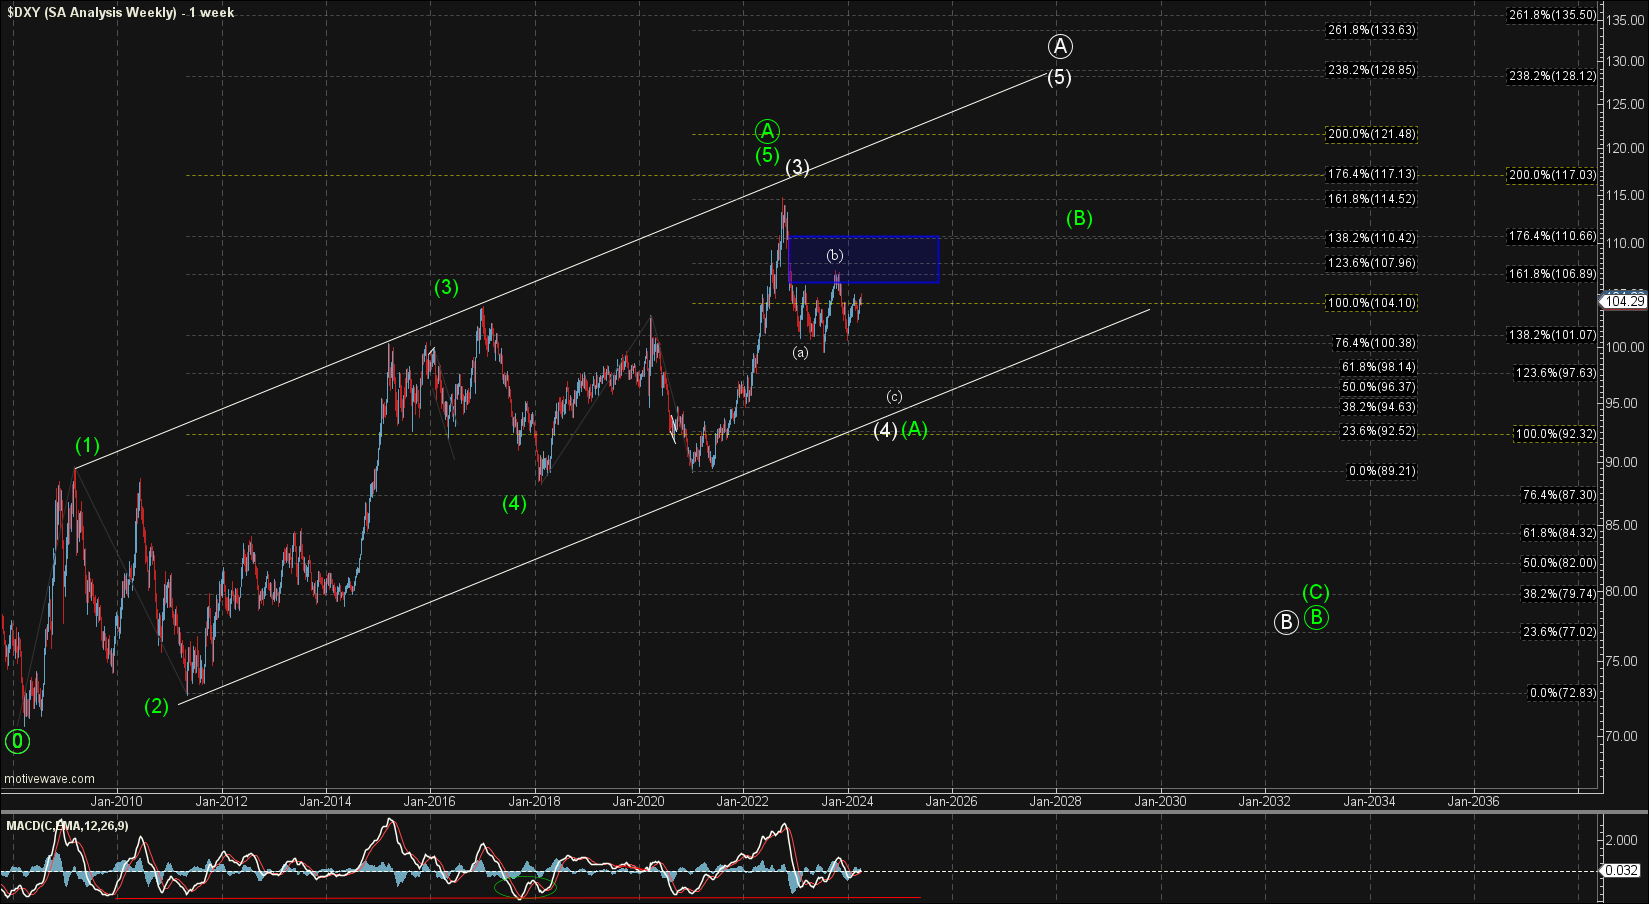
There is still no significant change in the bigger picture count, and as I have noted previously, I am counting the top in October as either the white wave (3) or the green wave (5) of ((A)).
The white count should head down towards the lower trend line to fill out that wave (4) before pushing higher once again to finish off the larger degree wave (5) of ((A)). The exact bottoming level for this potential wave (4) has become a bit more clear as noted above as we have likely topped in the wave (b) of that (4). Ideally, I would be looking for that to come in at the 93.11-90.20 region as this is the target zone for the wave (c).
The green count is suggestive that we have topped in all of the larger degree wave ((A)) and we are already in the wave ((B)) down. Both the white and the green counts are going to look very similar in the early stages of this move as they both are corrective in nature. The green count of course would give us a much deeper retrace for that larger wave ((B)) before turning higher.