The U.S. Dollar Does Not Disappoint As The Twists and Turns Continue
 By
By
I noted in the past two weekend updates to be on the lookout for the DXY to take some twists and turns as we were likely in the midst of an ending diagonal to finish off this larger degree topping pattern. The action this week certainly did not disappoint us in regards to seeing some of these twists and turns. After moving higher into the upper end of resistance for the potential wave b last week, we have subsequently moved down off of those highs, and back up towards those same highs before dropping hard to new lows into the end of the week. While this action is certainly quite volatile and difficult to track on the smaller timeframes bigger picture it is fitting quite well with both the primary pattern as laid out on the charts as well as the wave personality based on where we currently are within the count. Now although we did take some twists the overall parameters have not changed as we are still trading under the key upside resistance/pivot level and over the downside support/pivot level. So, with that, I will leave you with the analysis as presented last week as I have very little to add to the parameters that I presented at that time.
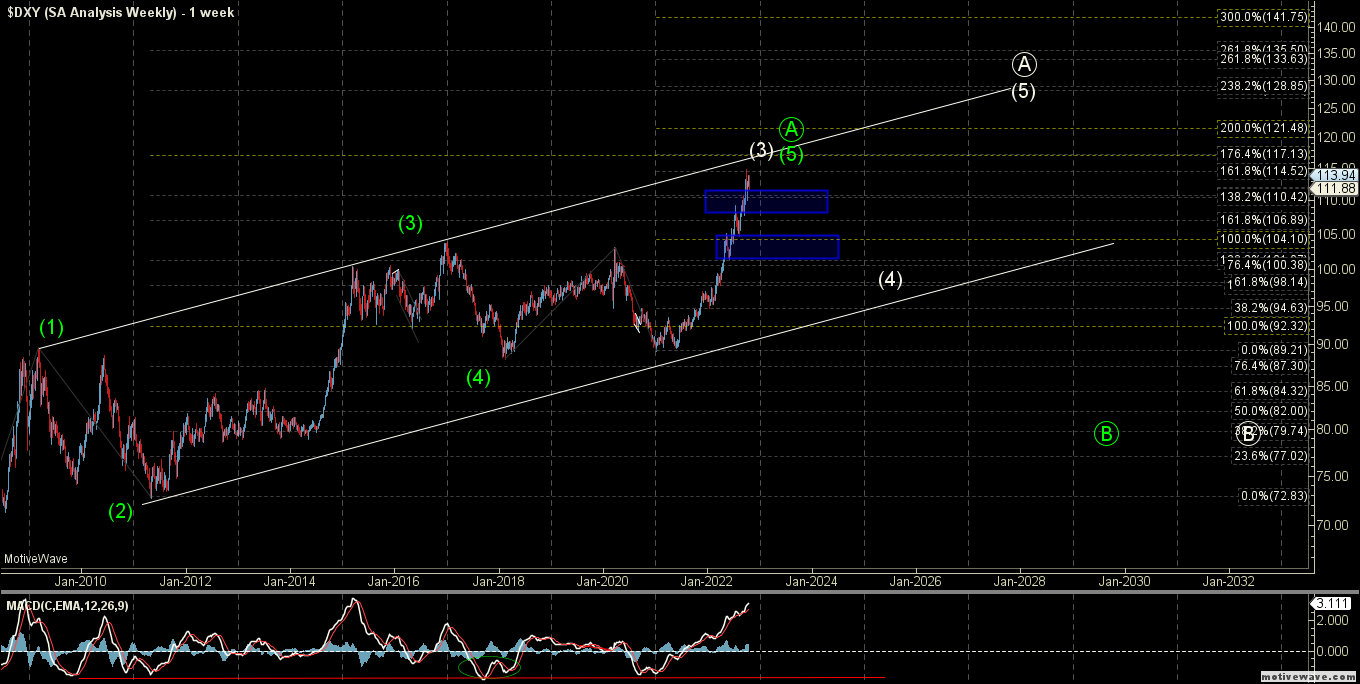
GREEN COUNT:
Bigger picture still I do not have too much to add to what I noted over the past several weeks and ideally, this still should see a move higher toward the upper end of the Trend Line that was established off of that 2008 low. That trend line comes in near the 117-120 zone and again we certainly can see this push up towards that zone before finding a top in the larger wave ((A)). From that point, I would then be looking for a larger wave ((B)) down to take this much lower over the subsequent decade.
WHITE COUNT:
The white count also does not have any significant change on the large degree timeframes. Under this count and as it is laid out on the charts we have a similar path to the green count. The difference is that I would be counting the entire move up off of the 2008 low as a larger leading diagonal for a wave ((A)). Under this count, we would only be topping in the wave (3) of that wave ((A)) rather than the wave (5) of that wave ((A)). When this does make a top as laid out in the parameters above the next pullback would only count as a wave (4) rather than the start of the larger wave ((B)). That would put the bottom range of that wave (4) closer to the 100-98 region before turning higher once again to finish off the larger wave (5) of ((A)). This white count is however the alternate path and I am leaning towards this making a larger degree top as laid out per the green count.
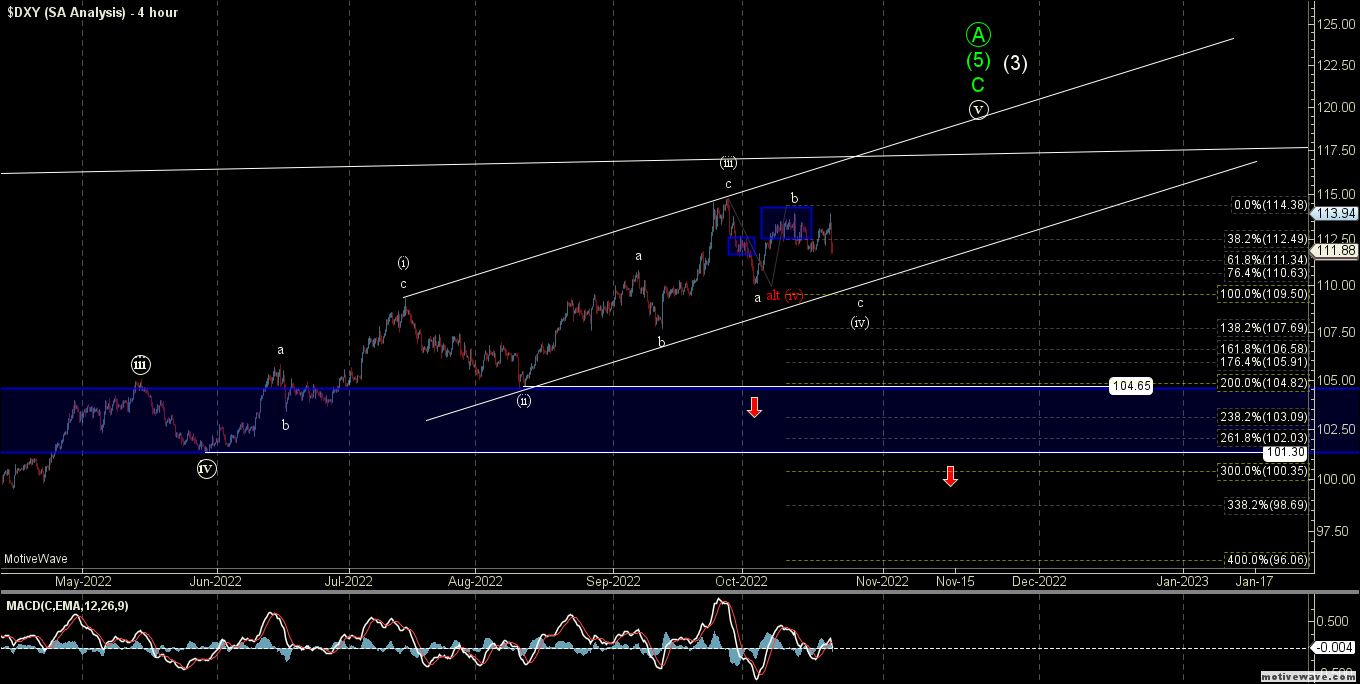
SMALLER DEGREE TIMEFRAMES (BOTH COUNTS)
As I have been noting on the smaller timeframes it does look like we still have some work to do before we finish off the wave ((V)). This would be the case for both the white and the green counts. I am currently counting this move down off of the highs as part of the wave ((iv)) of the final wave ((V)). I think this move up would count best as wave b of that wave (iv) still needing another wave c of (iv) down before finding a bottom and then heading higher to complete the wave (V) o ((V)) towards that 117-120 region. If we break directly over the 113.66-114.24 resistance zone then it would suggest that we may have bottomed in all of the wave (iv) and are already in the wave (V) of ((V)) to new highs. As long as we hold that zone however the proportions look much better to still see another wave c of (iv) down before finding an ultimate bottom in the wave (iv). If we do move lower and break the 108-107 region followed by a move through the 104.65 low then it would suggest that we have put in a larger degree top in all of either the green wave ((A)) or the white wave (3).
I am still leaning towards this seeing another higher high but once this move is completed I think the reversal to the downside is going to be quite sharp based on the larger ending diagonal pattern that we have in place since the June of 2022 lows. I do think we need a bit more patients before looking for that sharp move. The risk however is still quite high in this region as the DXY continues to finalize this larger degree pattern that has been in place for several years now..