The US Dollar Continues To Get Hammered Into The Week’s End
 By
By
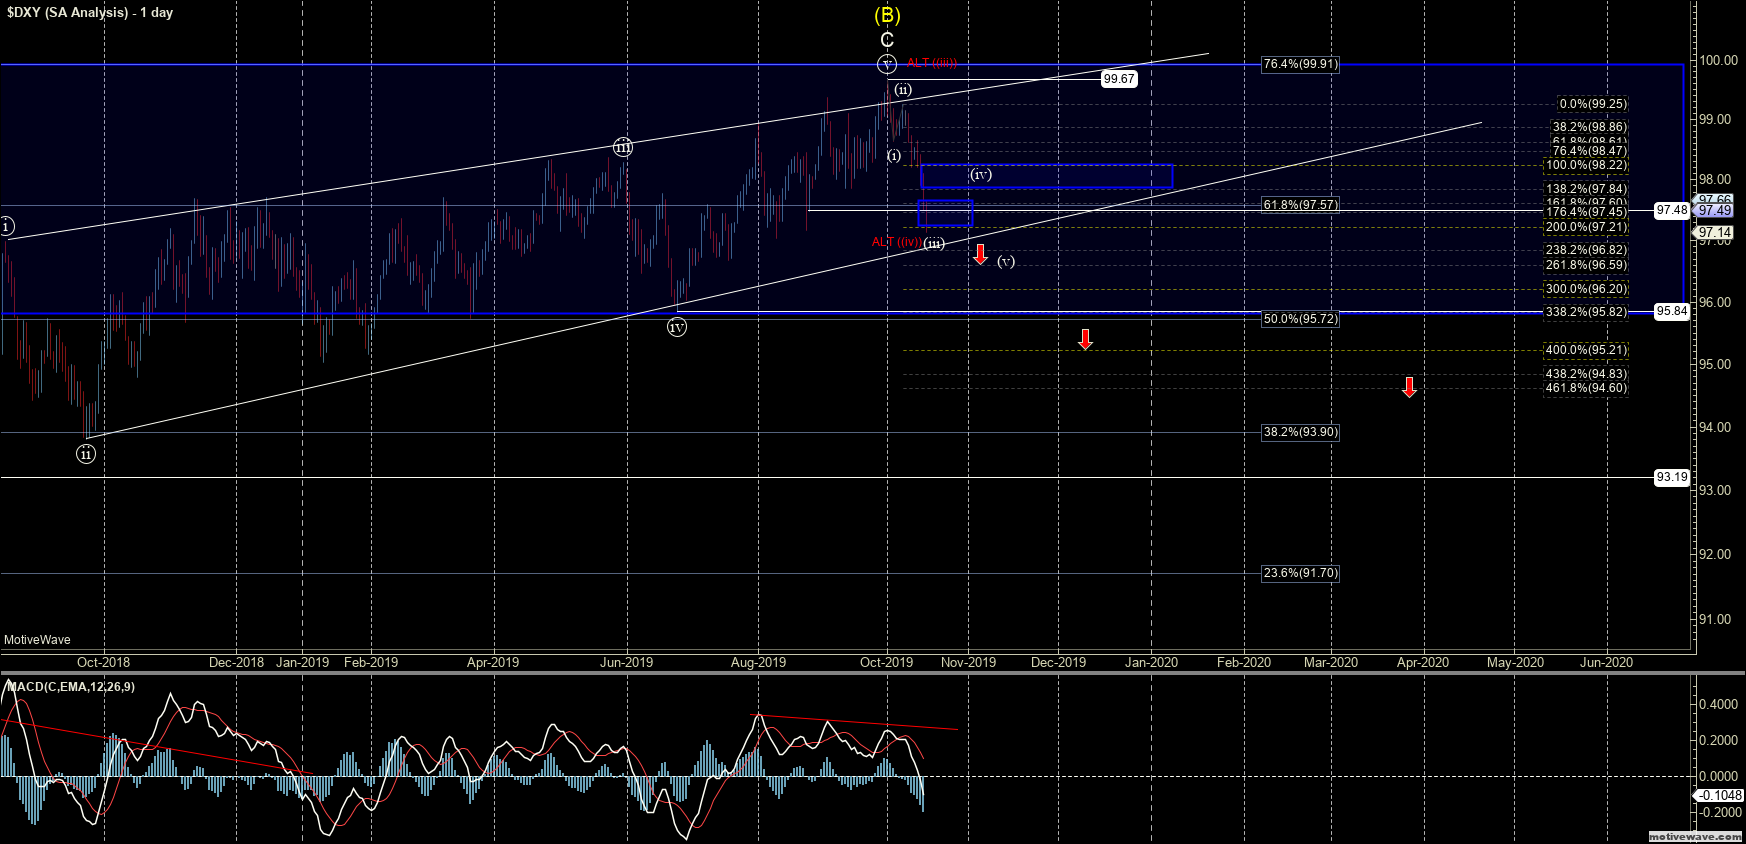
After seeing a strong move lower over the previous two weeks, the US Dollar Index (DXY) saw continued follow-through to the downside, now having made a fairly direct move into the 97.60-97.21 zone, which I laid out last week. This move is certainly giving us some additional confirmation that we may have indeed struck a top in the larger degree wave (B) at the 99.67 level. We do still need to see some additional confirmation either structurally or with a break of some key downside support levels; however, this direct move into the expected target zone is certainly a good sign that this may have indeed already struck a top.
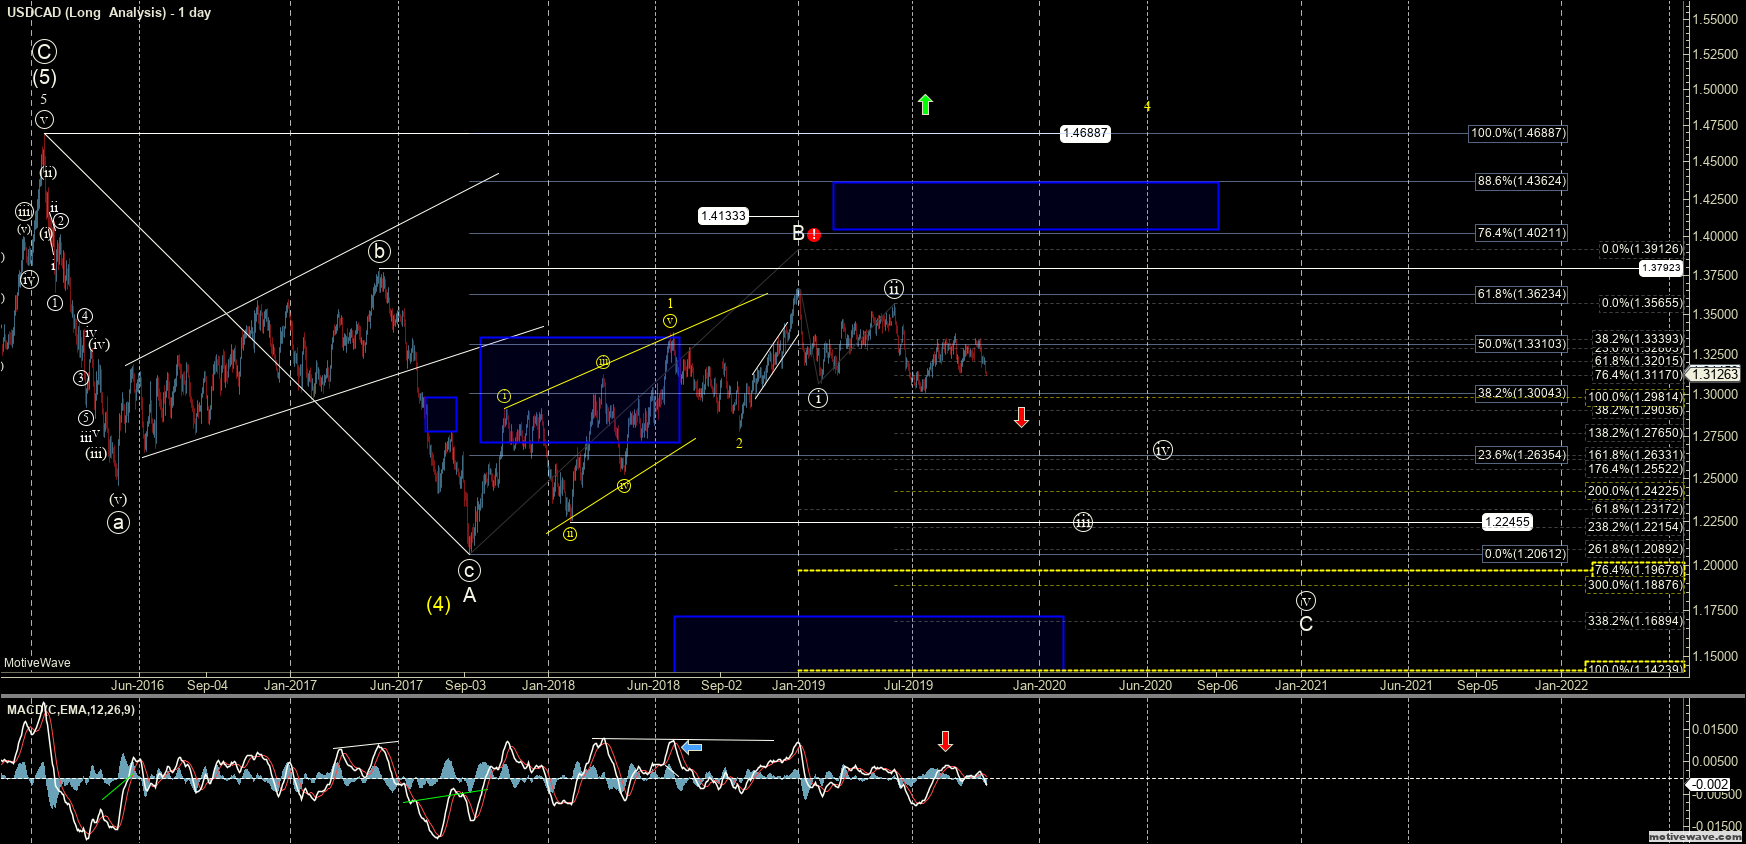
Over the past several months I have been keeping a very close eye on several of the underlying currency pairs to help give some additional guidance and confirmation of a potential top on the DXY. Last week we saw the GBP/USD trigger its upside pattern and breakout higher which was helping give us some additional clues that the DXY may have indeed topped. The USD/CAD, however, was still lagging behind a bit as of last week’s writing. This has changed a bit this week as we have seen the USD/CAD move sharply lower and it is now beginning to also show some additional weakness and follow-through on the bearish primary count that I have been watching on this pair for quite some time. I do still want to see some additional downside follow-through on the USDCAD with a break of the 1.3000 level to give us further confirmation that we may have also struck a top in this underlying pair.
Bigger picture and as noted previously, because the DXY is likely forming a large Ending Diagonal, once this does top I expect to see a sharp move back down towards at least the 93.19 level. This is the origination point of the ending diagonal and therefore the initial target zone upon a reversal out of this pattern. If that 93.19 level gets taken out, then we should ultimately see a move back below the 88.25 low to complete the larger degree corrective pattern on the DXY.
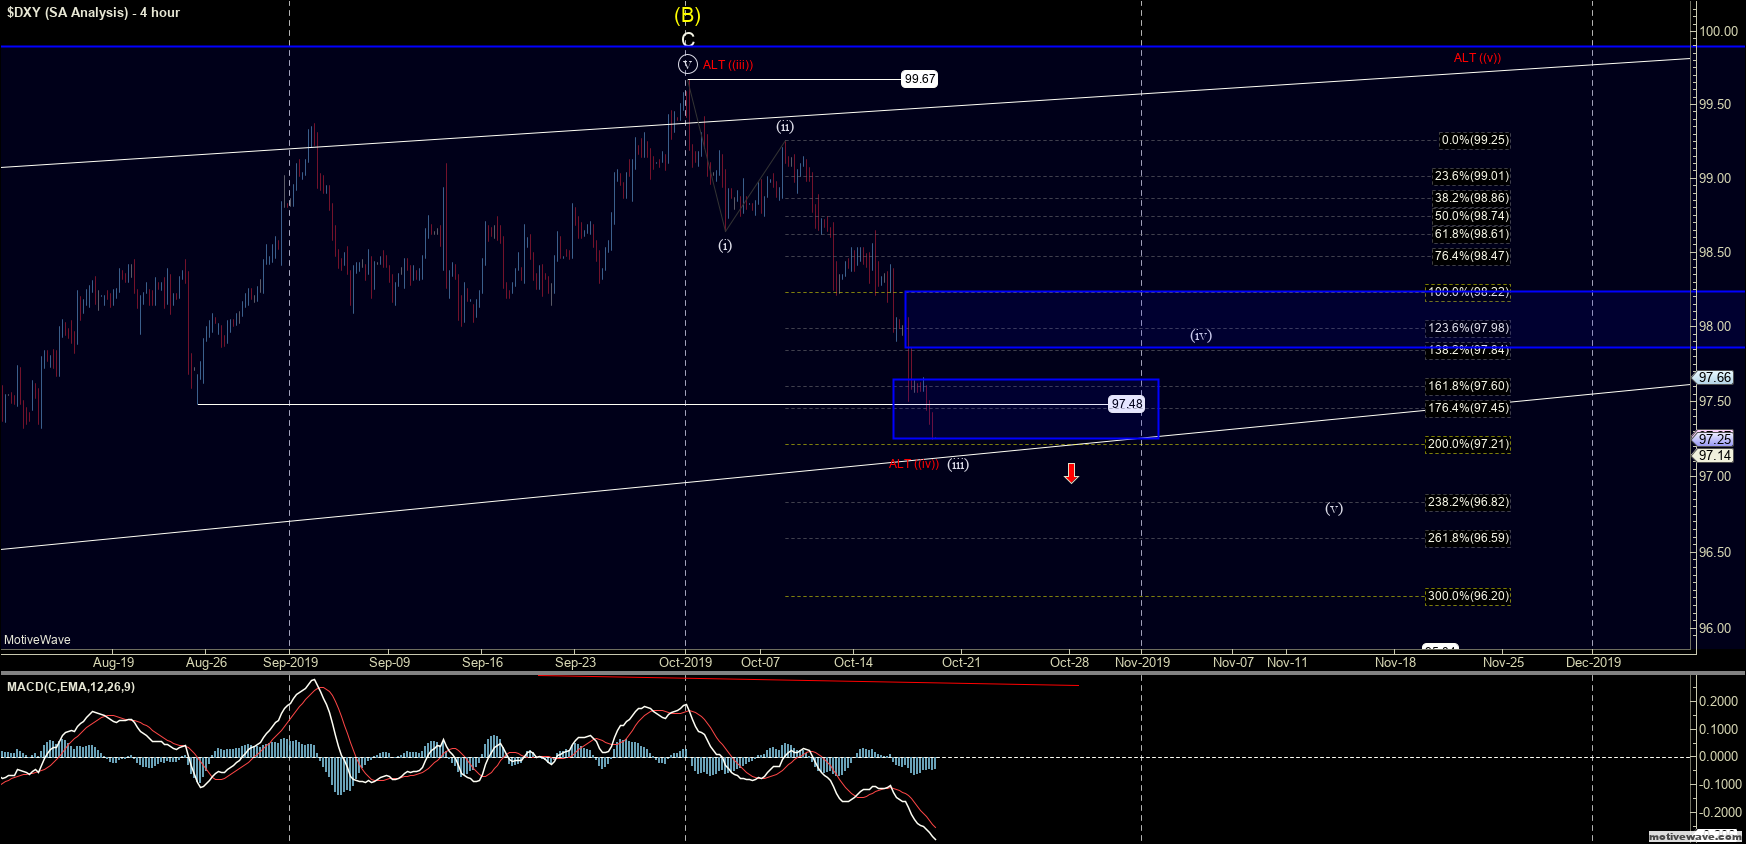
On the smaller timeframes, I am now watching the 97.21 level followed by the 36.82 level as further direct price levels below that the larger degree top may be in place. With that being said, because we are in the near term target zone I would expect to see a small bounce or consolidation somewhere in this region. As long as we do not move back over the 98.22 level then I will be viewing any bounce as a corrective move in a still bearish larger degree pattern. If we can get that bounce and then make one more low then along with breaking our price support levels we will have a clean five-wave move down off of the highs which would give us a very high probability that this has indeed struck the larger degree top as noted.
At this point, it will take a move back over the 98.22 level followed by a break of the 98.61 level. If at any point we take out the 99.25 level prior to breaking those downside confirmation levels then it would give us a signal that we may be following the alternate path which I am showing in red. This red path still does suggest that the upward grind of the DXY is not quite completed just yet. Even if that alternate path does play out, however, I still remain quite cautious to the long side here on the DXY, as the risks to the downside still outweigh those to the upside, even as we continue to grind higher.