The Trials And Tribulations Of A “Market In Turmoil”
When the market broke down below 2880 on the S&P 500 (SPX), we warned all our subscribers that we are likely entering into a very trying period in the stock market. As I personally noted I was doing, going to cash was the wise course of action once that support broke, and, thus far, it remains the prudent choice. Moreover, we strongly warned that you should expect a significant amount of volatility and whipsaw, and the market has truly delivered on that expectations as well.
While the market continues to whipsaw traders and investors, based upon the outflows we have seen this past week, it certainly seems as though many are finally starting to catch on that we are in a treacherous environment. But, I don’t think we are done just yet.
In our larger degree perspective, the ideal target for a wave 4 of this degree still remains in the 2100/2200 region, which is still much lower. Yet, the question is if we will be able to see a larger degree rally, which I would consider a corrective b-wave, or if the market may even take a direct path to our target below.
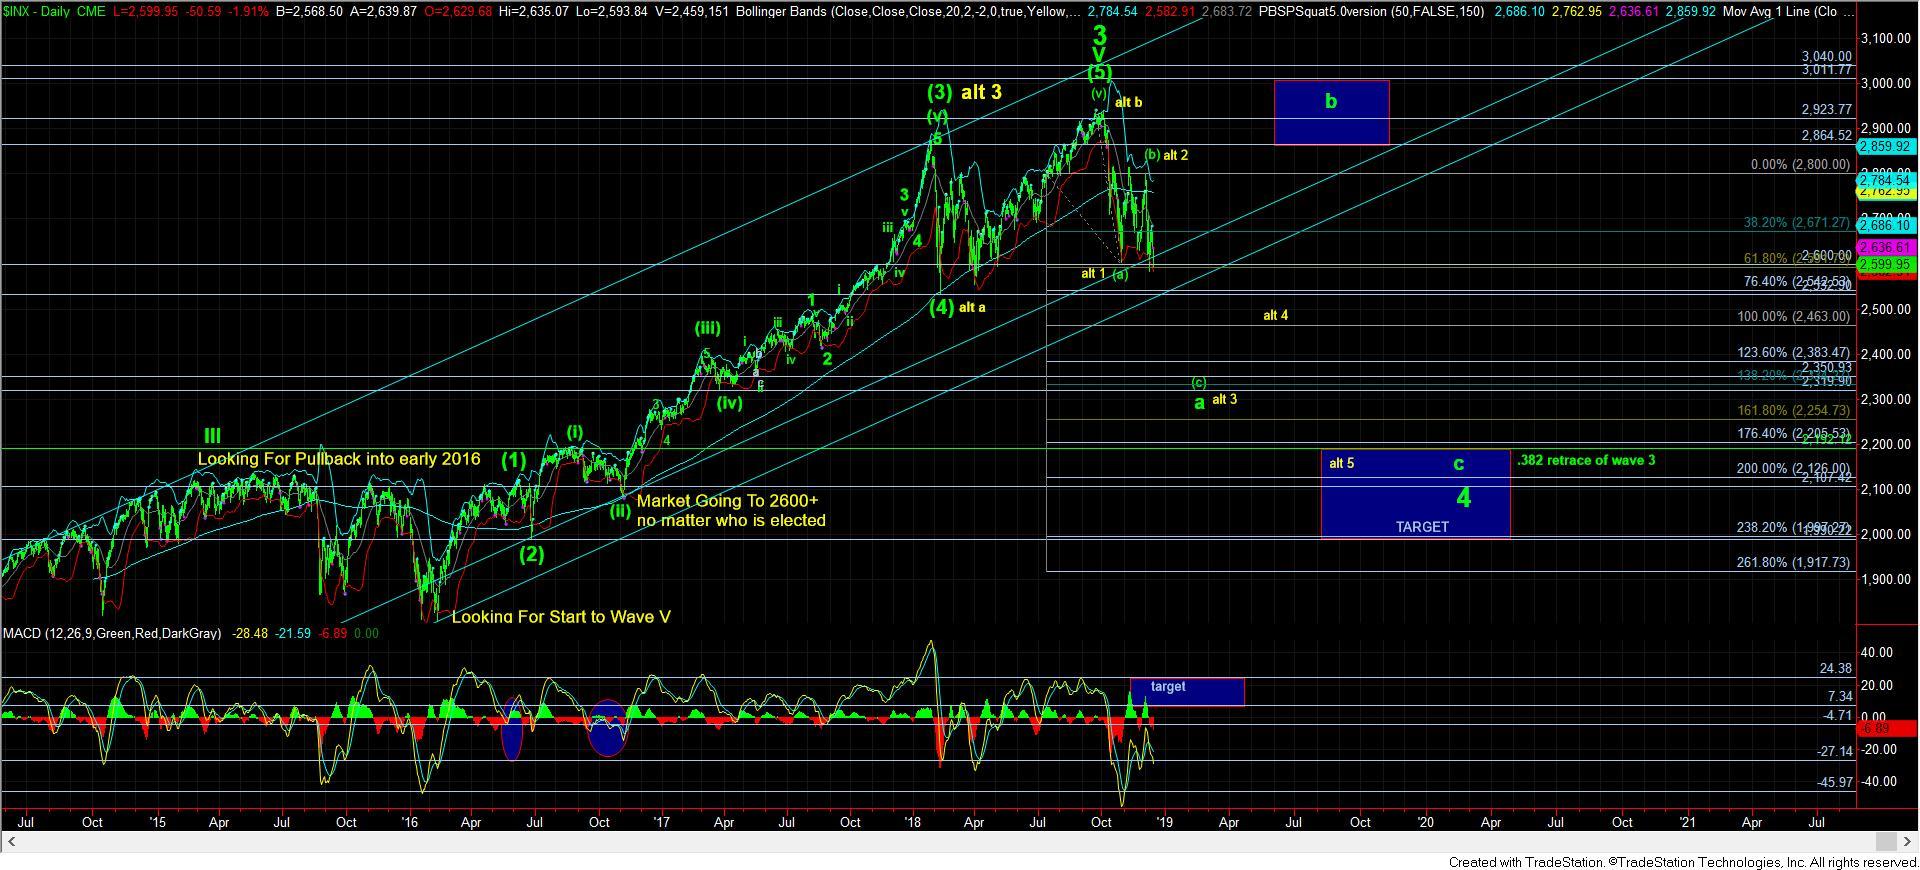
This past week, the market has at least given us a set up for that latter possibility. While it clearly has not been my preferred path as to how this 4th wave takes shape, I simply cannot ignore the immediate downside potential we have on the chart, as presented by the immediately bearish green count. And, until we are able to take out some amount of resistance, I have to take this set up quite seriously despite it not having been my preference to date.
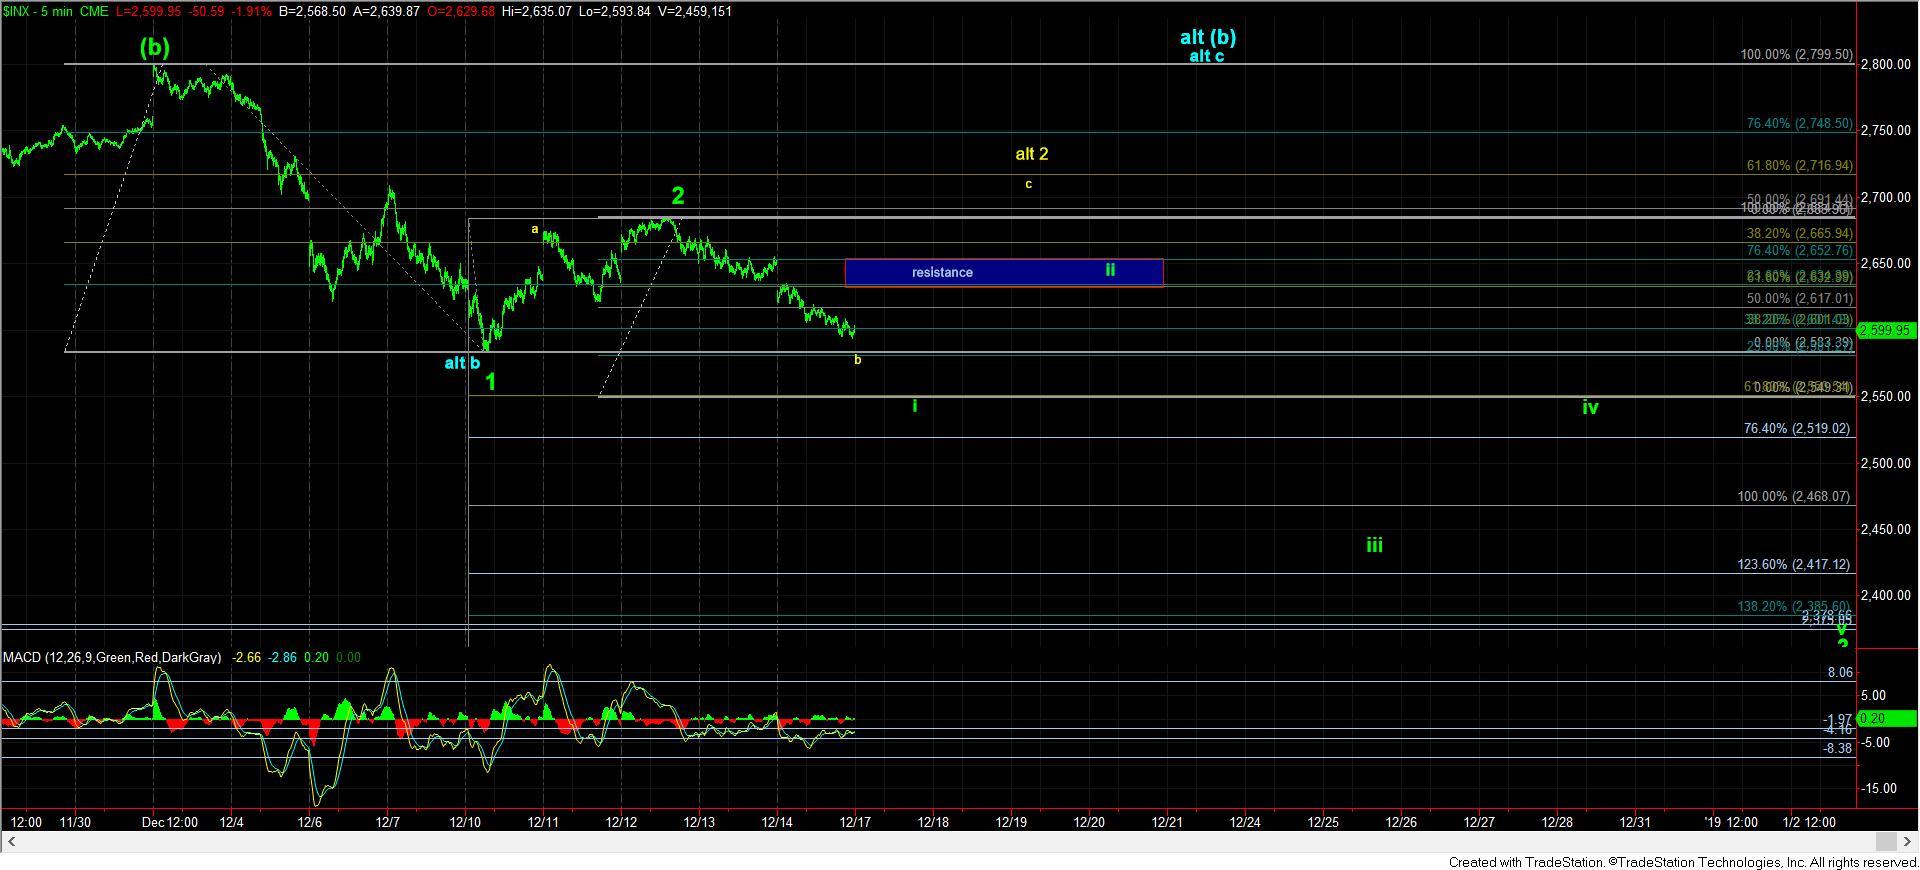
As also noted in my updates this past week, should the market take the green path immediately lower, it opens up potential that we may complete this 4th wave correction sooner than expected as well. If the green pattern gets triggered by a strong drop below 2590 and we cannot get back over 2635-55, all we need is one more wave within this pattern to take us to the larger degree 4th wave target in the 2100-2200 region. Allow me to elaborate further on this potential.
Should we begin to break down precipitously into January of 2019, then I am also going to be tracking an alternative that is highlighted in yellow on the daily chart. Please take a moment to review the daily chart so you can follow along with my thinking on this potential yellow count I outline in the next paragraph.
This alternative would suggest that the market actually topped in wave 3 in early 2018, with a strong decline into January of 2019 actually being the c-wave of wave 4 earlier than I had expected. In order to confirm this potential, we would need to see a drop to at least the 2350 region in direct fashion (as outlined above), followed by a corrective 4th wave rally which remains below 2460-2520SPX resistance, which then leads to lower lows into the 2100-2200 region. This would take us perfectly into our ideal target region for this larger degree 4th wave, with the 1.764-2.00 extension of this pattern pointing exactly to within our ideal target zone for this larger degree 4th wave. Should this pattern follow through in the first half of 2019, then I think we can look to go aggressively long on the completion of wave 5 in yellow into our target zone, with expectations to rally to 3200+ from there. And, yes, this would set us up for another 50%+ rally over the next few years.
So, if the market does break down in the coming week or two before we are able to see a rally back over 2655SPX, then I will send out and continually update a 5-minute chart highlighting each resistance region on our way down. Should the market take out one of those resistance regions on a “bounce,” it would place us on notice that the immediate trip to the 2300 region is going to likely see a detour, and the hallmark whipsaw of an ongoing 4th wave will continue to rule the day. However, if we continue to hold below all resistance regions on the way down, we may be completing this entire 4th wave correction in the first half of 2019.
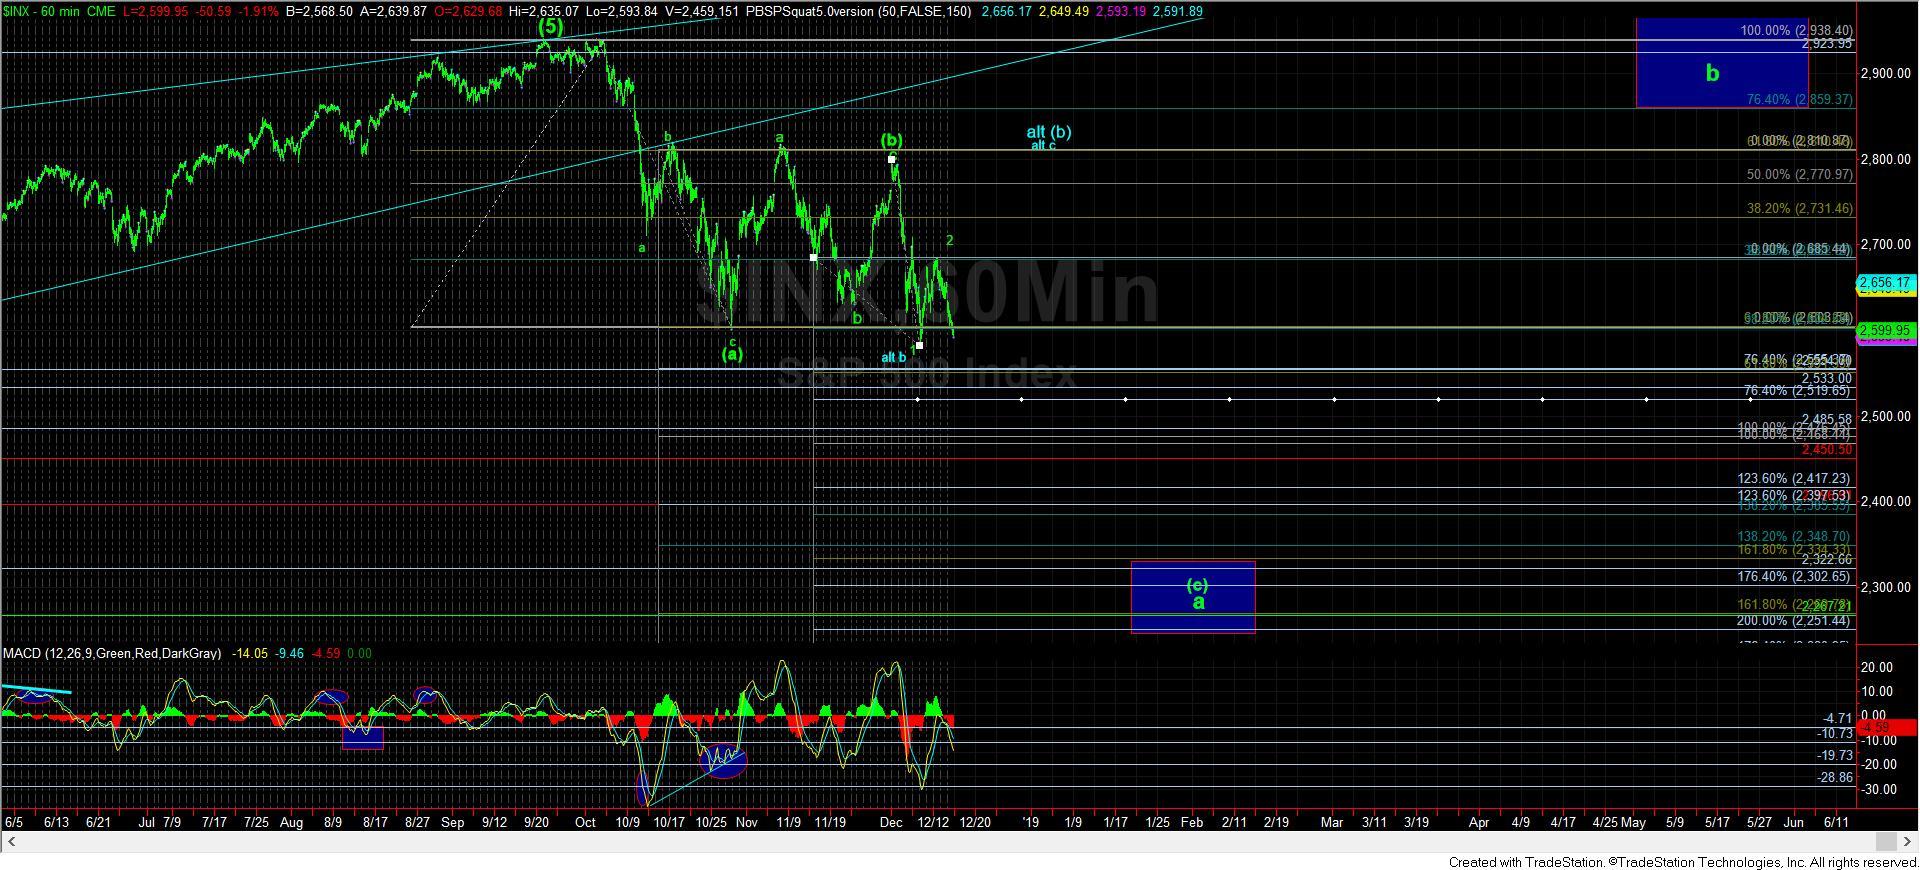
Even if we do follow a break-down path, there is still one more potential path where the market may be able to hold up for the next week or two before we drop precipitously into the 2019 calendar year. Should we break down early in the week below 2590, we may still see a larger corrective bounce in a wave ii should the .618 extension hold in the 2530/50 region, as outlined on the 60-minute chart. So, one way or another, if the market continues to decline beyond this past week’s low it would seem to be projecting down to the low 2300’s within the first quarter of 2019 as long as we remain below 2635-55.
As you can see, there are still a number of potential paths I am tracking for this correction. And, unfortunately, this is not uncommon when it comes to 4th wave corrections. Remember, 4th waves are the most variable wave within the 5-wave Elliott structure. So, I would rather be prepared for the various potentials I am seeing in the market as opposed to being taken by surprise. This is the reason I will be constantly updating the 5-minute chart to provide early warning of a failure to follow through should this immediate downside set up take hold. As Ben Franklin said, “by failing to prepare, you are preparing to fail.” And, I do not like to fail, especially when your money is on the line.
In conclusion, while my preference (but not necessarily primary count) has been to see at least a bigger (b) wave rally as presented in blue on the 60-minute chart, the market has given me no indication that this is the path it is choosing at this point in time. Rather, the market is providing us warning for a more immediate decline. And, when pressure remains down in the overall market during a market correction, I think it is foolish of me to fight this trend until some resistance is finally taken out.
At this point, I am concerned that much of what I have written above may have confused some of you, especially those of you that are new to Elliott Wave analysis. So, allow me to distill this analysis into one final summary paragraph which should make it much clearer to all.
For now, the point in common for all patterns outlined above is the resistance in the 2635-55 SPX region, whereas upper support is right where we closed on Friday, with the next lower support in the 2530-50 region. So, no matter what path the market chooses to take in the coming weeks, that 2635-55 SPX is important resistance for all immediate decline patterns we are tracking, and it should be your primary focus as we head into the end of the year. I will consider the market to be quite weak and extremely vulnerable as long as we remain below that resistance, and it could very well head down to our longer-term target for this larger degree wave 4 sooner rather than later.