The Pullback Is Here In Metals
For those of you that read my weekend analysis, you may remember the title: “Pullback Coming Before Melt-Up Begins.”
Well, the pullback we expected is here.
I am going to start with the gold chart, as that is by far the cleanest chart I am tracking right now. Yet, it also has some challenges due to the large spike that was seen in the overnight session in GC which was not seen in the GLD.
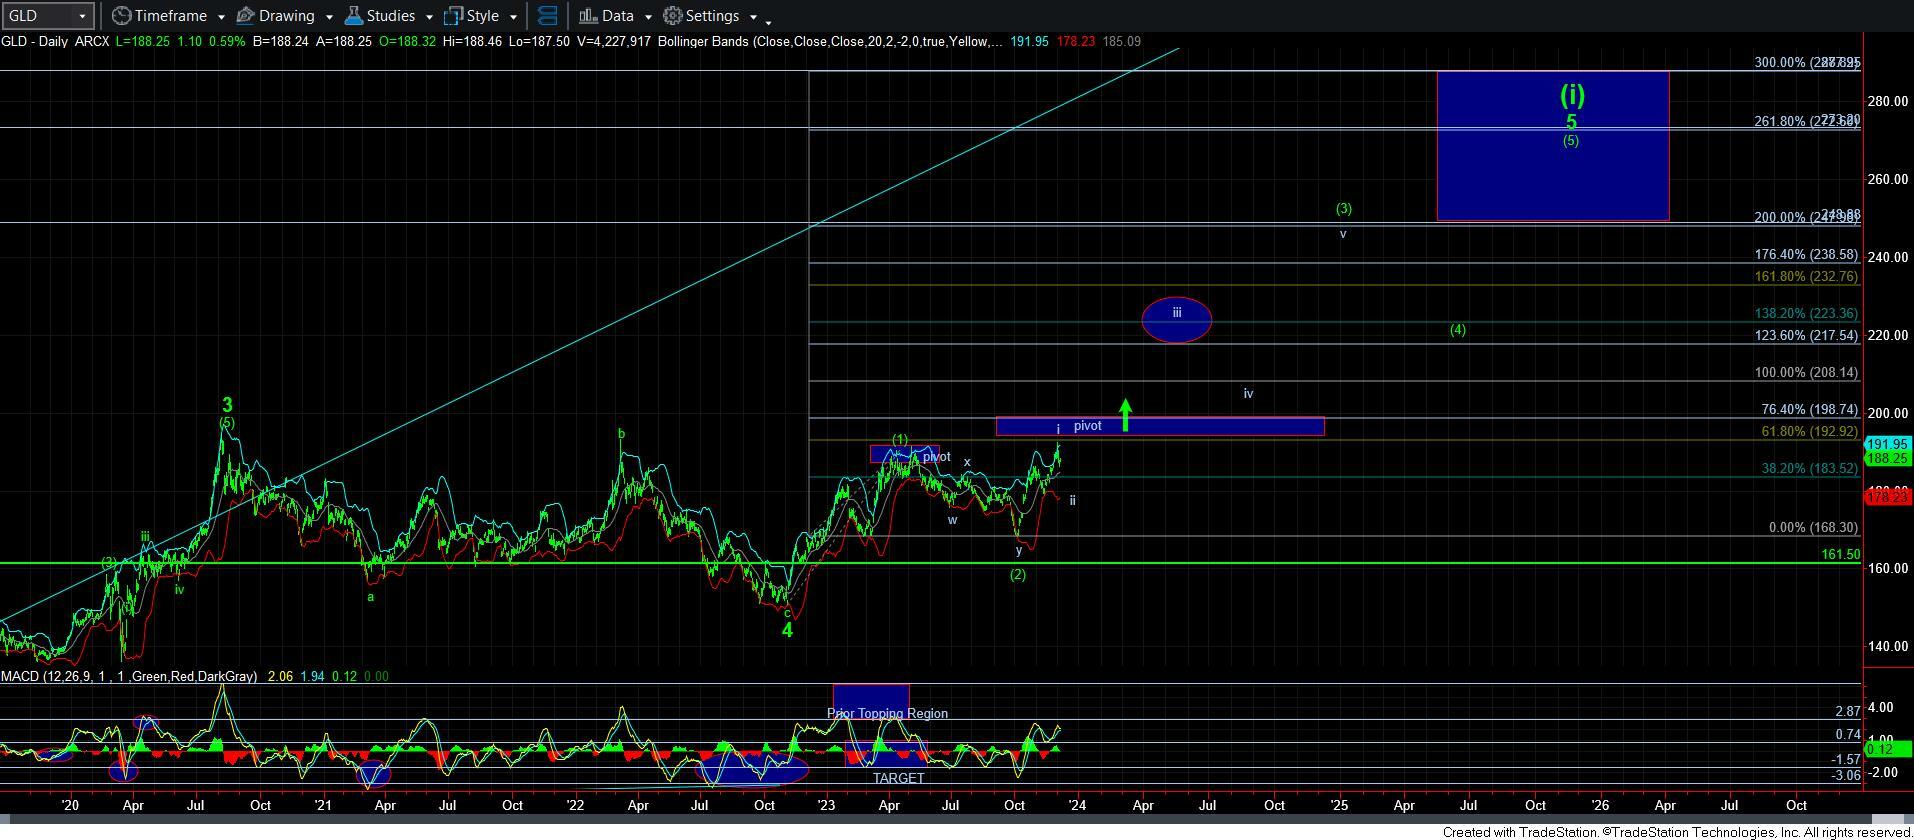
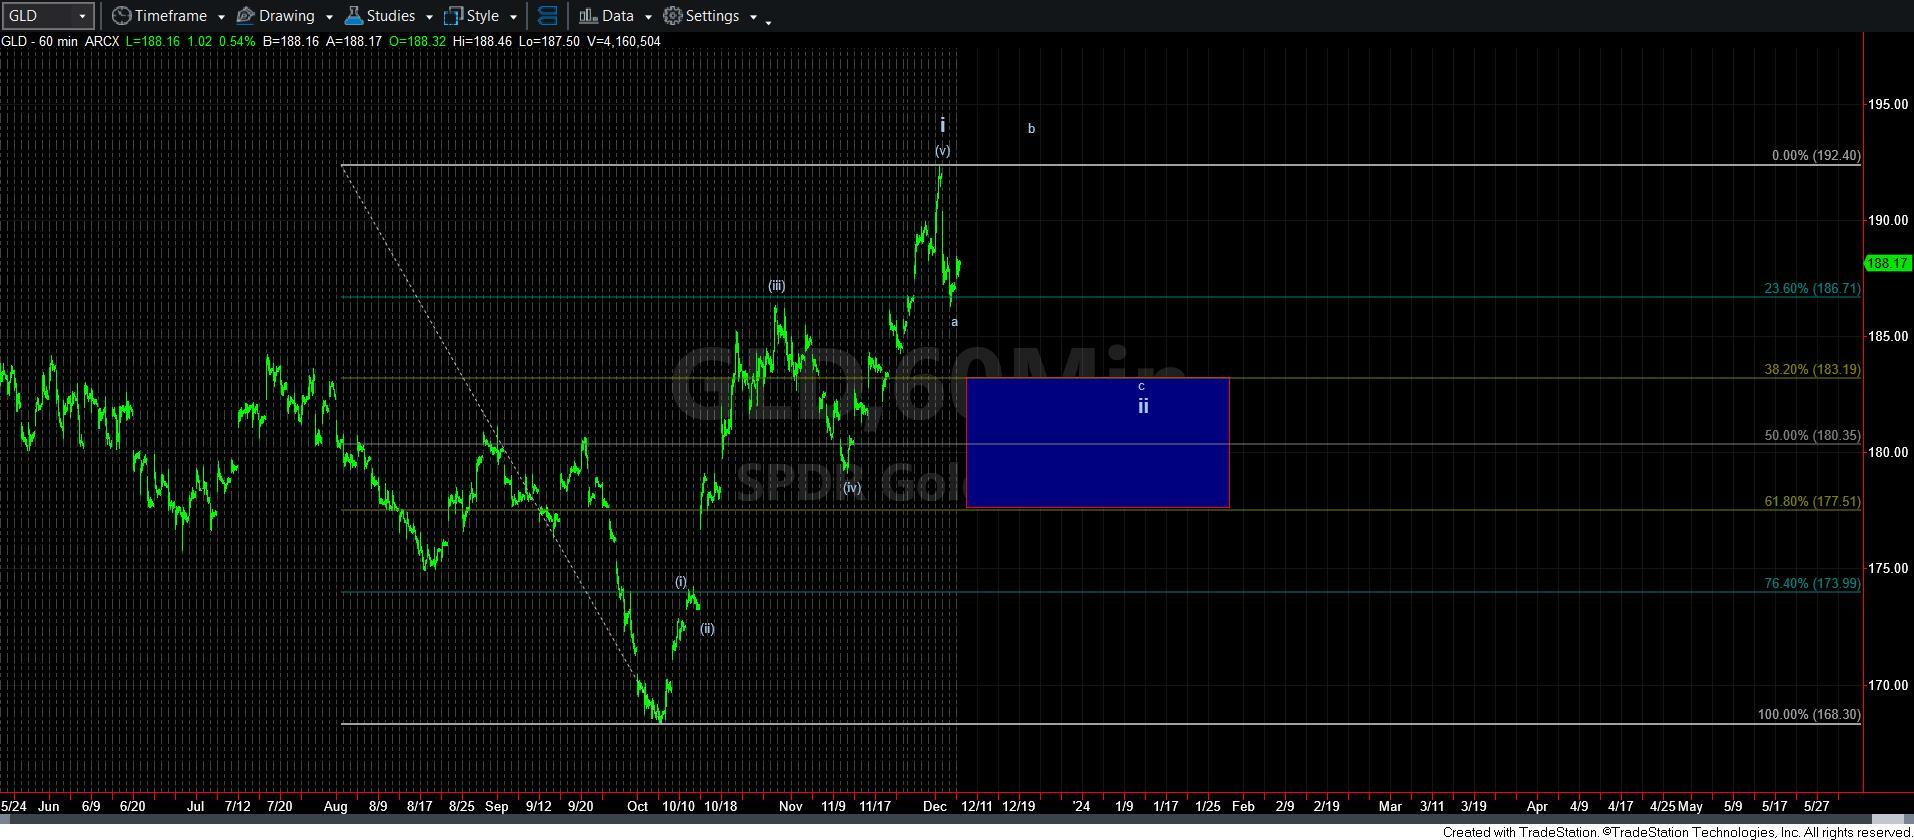
As you can see from the daily GLD chart, we have a clear 5 wave rally off the October low. And in the primary count for GLD, that is wave i of wave [3] of wave 5. So, after wave i, we normally expect a wave ii. I have included a simplified chart of this potential on an attached 60-minute chart of the GLD. And, to be honest, I think we may have a good shot at holding the upper part of that support box.
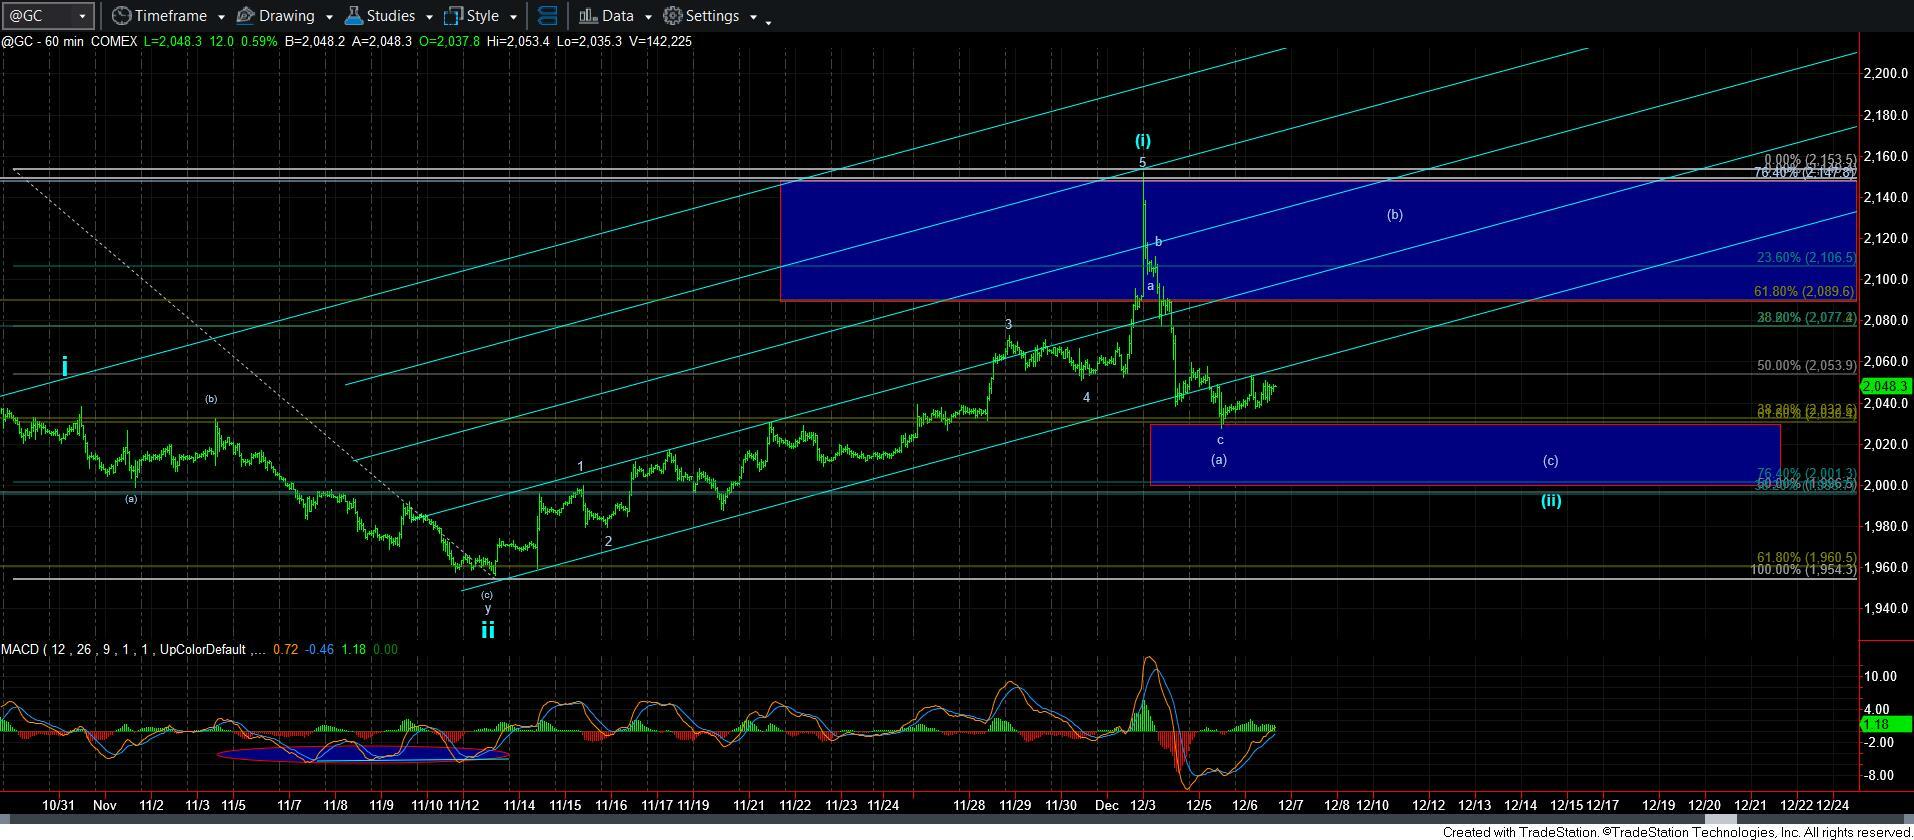
Now, due to the additional rally seen in the GC, it does give us some greater potential for a i-ii, [i][ii] structure I have outlined on the 60-minute GC chart. But, even in this case, I would still likely see an [a][b][c] corrective pullback over the coming weeks. As it stands now, we have just struck the .618 retracement of wave [i] in the more bullish blue count. So, as long as the next bounce is clearly corrective, then I am going to expect one more decline to complete the [c] of wave [ii]. And, again, this is in the more immediate bullish count.
Of course, should the market begin to rally in impulsive fashion over the coming week back towards the high struck in the overnight GC session, then I may have to consider that all of wave [ii] is already done. That would mean that the rally we see back towards that high is wave 1 of wave [iii], and after a wave 2 pullback, a break back out over the high of wave 1 would mean the melt-up is here. But, I think that is getting wayyyyyyyyy ahead of ourselves. I think it is more reasonable to expect more of a pullback to take shape in the coming weeks, especially since I am still unsure if this is the larger i-ii as shown in GLD, or if this is the more accelerated i-ii, [i][ii] shown in GC. But, in either case, the market will give us a strong indication in the coming weeks and we should know well before a break out is seen.
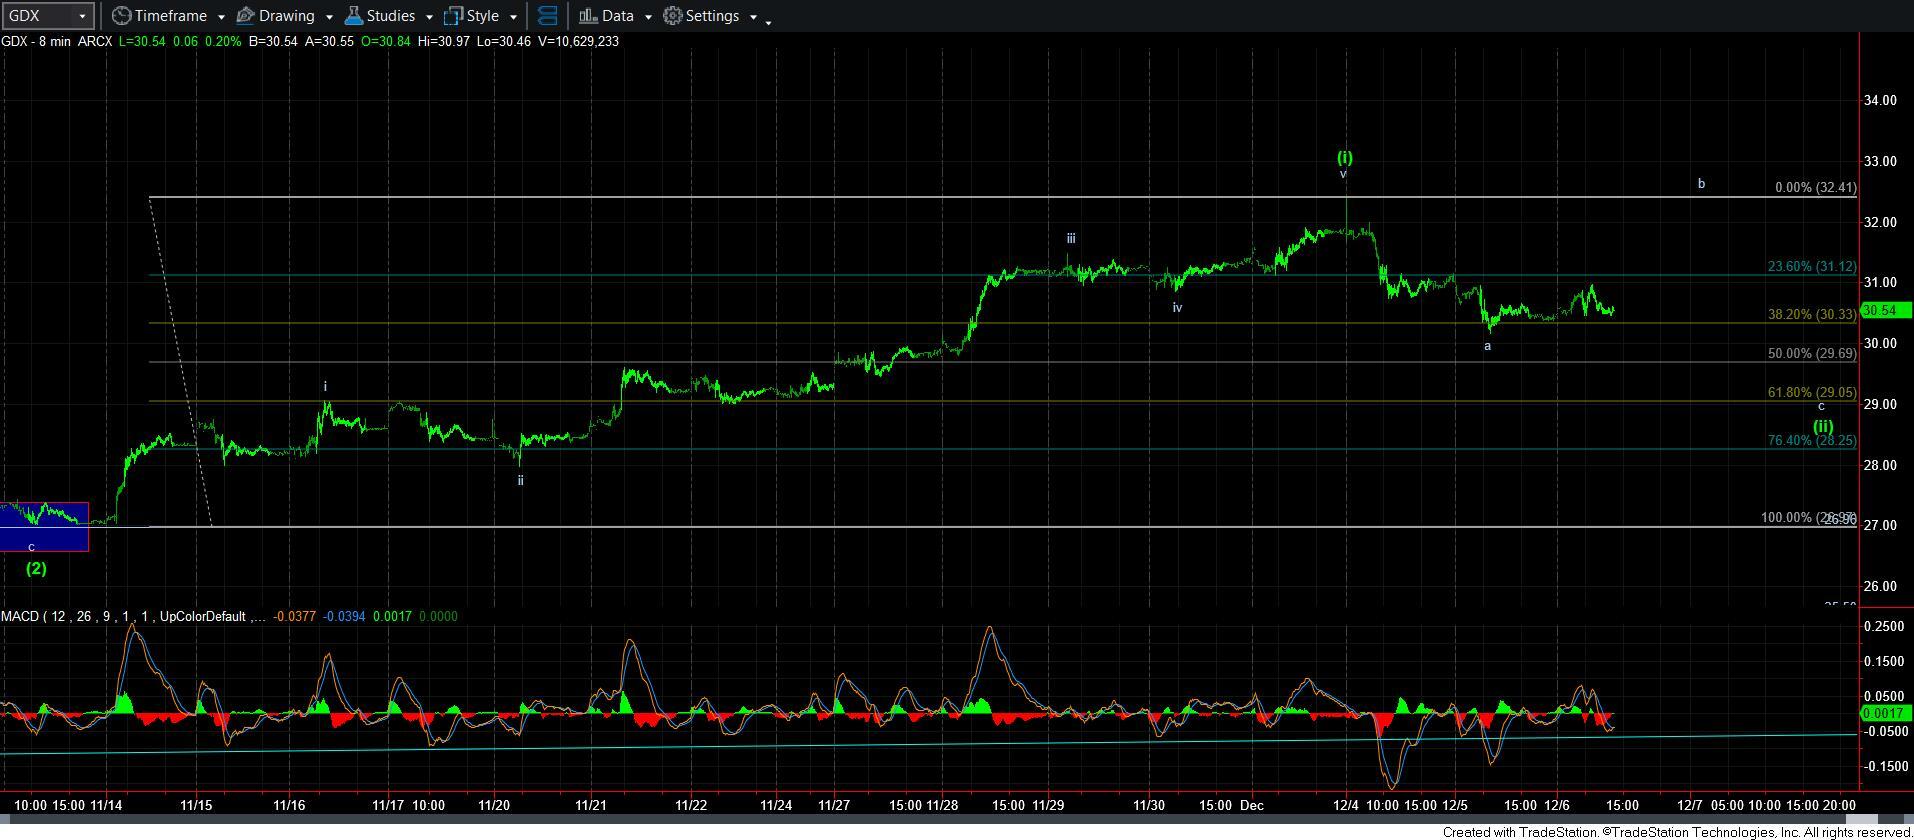
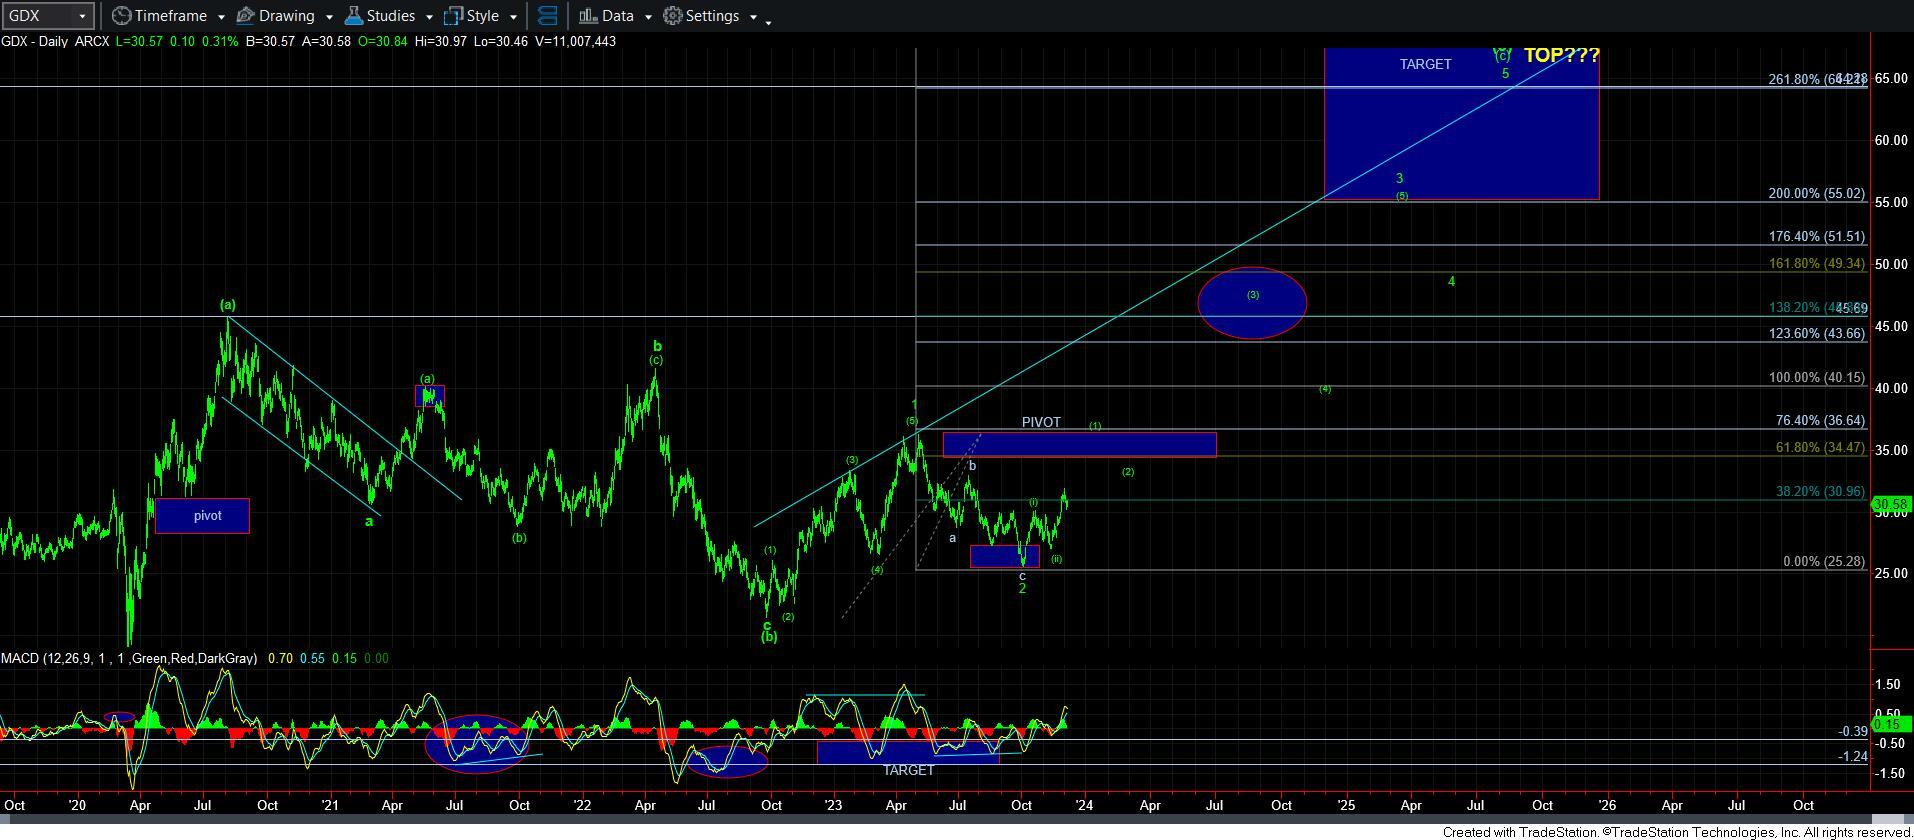
GDX is a bit more problematic, as we have yet to complete its wave [1], as shown on the daily chart and we are still quite short of that structure being completed. So, it makes me consider an alternative, that I am now showing on the 8-minute GDX chart. That would suggest that we actually have a [1][2][i][ii] structure developing rather than a larger [1][2] that I expected to develop at the pivot on the daily chart.
Now, clearly, should the market be able to take out the 33/34 resistance on the next “bounce” then I may go back to the [1][2] shown on the daily chart. But, for now, this may be a more reasonable expectation.
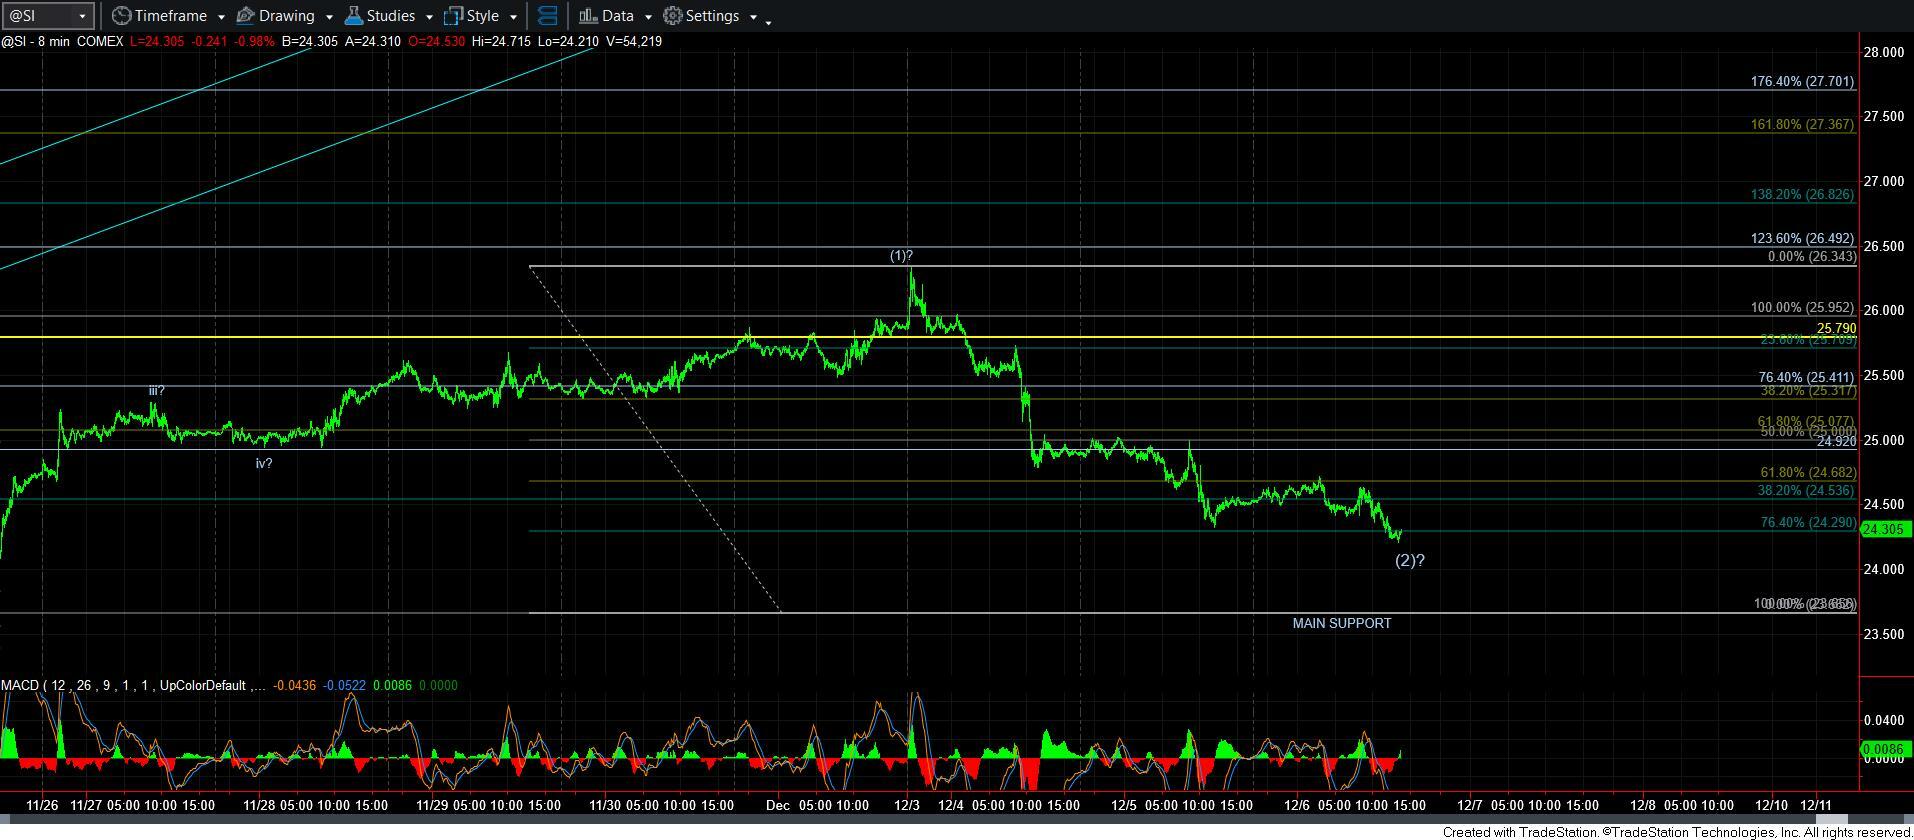
This brings me to silver. And, yes, silver’s pullback is certainly a bit deeper than I would have wanted to see if it were also to be developing as a 1-2, [1][2]. In fact, we are slightly below the .764 retracement of the wave [1] with this decline. So, it certainly makes me question this potential structure. I am going to continue to track this, as I want to see how silver “bounces” in the coming days. If it is clearly impulsive, I will likely keep this count as is. However, if it is clearly corrective, then it adds a layer of complication to silver.
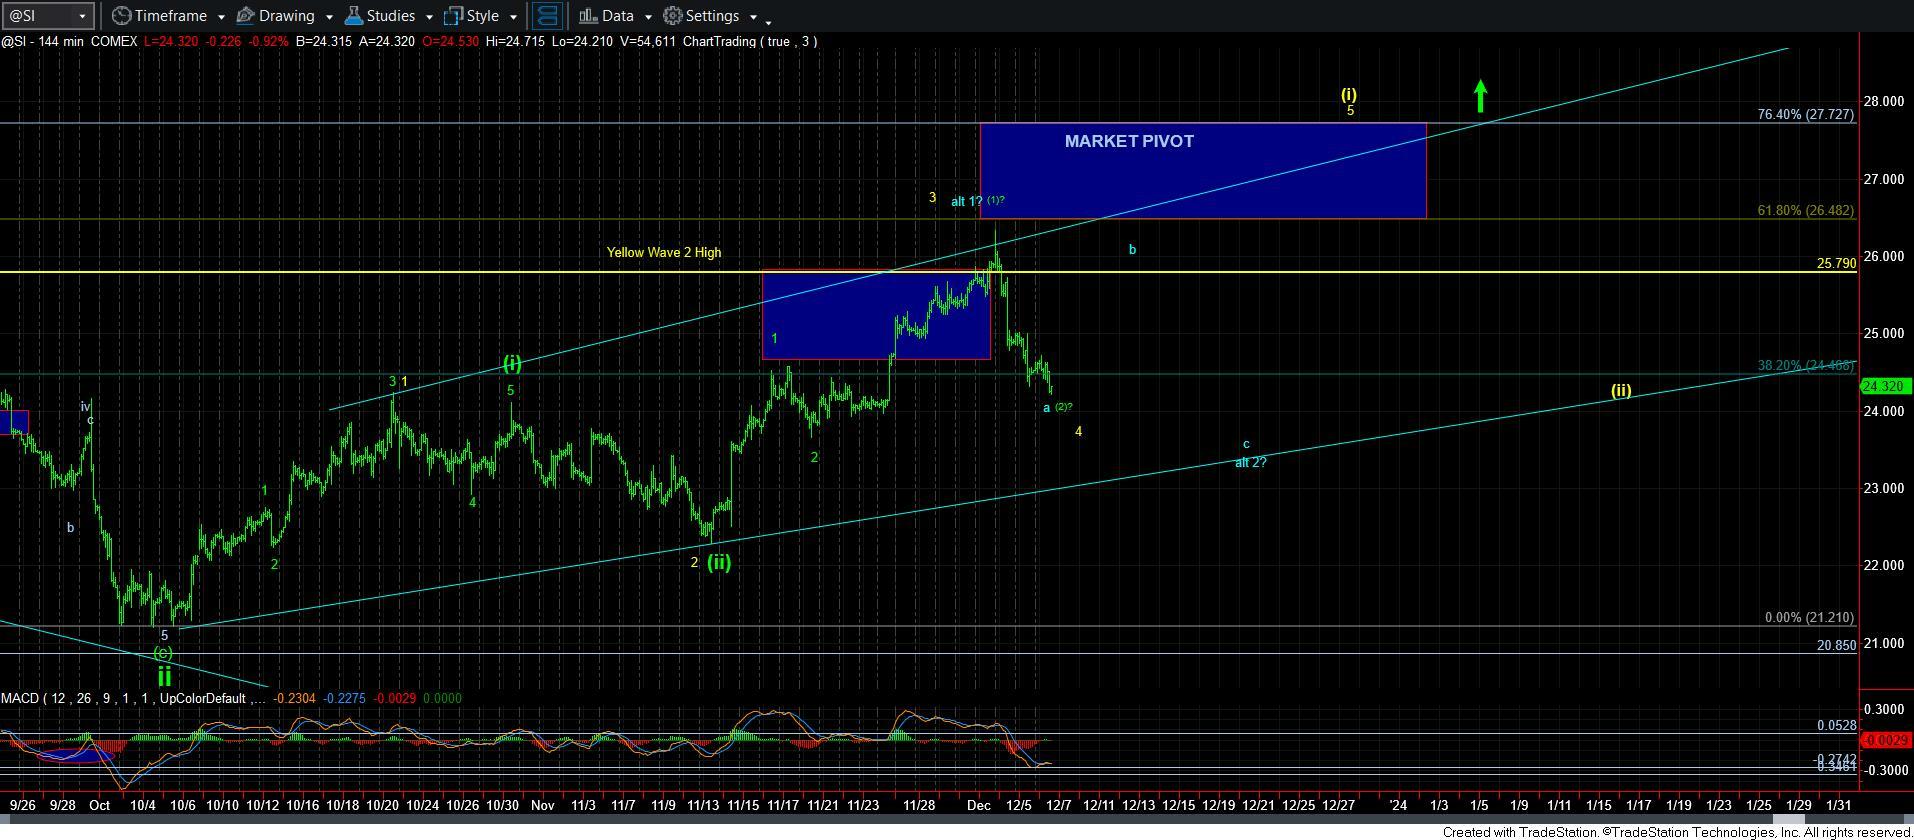
First, if the next bounce/rally is clearly corrective, then I will likely make the alt 1-2 in blue my primary count, as shown on the 144-minute chart. That means that the bounce would be counted as a b-wave of wave 2. And, yes, it would mean that the wave 1 would have had a VERY extended 5th wave, which is not uncommon in metals.
Second, if the next bounce/rally is corrective in structure, yet we rally back into the pivot box overhead, then I may have to consider a larger degree wave [i] as taking shape as a leading diagonal, as shown in yellow on the 144-minute chart.
So, silver has certainly now provided us with a bit of complexity. So, I am going to be tracking it rather carefully in the coming weeks.
The main takeaway from this update should be the following. First, the pullback we have expected is now upon us, and I do not think it is over just yet. But, stay on your toes, as it is quite possible (but not yet probable) that the pullback may be done, as when the metals move into a 3rd wave, pullbacks are sharp but do not last long.
Second, the next time we take out the high in GC or the pivot in GLD (should basically be the same thing) will likely signal that we are in the melt up phase of the heart of a 3rd wave.
Third, until that happens, I think we could see some corrective action taking us through the next few weeks before the melt-up phase of the heart of a 3rd wave likely begins in earnest.