The Problem w/ Being Overweight.
 By
Zac Mannes
By
Zac Mannes
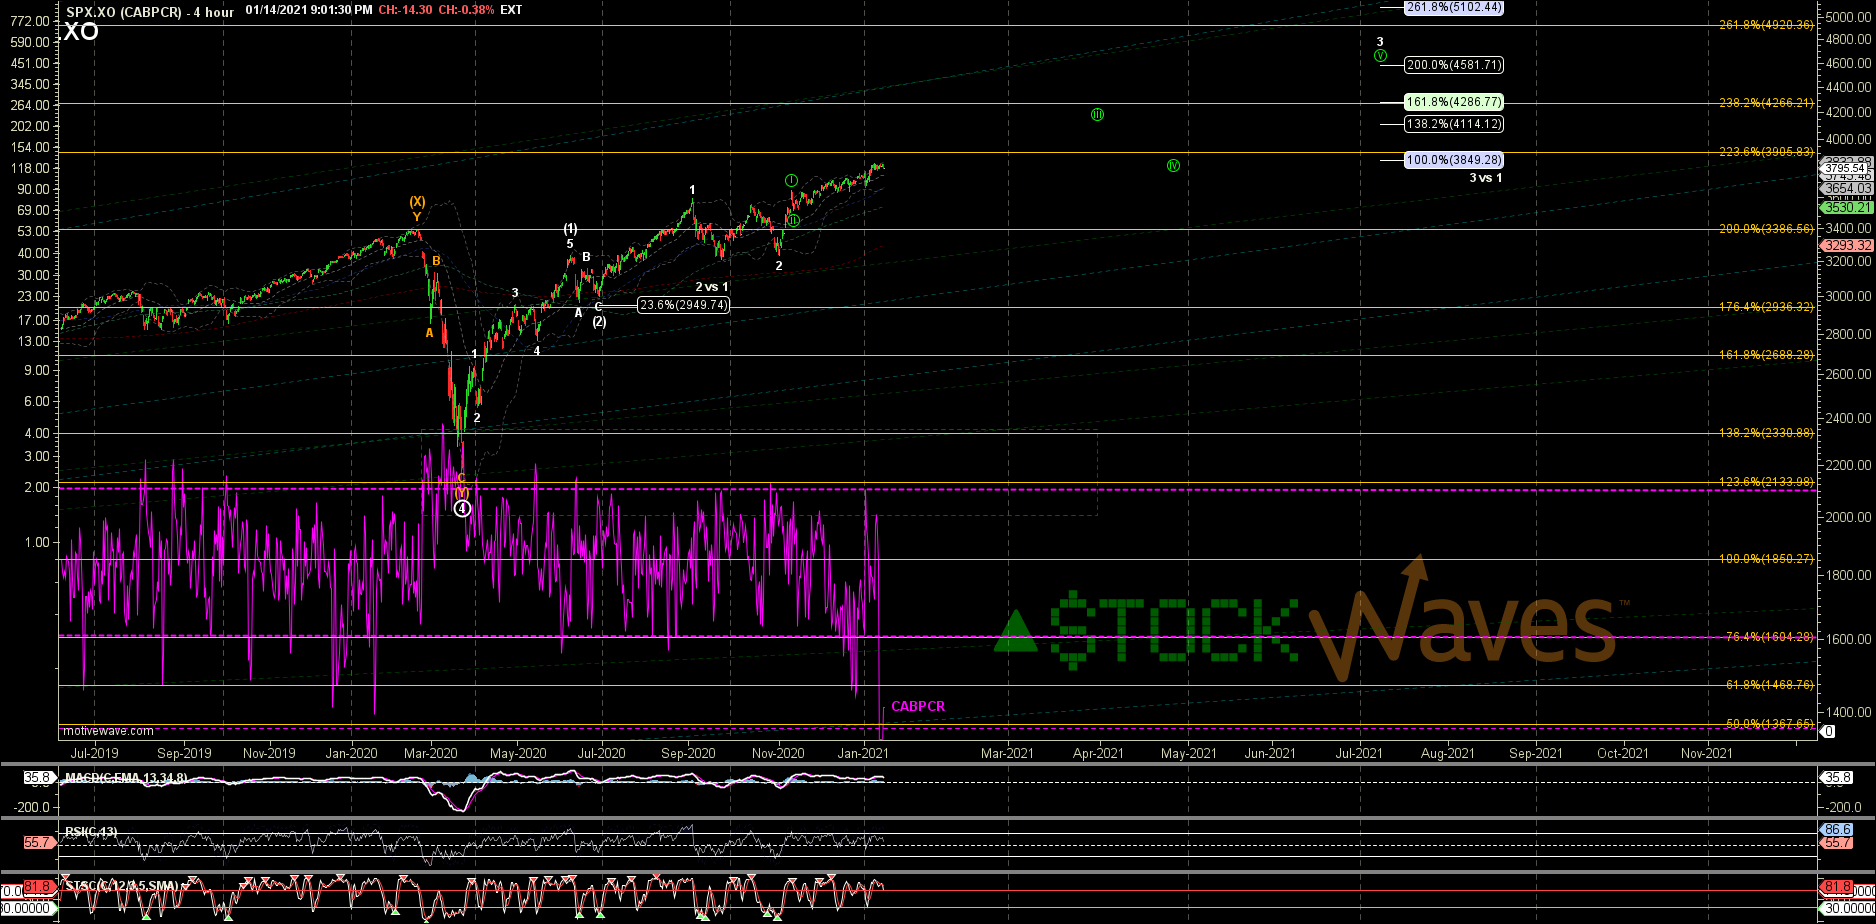
While the 'ol CABPCR might be hitting some temp extremes...
We have to remember a few things:
1) It is a better indicator of bottoms.
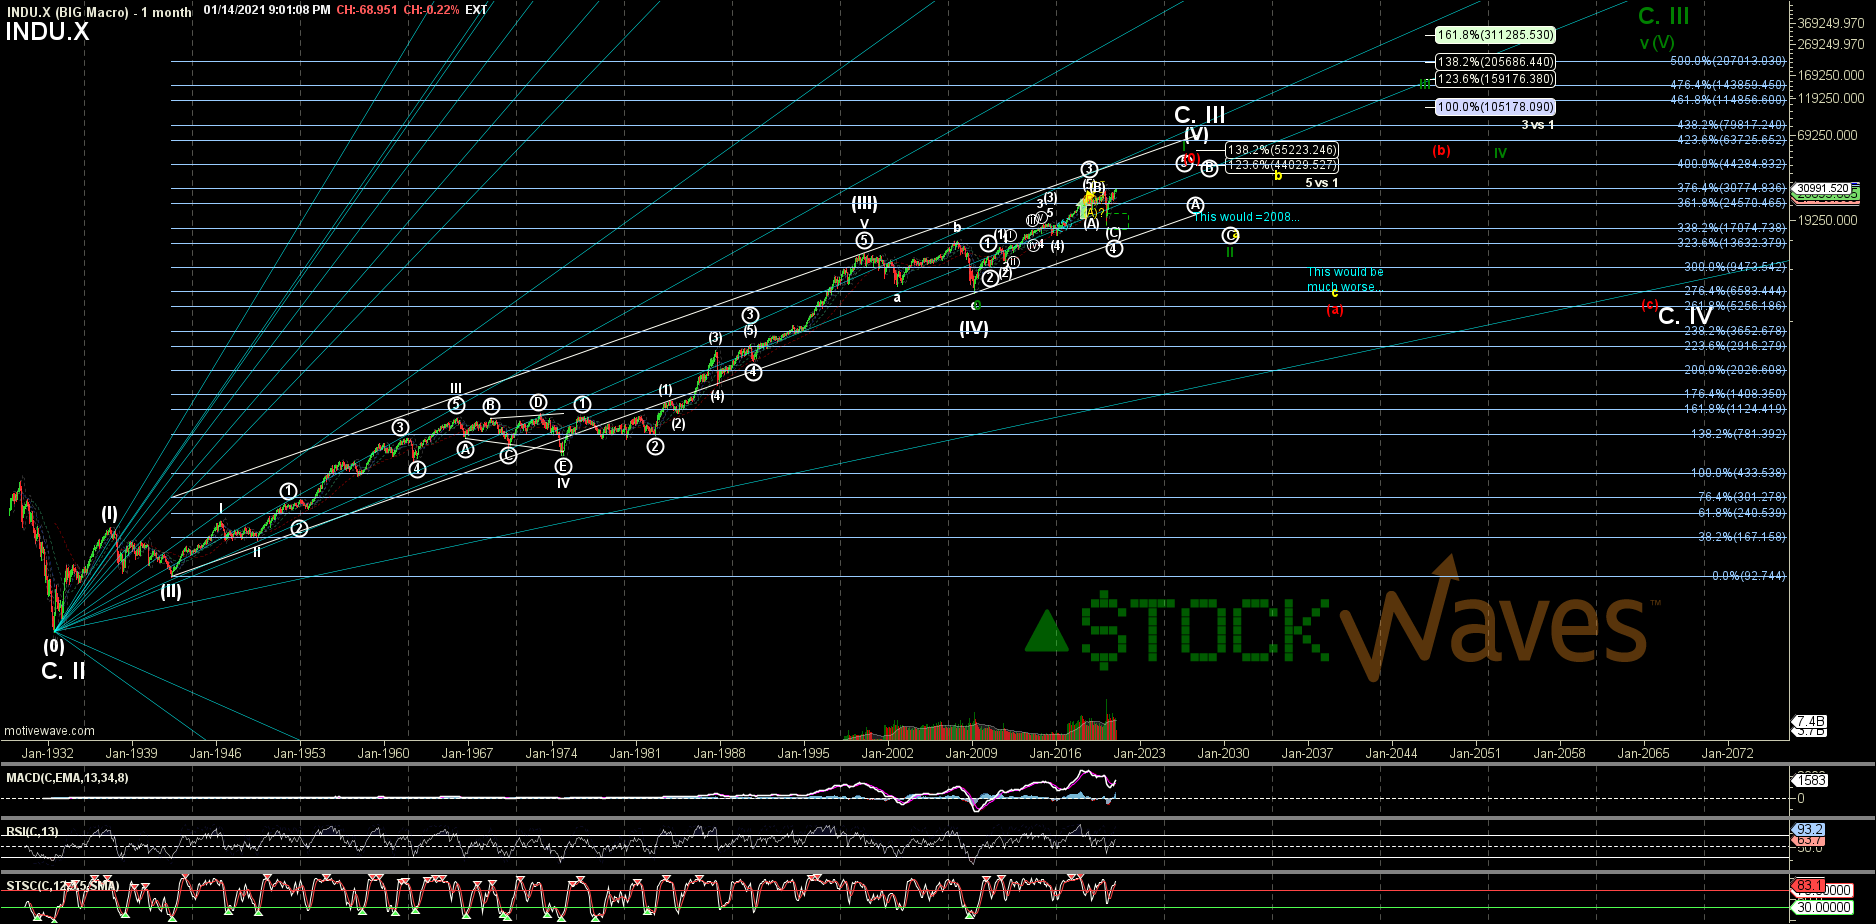
2) We are in the VERY late stages of a rally at multiple degrees. Although we are in the HEART of the 3rd of our Primary wave 5 off the March 2020 lows we have to remember that we are in a fifth and that is of a larger fifth that began in 2009 and that an even larger fifth of a rally that began back in the 1930s! In terms of extremes of sentiment and off the charts "over-bought" indicators... baby, you ain't seen NOTHIN yet!
3) The market is made up of stocks most of the stocks that have driven and lead this rally since March continue to show substantial upside remaining, others are just setting up to pick up the baton. But as mentioned, there is room for some #rotation.
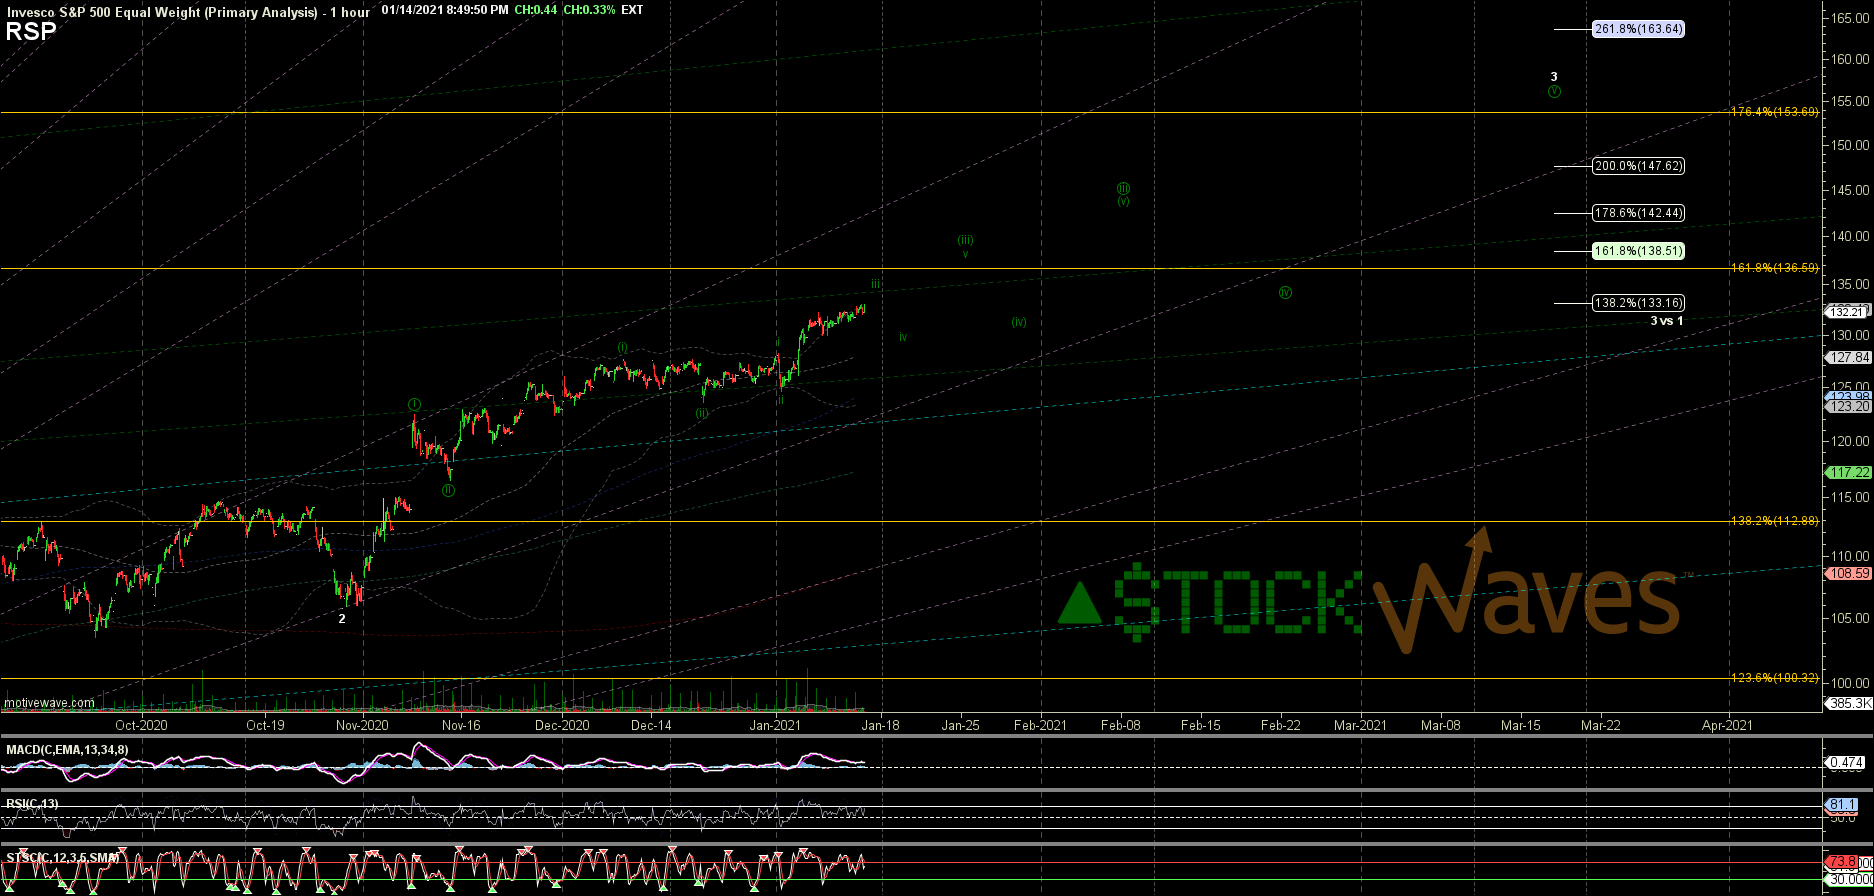
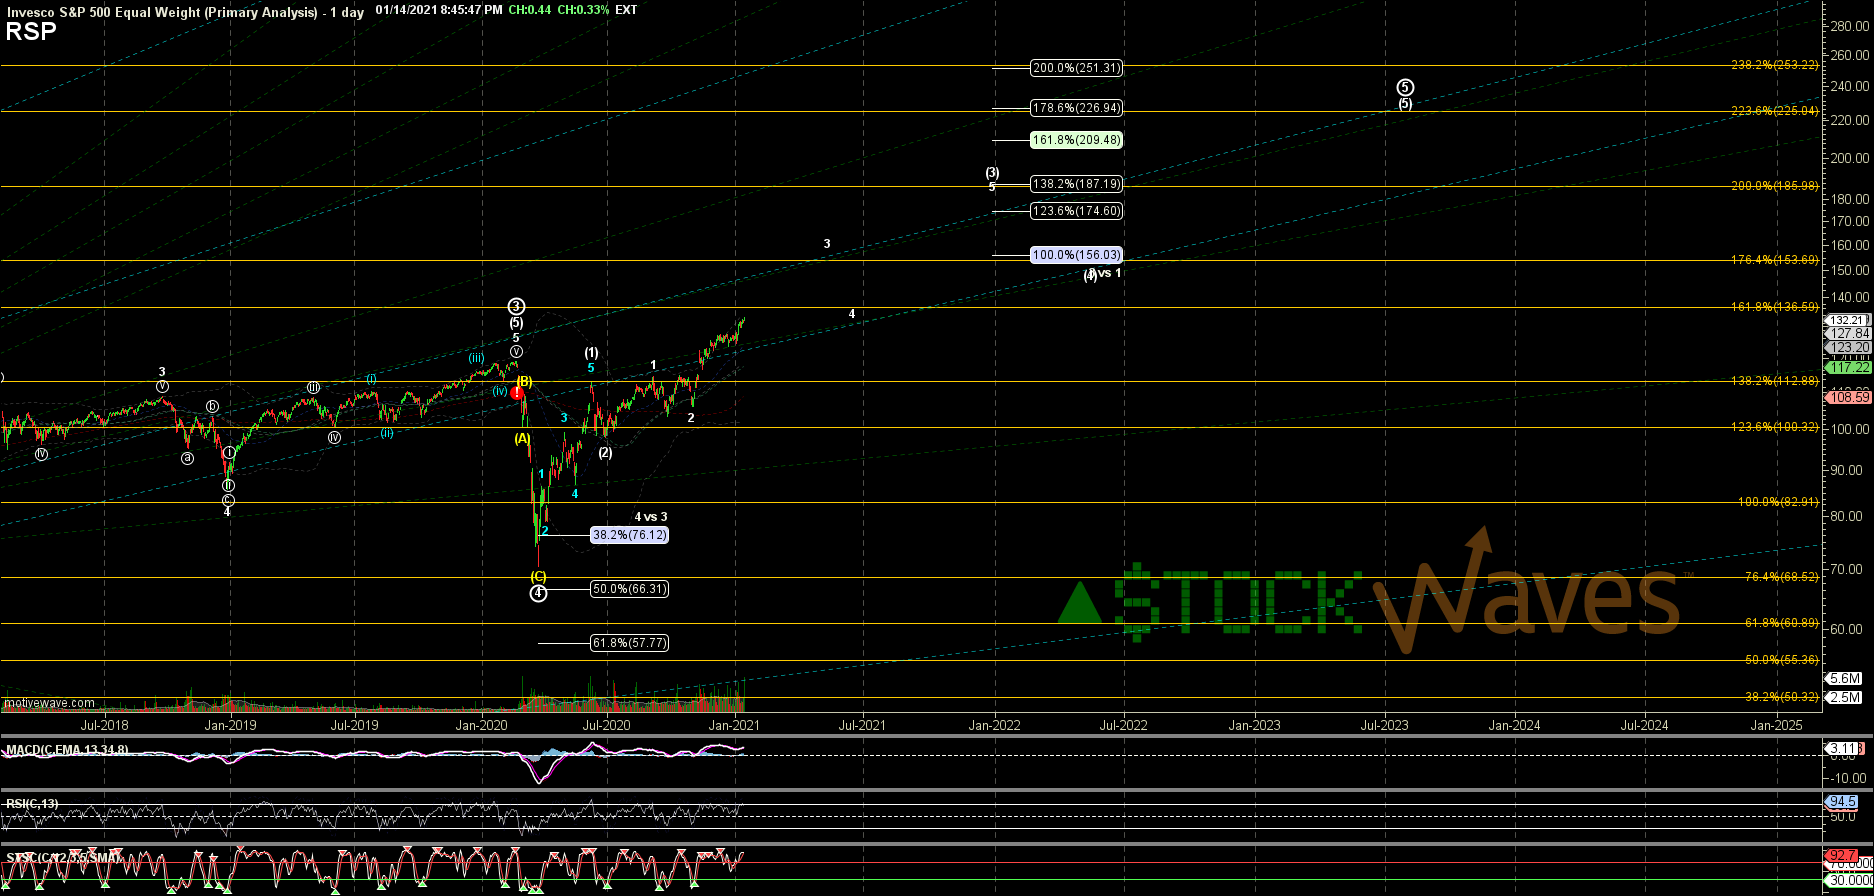
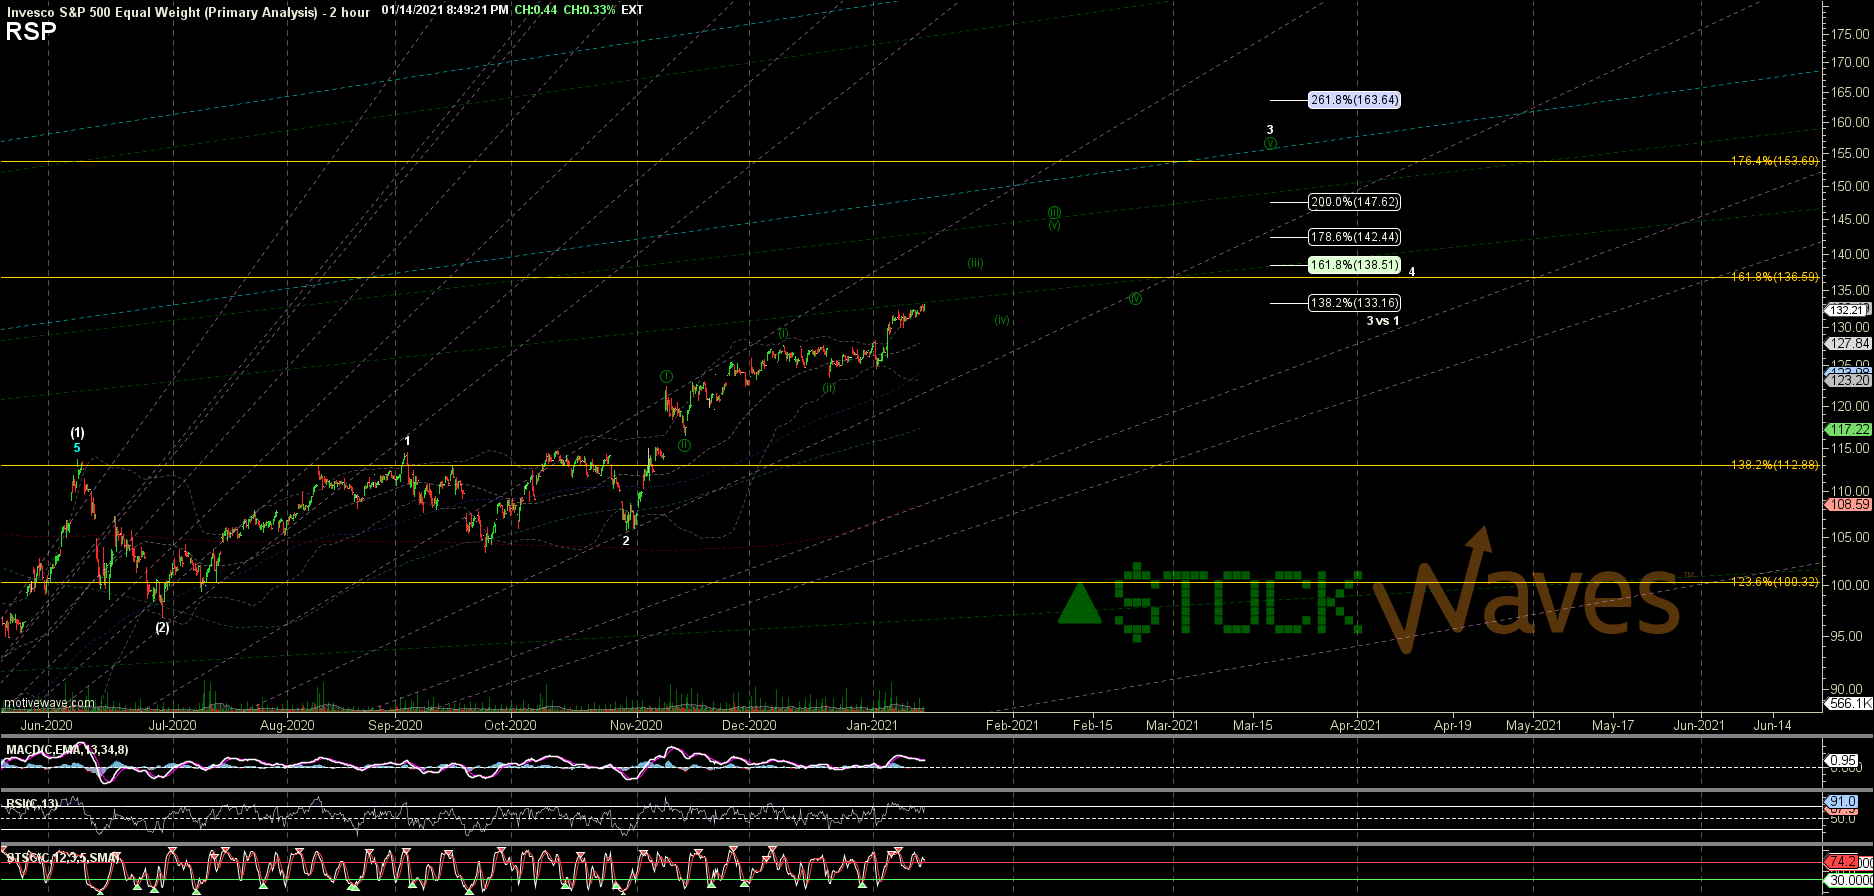
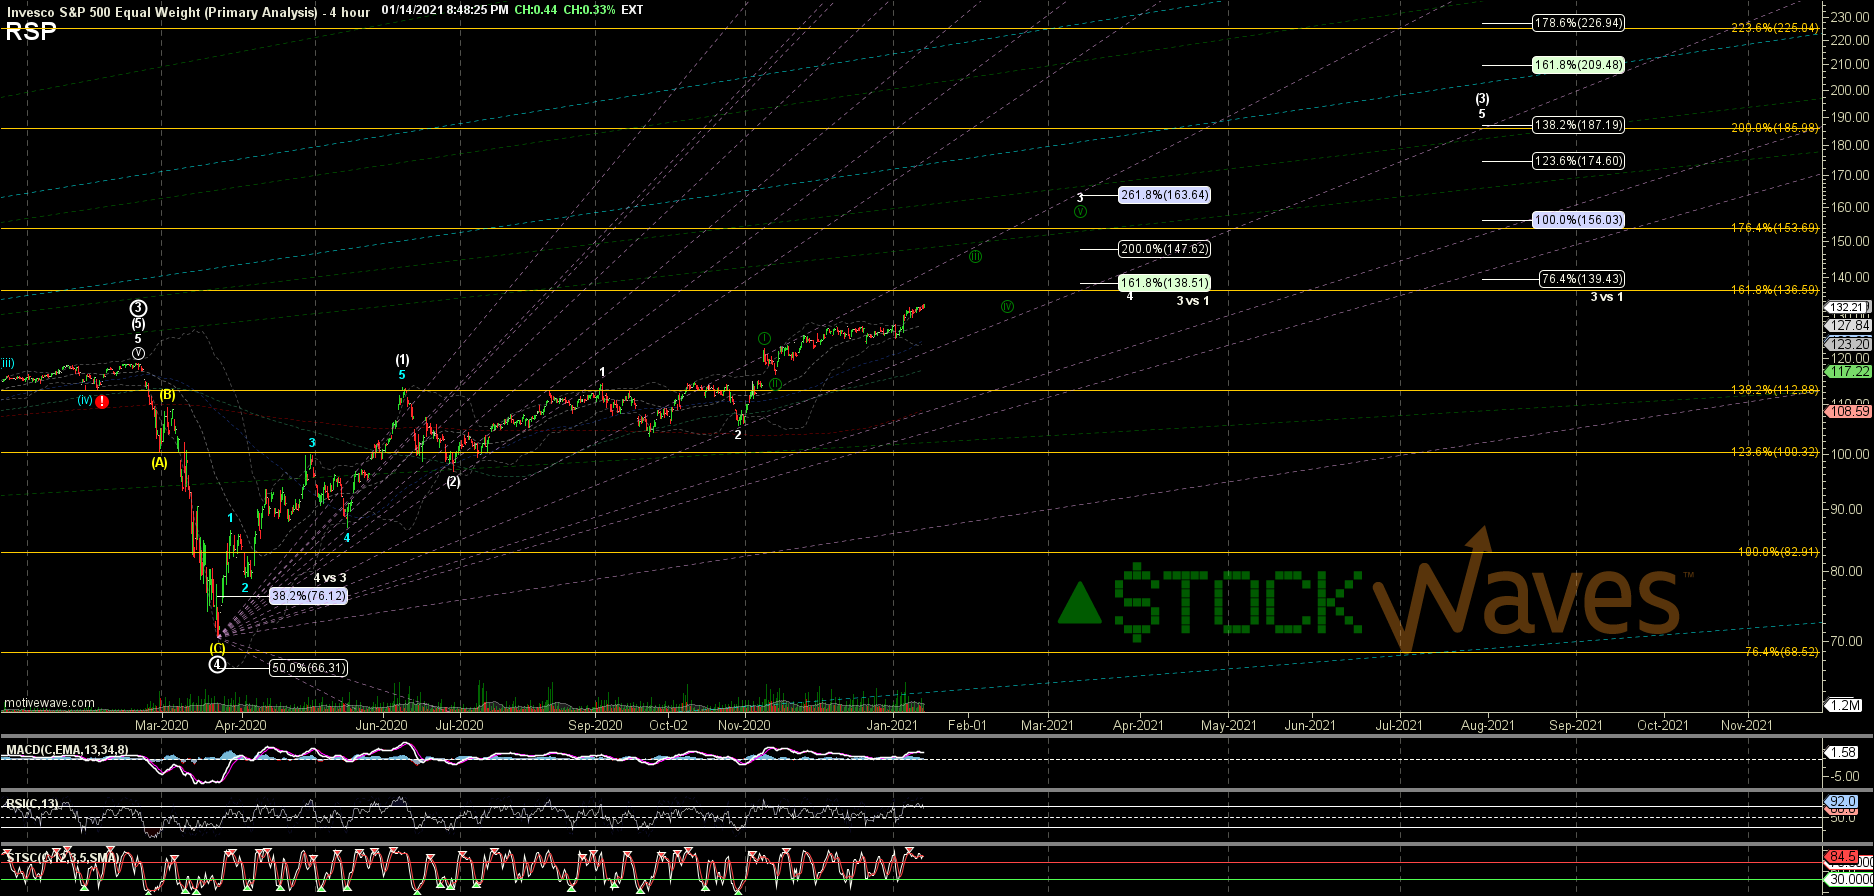
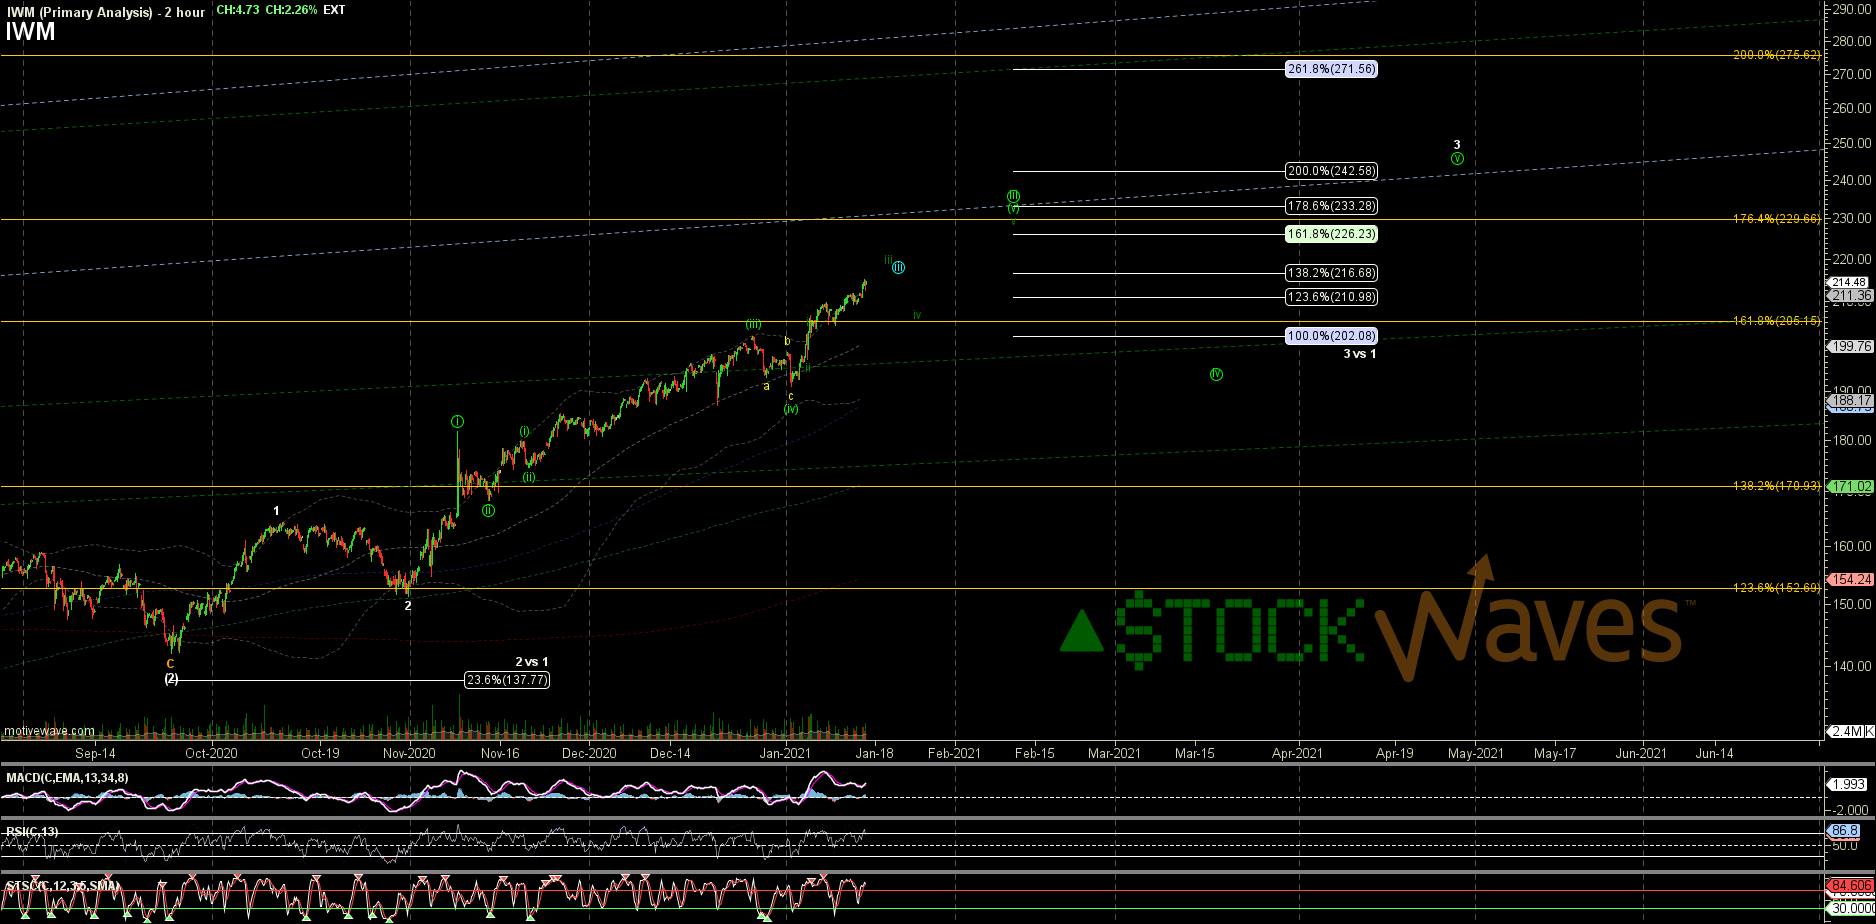
4) Charts like the IWM and RSP that are not as heavily weighted toward a select group of names continue to show a much clearer version of the pattern we are filling out*.
The RSP looks like all of our best StockWaves charts, the only reason it is more muted than some of our moves is b/c of lot of stuff we have still in just 1 of (3) and I think they must rebalance ~monthly. It is the more clearly pronounce (1)-(2) into June and the 1-2 of (3) into the Oct low that gave us the confidence to apply that count to the SPX. In that count 156 is the 100% extension of the (3) inside P.3 and based on FibPinBall is the standard target for wave 3. Inside our 3 we again have a cleaner and more reliable i-ii-(i)-(ii) than SPX (shown in green). We should be nearing the top of the iii of (iii) inside circle iii but even that could stretch higher before any consolidation that should now hold the 130 region. If we add Fibs to the circle iii the 100% is at 134.91, so at least the iii or (iii) inside should tag that. Then there is nice confluence at 142.70 for the 138.2%.
*SPX could play catch up, we certainly see other charts that allow for new breakouts. I have not looked closely to see how much of the S&P our energy names make up... that could be the fuel it needs to catchup to IWM. But it is also possible that the SPX is in roughly the same spot as RSP but b/c of the dead weight from some of the LongTooths it is a more squashed version. Either way I think the view is distorted and the root problem is being overweight.