The Next Few Months Will Tell The Story For Next Few Years
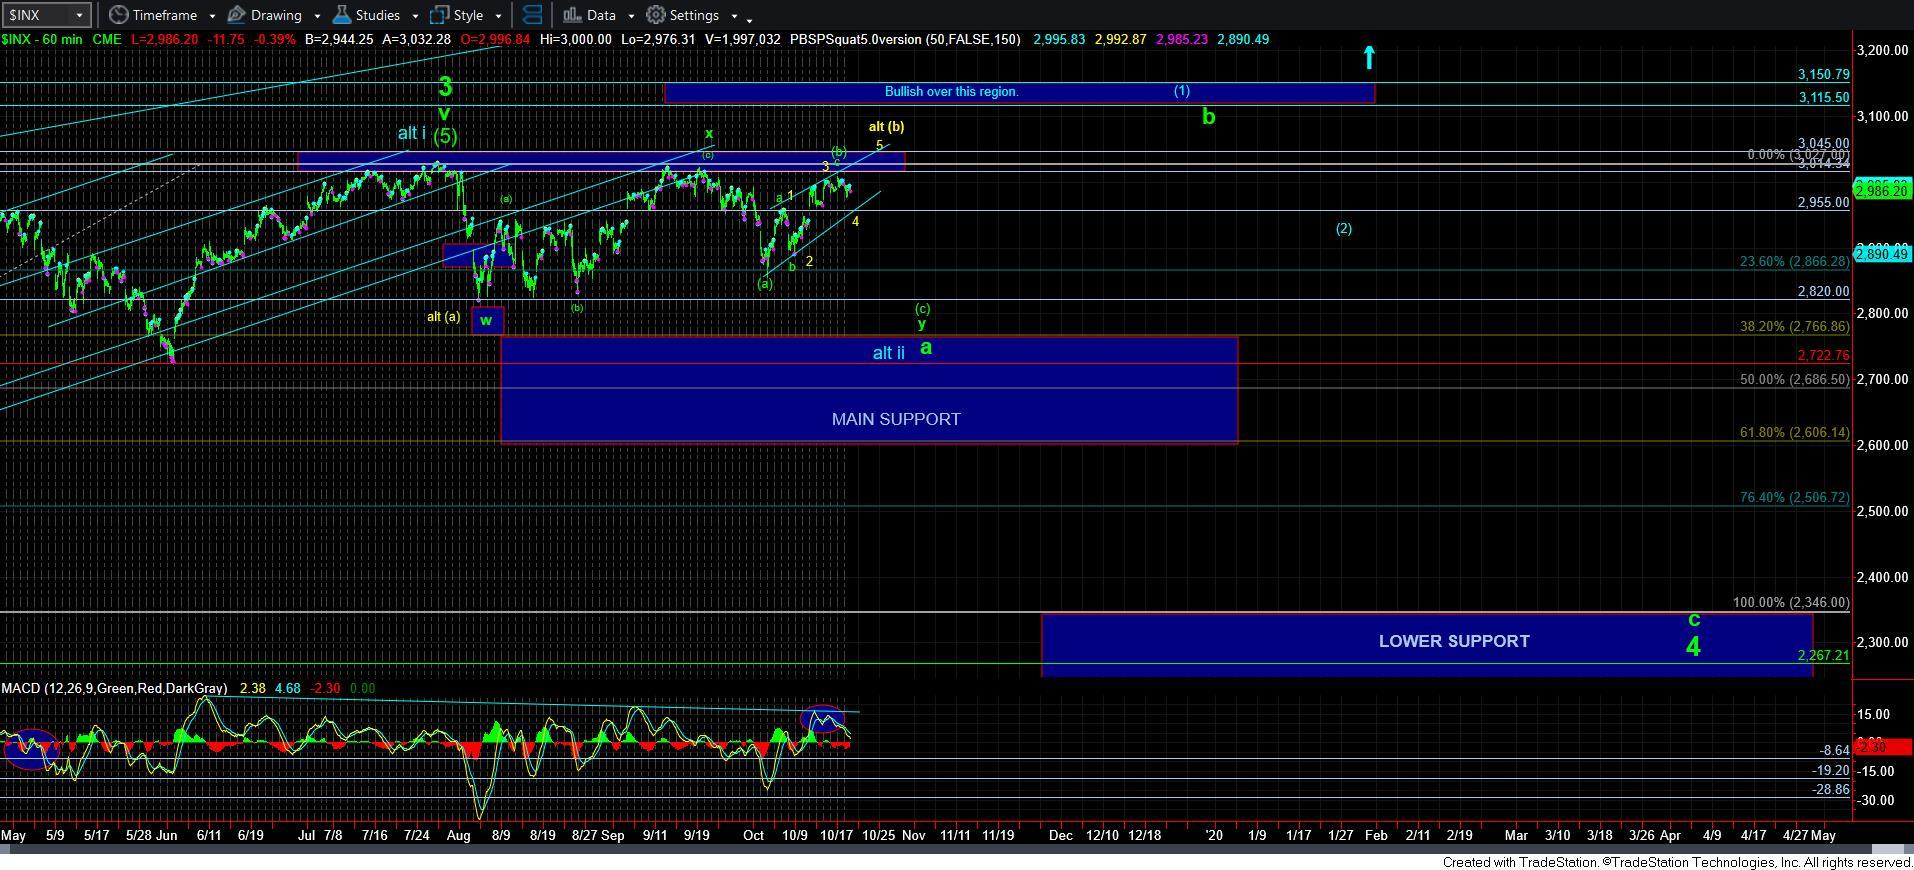
With the market holding support early in the prior week, it continued higher to subdivide within this 5-wave c-wave we are primarily tracking, which should complete a [b] wave rally. Ultimately, when this [b] wave completes, I still maintain an expectation for the market to drop back down to at least the 2820SPX region, and potentially even lower.
In the short term, until we see a sustained break down below 2955, we have no indications that this [b] wave has completed, and it could very well push higher one more time over the coming week or two before it completes. But, once we do have a completed [b] wave, then that is when I expect that [c] wave decline to at least the 2820SPX region.
The question is what happens after we see that drop?
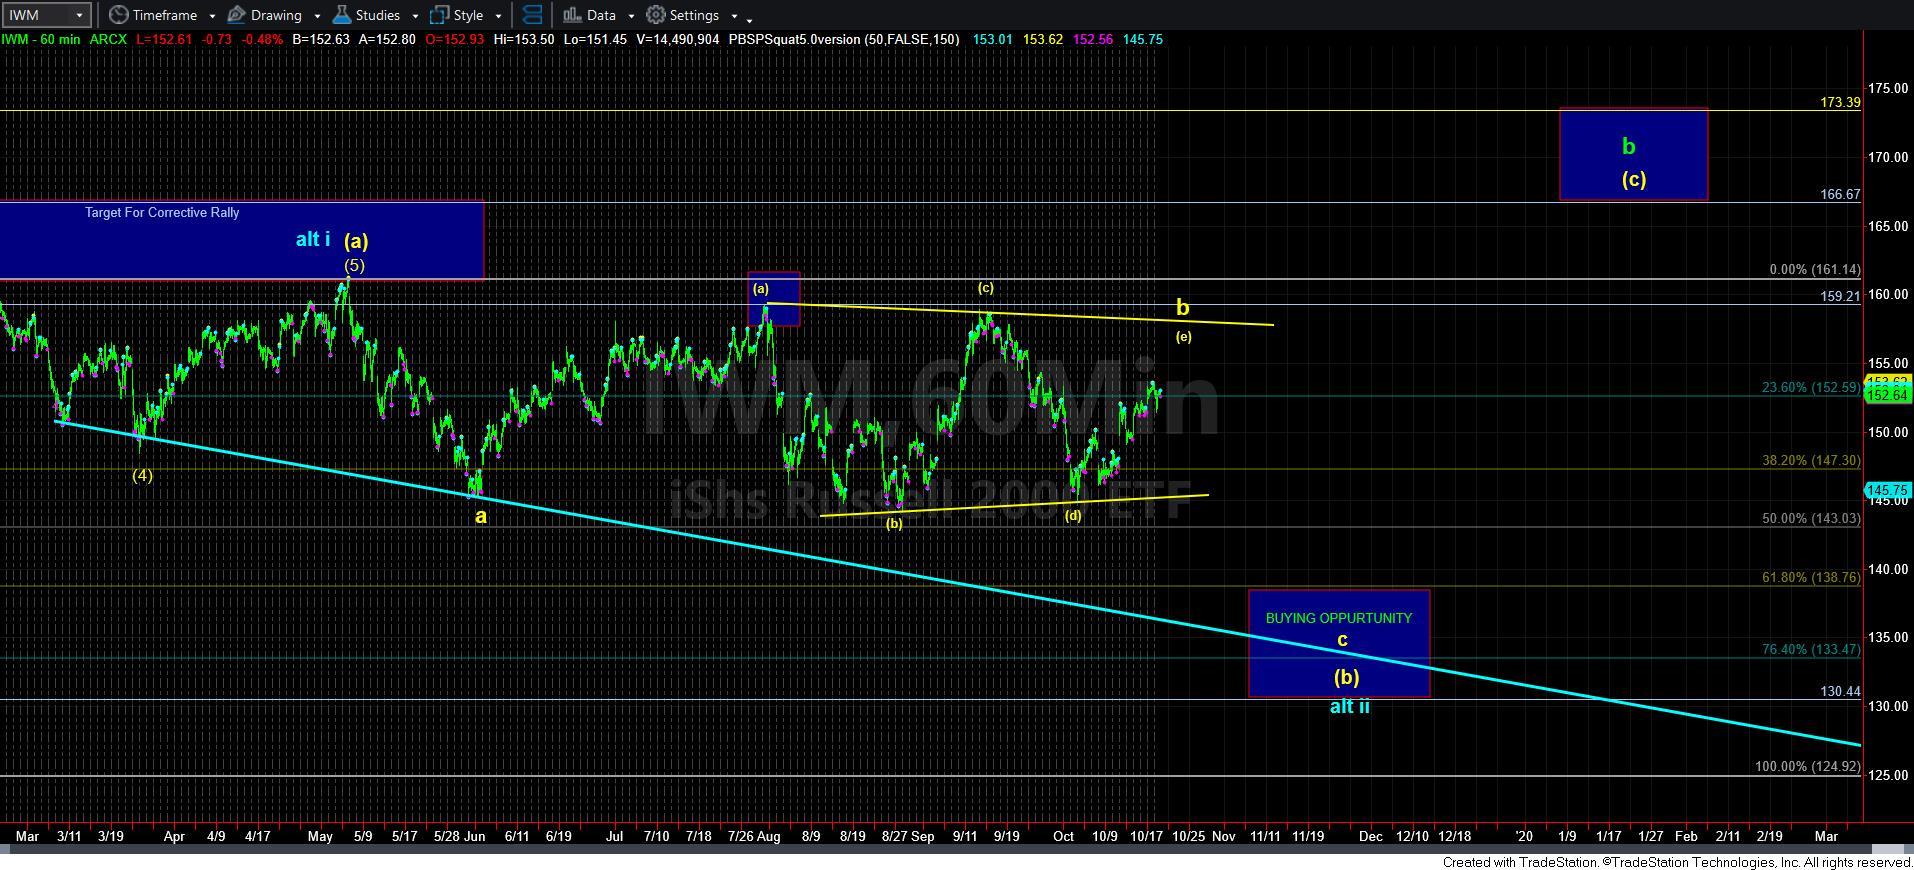
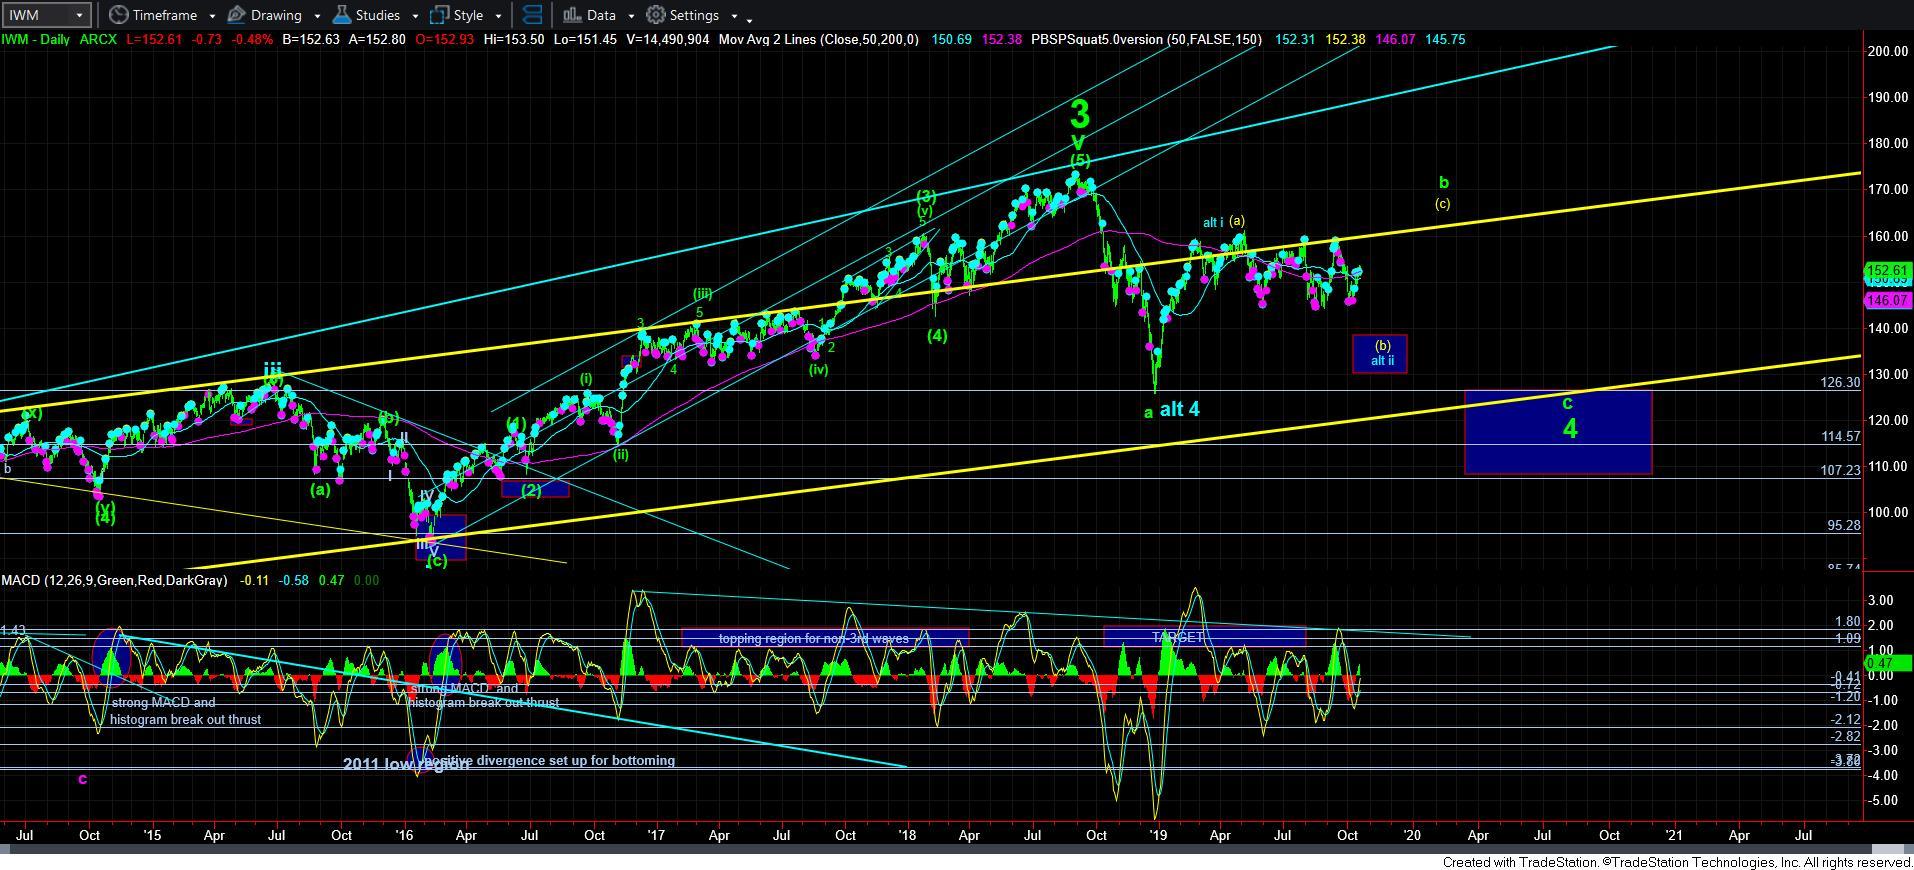
Well, this past week, I went back and spent more time analyzing the IWM chart. You see, the IWM began this 4th wave off the 2009 lows before the SPX did. That means that if my analysis is correct, the IWM has now spent over one year within its wave 4. Yet, the SPX has only begun the same degree 4th wave three months ago.
Allow me to further explain why this matters. There are two ways a correction can complete. The first is through time, as it moves sideways over a relatively long period of time (such as within a triangle). The second is by hitting a retracement target. Most often, when we drop to a retracement target, the 4th wave completes with a crash-like c-wave decline, which resets sentiment negative enough to support a major rally in a 5th wave.
In our case, while it is still possible for the SPX to take all of the next year (2020) before it completes its 4th wave, I have decided to adjust my primary count on the SPX to align with what I think I am seeing in the IWM simply due to the amount of time the IWM has spent in this 4th wave structure.
In the IWM, I am viewing the current back and forth whipsaw movements over the last few months as being a b-wave triangle within a [b] wave of the b-wave of the 4th wave. While that sounds quite complex (and it really is), you will need to look at the attached 60-minute IWM chart to understand this a bit better, and then zoom out to the attached daily chart to place it in context.
That means that I am viewing the next decline in the SPX as completing ALL of the a-wave in this larger 4th wave off the 2009 lows, whereas the IWM would then only complete the [b] of b-wave. This drop would then be followed by both of those charts rallying to complete a larger degree b-wave rally in this 4th wave structure. This is where both charts would potentially align to completing their respective b-waves in this larger degree 4th wave. And, after that b-wave rally completes, it would set both charts up for a very strong c-wave down within the first half of 2020. This would put both charts back into alignment.
But, I want to highlight again that once the next drop completes the [c] wave we are expecting in the SPX, which would likely be a corresponding c-wave of a [b] wave in the IWM, both charts would likely be set up for another multi-month rally.
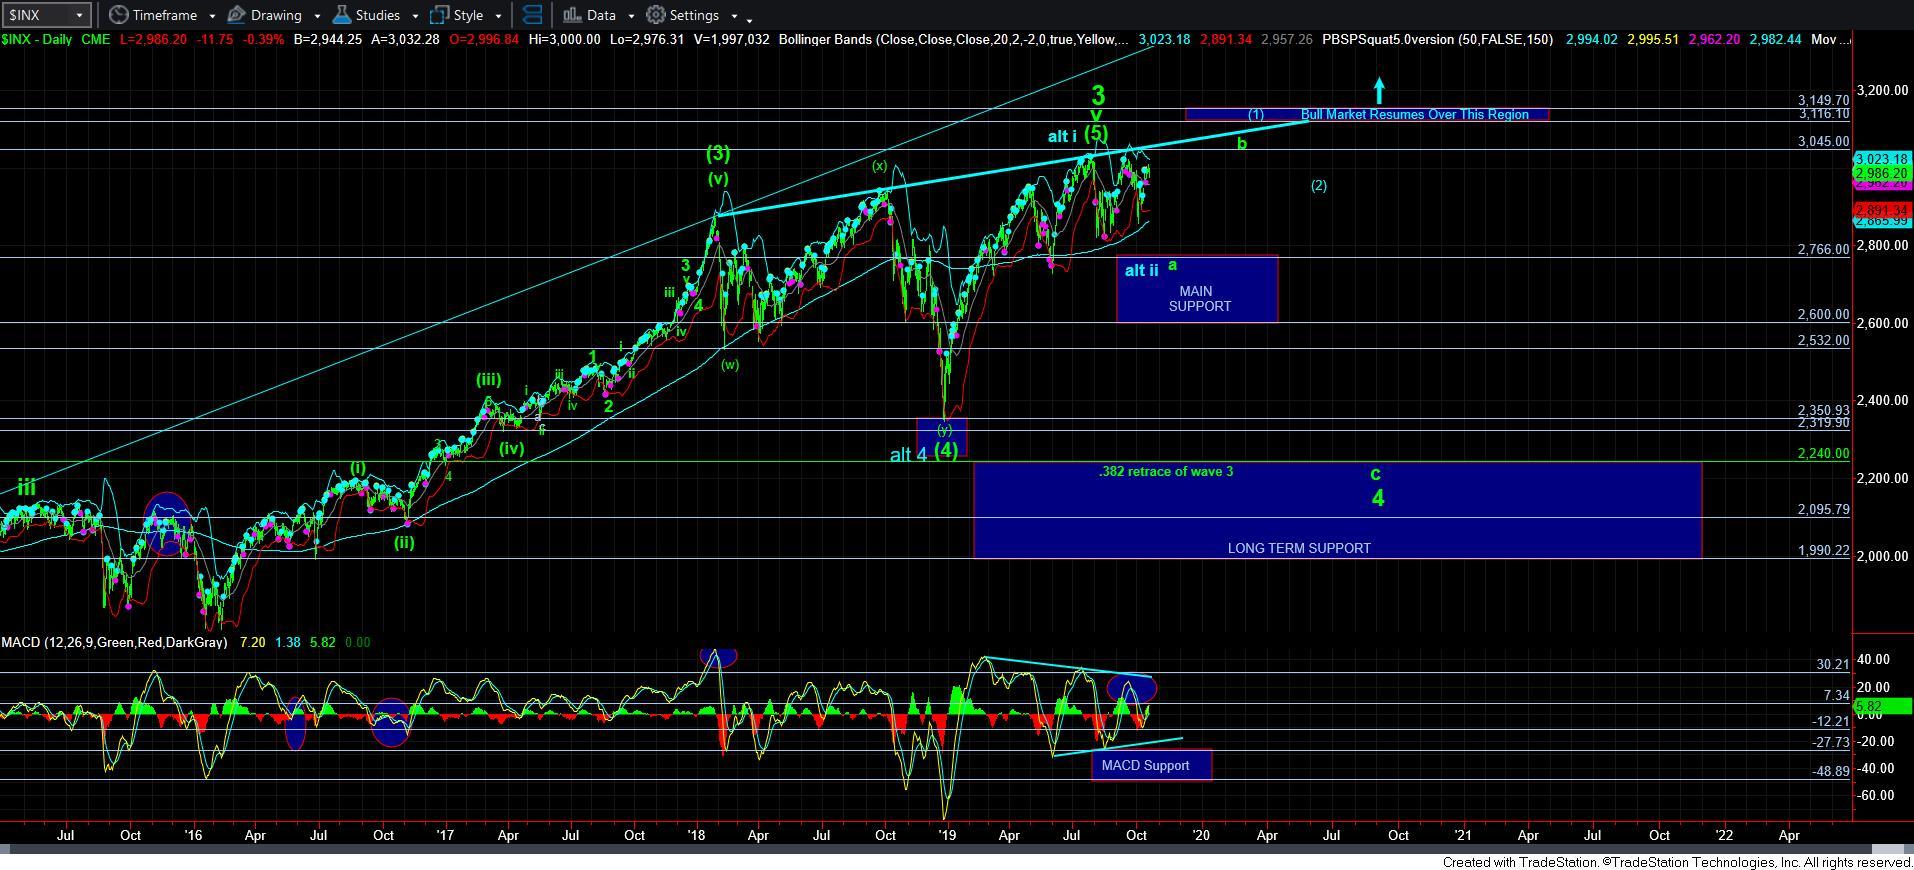
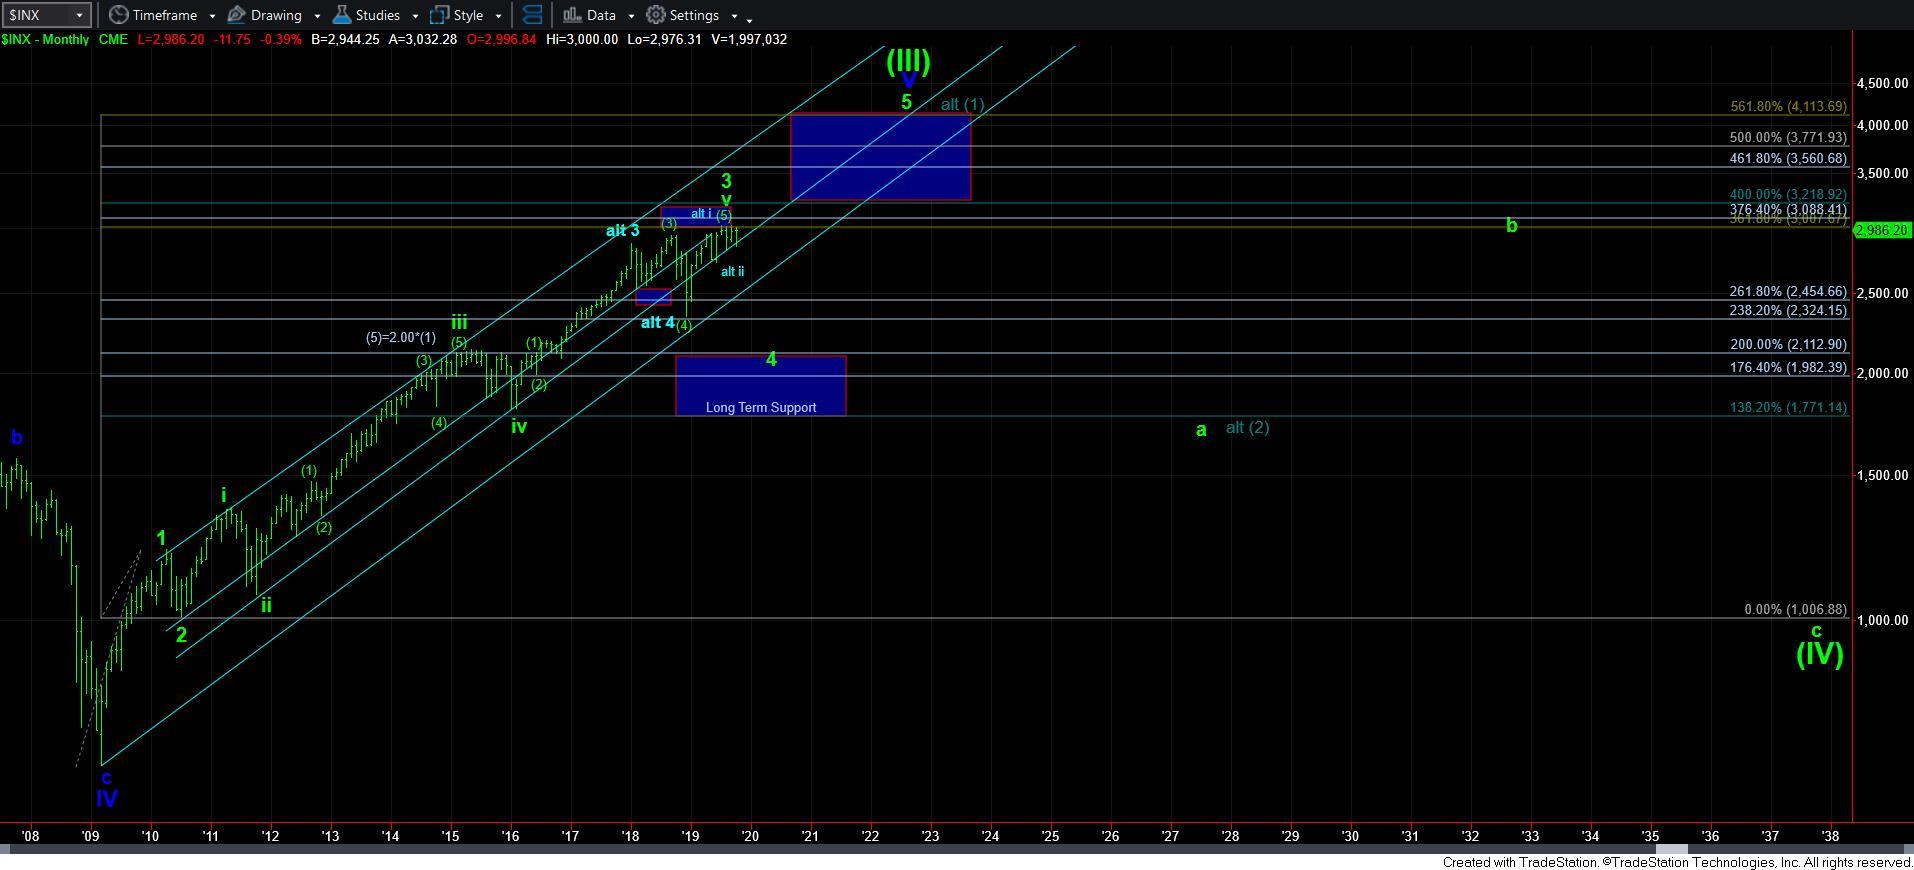
Now, alternatively, if wave 4 has completed in both charts, and the rally seen in the earlier part of the year was actually wave i of 5 (as presented in blue), then that makes the next drop an even more compelling buying opportunity. So, in both instances, I believe the next drop will provide us with a buying opportunity for what should be at least a multi-month rally, with the alternative expectation that it could morph into a multi-year rally.
At this point in time, I still want to note that I am seeing nothing in the underlying market which would suggest that the blue count is the more likely scenario at this time. Rather, I still maintain the green count as my primary expectation in the SPX, which means I only expect the next larger degree rally to be a multi-month b-wave rally.
However, please also note that even the b-wave rally can provide us with a new all-time high in the SPX, and I think the potential is quite high that we see that type of b-wave. In fact, a new all-time high seen off the next pullback will likely foster extreme bullishness, which is needed for the type of c-wave decline I still expect to see in 2020.
And, if the market rallies off the next [c] wave decline low in an impulsive structure and fills in the blue waves [1] and [2] as seen on the 60-minute chart, and then rallies back over the high of wave [1], I will fully adopt the blue count as pointing us towards the 4000 region sooner rather than later. But, again, that is not my expectation at this point in time based upon all the reasons I have provided over the last several months.
While I know this update may seem quite complex, especially to those of you that are newer to Elliott Wave analysis, allow me to try to summarize my perspective.
The main point I want to make with this update is that I still expect another decline to be seen over the coming month or so (depending upon when this current [b] wave rally completes), which would nicely align the IWM and SPX structures. And, both structures would suggest that this next [c] wave decline would likely be a buying opportunity. But, I think the IWM has potential to outperform the SPX in that next rally.
As I have outlined many, many times over the last several months, we are dealing with corrective market action. And, as such, it is quite variable in nature, and has provided us with the back and forth whipsaw action we have seen for months. This is what I warned about many months ago when we topped out in July. But, eventually this structure begins to take a shape which clarifies the larger degree wave count and expectation.
In The Elliott Wave Principle, there is a paragraph by Frost & Prechter which I believe is extremely applicable to us today:
“Of course, there are often times when, despite a rigorous analysis, there is no clearly preferred interpretation. At such times, you must wait until the count resolves itself. When after a while the apparent jumble gets into a clearer picture, the probability that a turning point is at hand can suddenly and excitingly rise to nearly 100%.”
I believe the next 30 days will likely begin to either confirm or invalidate my expectations as presented above, and within the first quarter of 2020 we will likely have a very good idea as to how the market is setting up for the next 3-4 years.
And, should we see this next [c] wave to the downside in the near term, most patterns point to it being a buying opportunity for at least a multi-month rally. As that multi-month rally develops, we will likely learn more about whether our primary expectation for a much deeper decline in 2020 will take shape, or if the market will begin the run to 4000 sooner than expected. For now, I am still of the belief that we will set up a major decline in 2020 before we are ready for that rally to 4000.