
The Level Was There Before The Policy — 10 Year Yields (TNX)
 By
Levi
By
Levi
The Level Was There Before The Policy — 10 Year Yields (TNX)
Last Wednesday, August 19, the Treasury announced it would at least double the size of its long-end buybacks. $2 billion becomes $4 billion, maybe more, targeting the older paper out on the curve where nobody has wanted to be a buyer since June. The 30-year had just printed its highest yield since 2007. So the timing wasn’t subtle.
Then on Monday, August 24, came the part that got everyone’s attention. Two senior officials told CNBC that the Treasury General Account — the government’s checking account at the Federal Reserve, sitting at roughly $935 billion, nearly double what the prior administration kept there — could be used to fund those purchases. That’s real firepower. Whatever you think of the idea, it isn’t nothing.
And I’ll admit, I spent a decent amount of time reading about it. The mechanics are genuinely interesting. True, they likely can only use around $200 billion give or take of that money without running into other more pertinent issues. But this is an apparently novel approach in recent years. Druckenmiller wrote an op-ed calling it price management. Others called it rearrangement of the maturity schedule rather than a pay down. There were some other less than flattering descriptions that we will omit from this piece. However, there are smart people on both sides of whether this works.
Here’s what stopped me.
Yields on the 10-year fell about nine basis points on the announcement. By the next session, they were back. Not partially back — back. The most significant thing the Treasury has said about the long end in two years moved price for a day and then the market went right on doing what it had been doing.
Regarding human crowd behavior, Garrett Patten has described this as a chain of ants headed to a certain destination and someone drops a stick across their path. There might be a brief deviation and recalibration of the ants. But then, as a crowd, they reorganize and continue on their original path.
I want to be careful here, because it would be easy to overstate this. One day isn’t a verdict. The first operation by the Treasury isn’t until September 9, and Bessent has been clear they haven’t purchased a single bond yet. Maybe the real test comes then. Maybe it comes in November at the refunding. I don’t know, and I’m not going to pretend that the story ends here.
But something else was sitting on the 10-year chart while all of this was happening, and I keep coming back to it.
The 4.75% level had been identified as standout resistance for several weeks now — it’s been on my chart this entire time. Not since last Wednesday. Not after the CNBC piece. Weeks. It’s been tested three times, and it has held three times — and the third of those attempts happened to land in the middle of the largest verbal intervention in the long end we’ve seen in this cycle.
That’s the part I find remarkable. It’s not so much that the level was right, because a level holding three times isn’t a prediction and many times resistance is conquered. It’s that the level was drawn before there was any policy to react to. The market had already marked its own line. Then Washington showed up with a $935 billion account and an announcement, and price went and did what it was going to do at the same number it had been respecting all along.
I don’t have an opinion in this piece about whether the buybacks are wise, or what they’re really attempting. That’s not my lane and it isn’t where I think the actionable information is.
The utility of information is on the chart itself and it has been there the whole time.
Please allow me to share with you what it is telling us here.
Sentiment Speaks
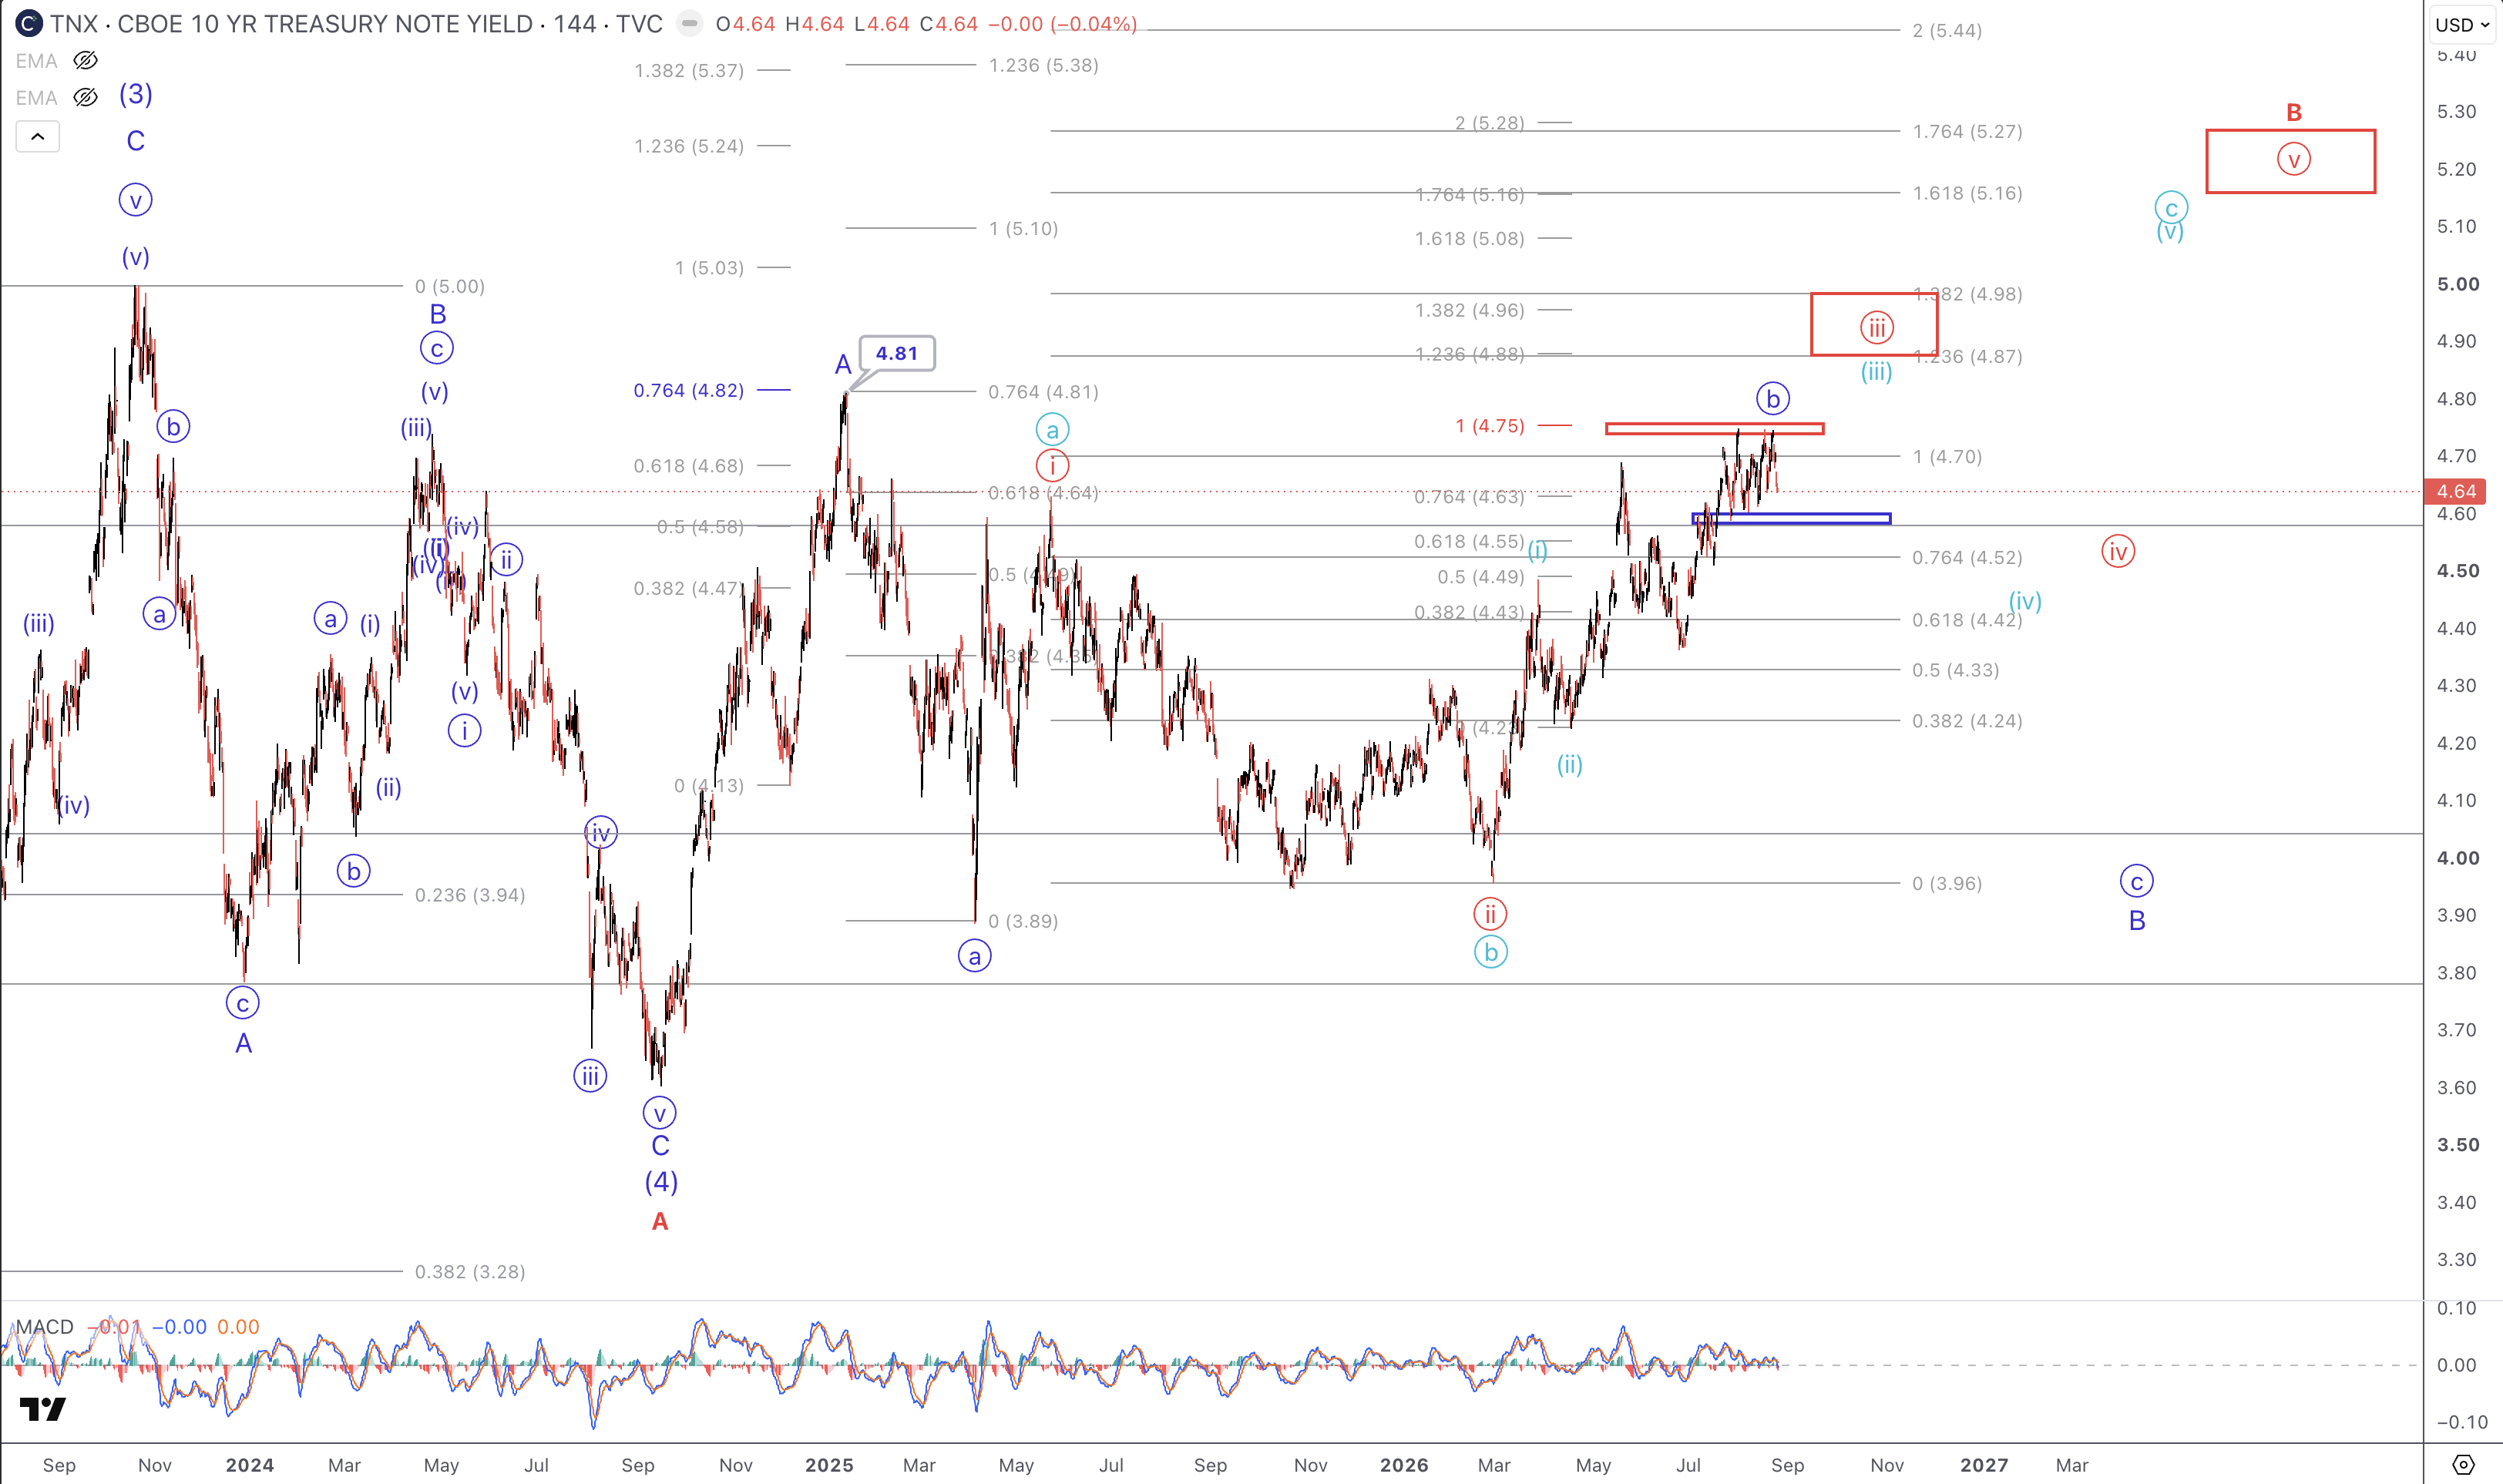
That 4.75% area has made itself known as significant. Will it end up being the near-term peak for yields? That question will be answered by what they do next. There is a path lower via the primary scenario shown here. What might that look like over the next several weeks?
Currently there is support at the 4.59% area and then 4.43%. Should yields form an initial 5 waves down from the 4.75% swing high, then that would better confirm the circle ‘c’ of B lower. And it would point us to the likely target to the downside. For now, the blue path projects to perhaps 4.05%.
We must consider the alternative paths as well. Should yields instead overtake the key resistance zone at 4.75% then it becomes much more probable that they are on their way to the next Fibonacci extension areas overhead: 4.87%-4.98% and even as high as 5.16%.
Conclusion
Nothing on the charts requires us to be right about Washington. That’s the point we can circle back to.
If yields do form 5 waves down from here and the circle ‘c’ of B plays out, the buybacks will get the credit. If 4.75% gives way and we’re chasing 4.87% and higher, the buybacks will be blamed for failing. Either way, the story written afterward will be about the policy — and either way, the level was on the chart before the policy existed.
So watch two things over the next few weeks. First, whether an initial impulse down develops from resistance, because that’s what turns a level holding into a structure confirming. Second, 4.75% itself. If resistance does get taken out, then it becomes a level that has been conquered and the alternate paths become primary.
But the ants keep walking. Yes, someone dropped a fairly large stick across the path this week, and the crowd took a session to reorganize and then went right back to where it was headed.
I’ll be watching the news since it’s interesting, but I won’t be waiting on it to tell me where the 10-year is going.
