The Conundrum Of The US DOLLAR
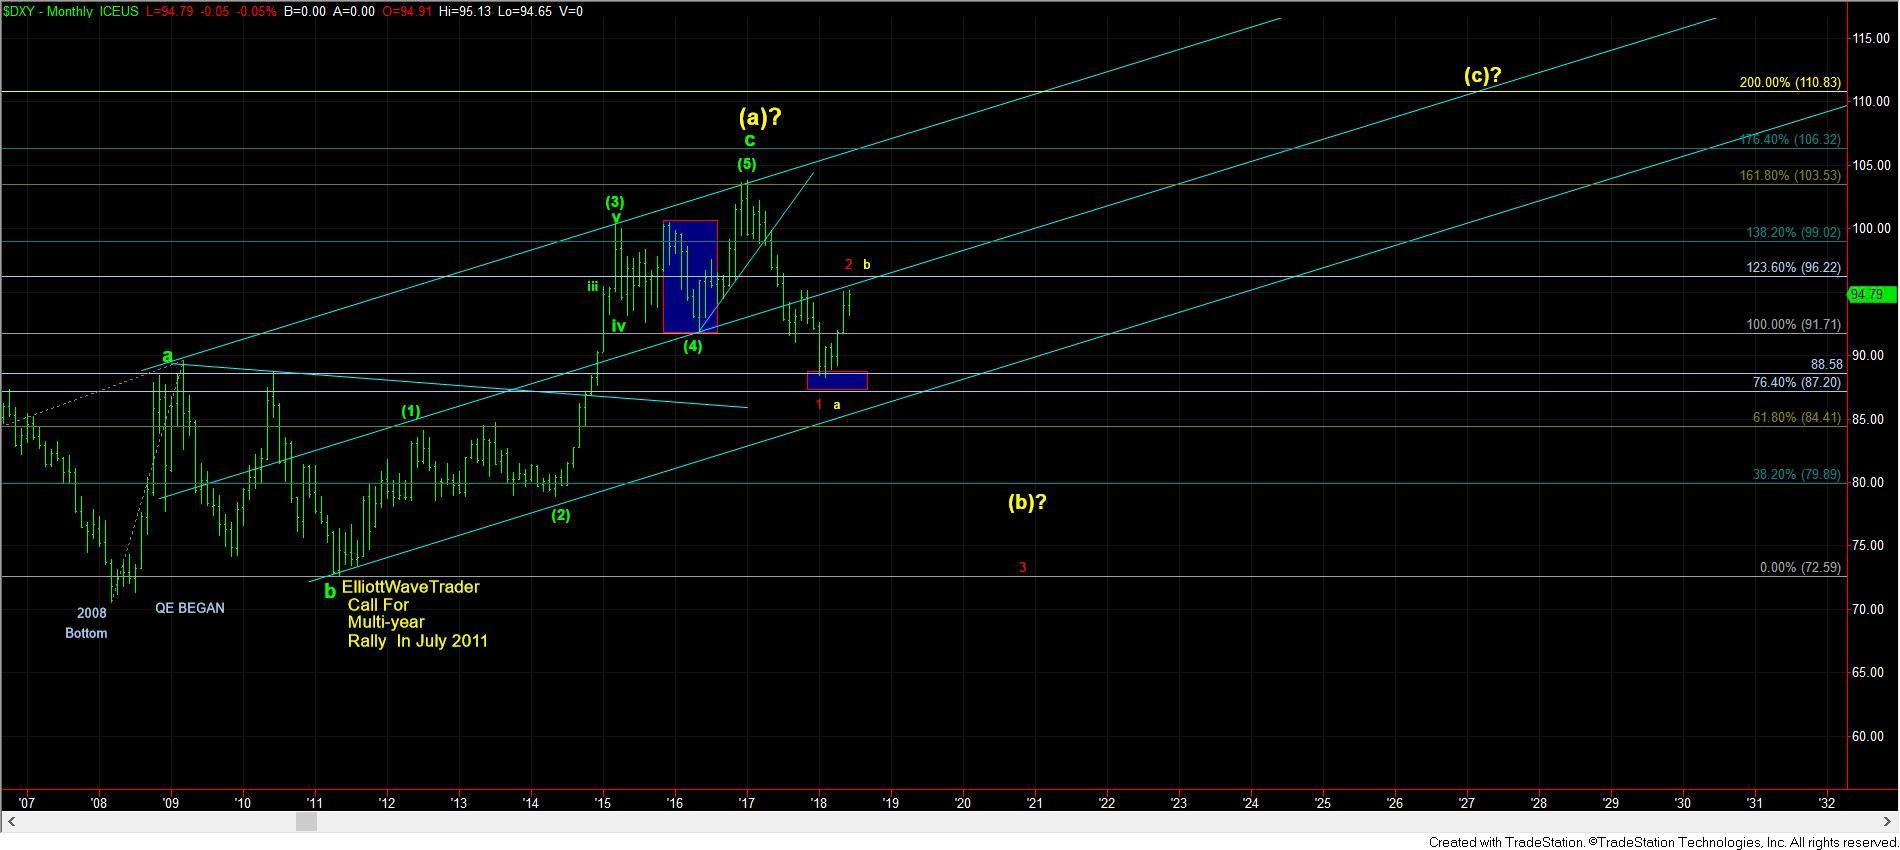
I am going to do a larger degree overview of the DXY, since I have not done one in while, and I have been getting a number of questions about it of late. So, if you are following along, please take a look at the attached monthly chart, as I go through the progression of where I think we are in the larger degree time frames.
Back in 2011, we correctly saw the impending multi-year rally developing in the DXY, whereas most others were looking for the dollar to crash. In fact, our target was 103.53, the 1.618 extension from the 73 region, which we exceeded by 29 cents before the market turned back down. And, to put this market call into context, many of you may remember the certainty within the market that the dollar was going to crash due to all the QE thrown at it. Yet, the exact opposite occurred, which clearly surprised most of the market . . . well . . . at least those who were not reading our analysis.
Initially, I had expected the turn down in the DXY from 103.53 to be a 4th wave, which would hold support at the 91.70 region, the 1.00 extension and common target for a 4th wave. However, when we exceeded that support to the downside, we then overlapped into what I was initially counting as wave 1 off the 2008 lows (now labeled as an a-wave), which then invalidated the standard impulsive structure I was tracking since that time. This caused me to re-assess the entire structure since 2008, which has me viewing the larger structure now as a corrective rally into 103.82.
But, as we know, corrective structures are much more variable than impulsive structures. They take many unexpected twists and turns as they eventually head to their targets. In our case, I still think that target is much lower, and potentially in the 80 region next. Yet, the question is what path will the market take to get down to the 80 region next.
While there are several ways to count the micro structure on the smaller degree time frames, I think the monthly chart does suggest we are approaching not only trend line resistance, but also larger degree Fibonacci resistance. But, until we actually break down below the low struck this past week at 93.19, it is certainly possible that the DXY may attempt to extend as high as the 98/99 region before we set up for an appreciable turn down.
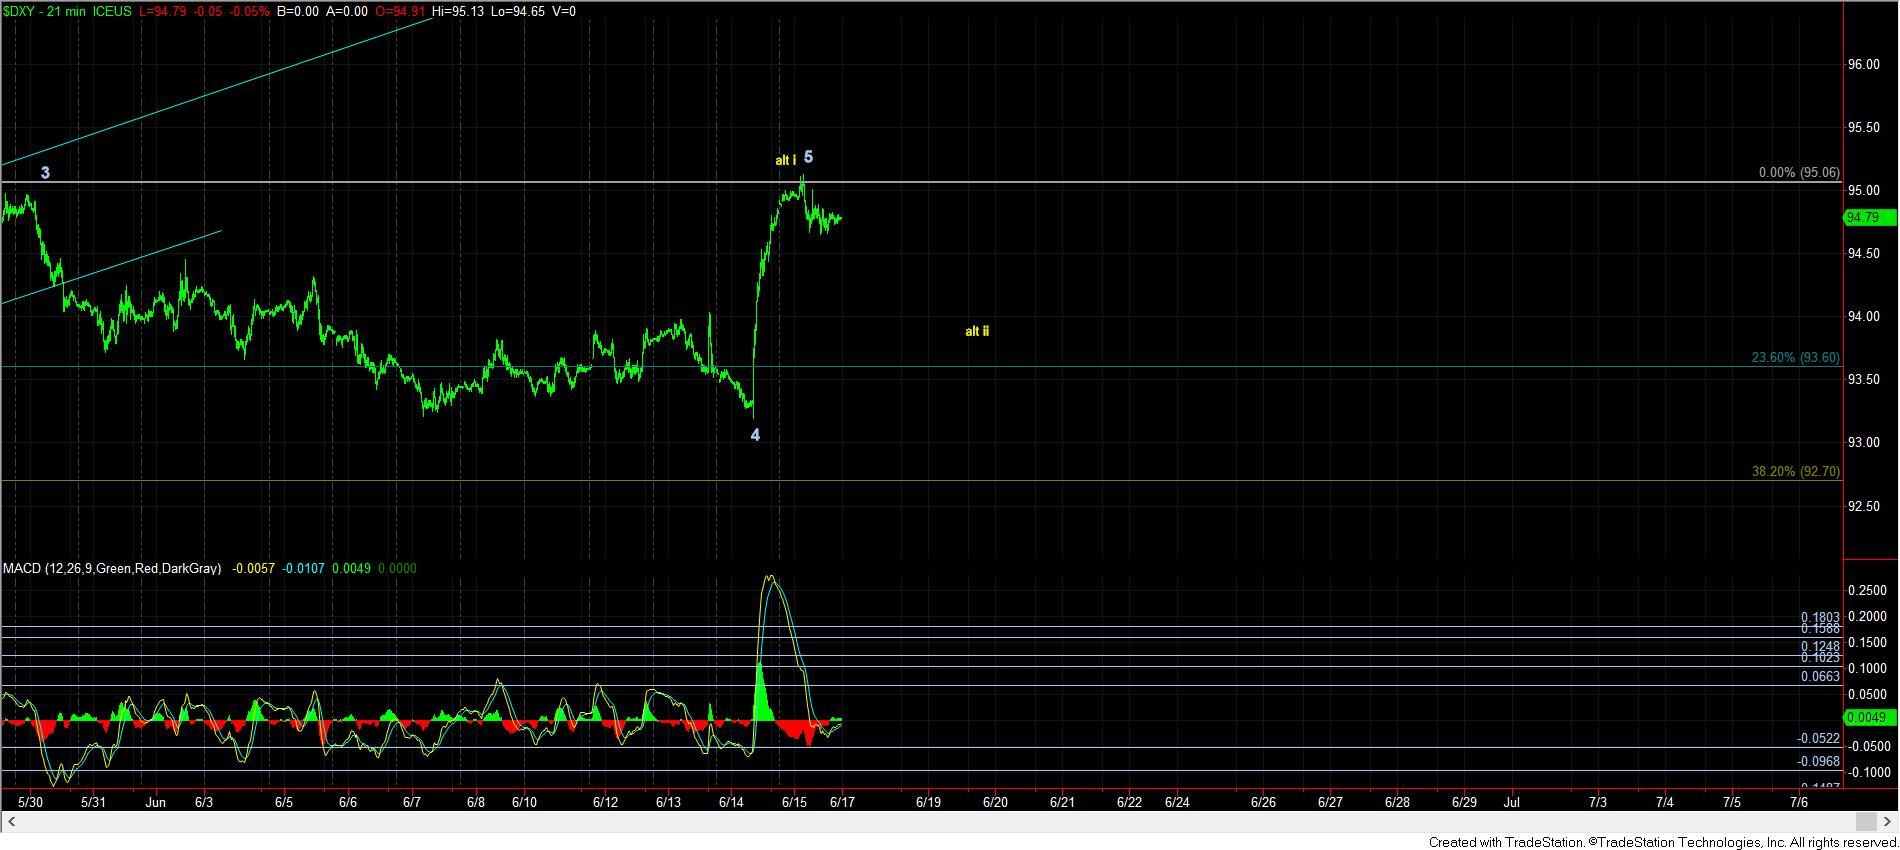
So, I will be looking for clues in the coming week as to whether we are indeed going to see an extension in this 5th wave, as presented in yellow on the 21 minute chart, or indications that the market has begun an impulsive decline to the 80 region.
Now, I know there are some that are still viewing this larger degree monthly chart as more immediately bullish. And, to do that, you would have to assume that the high we struck at 103.82 was actually the b-wave of wave (4) so that you do not have the overlap I mentioned before which would cause an invalidation of the larger degree impulsive structure. However, to do so would suggest striking Fibonacci levels for wave degrees in a manner in which I have rarely seen occur. Moreover, it would suggest proportions between the various waves which also rarely occur. While it is certainly possible and I am keeping that potential in the back of my mind should it increase in probability, I don’t think it to be highly probable at this point in time based upon historic patterns I have tracked through my experience with Fibonacci Pinball.
Lastly, I want to make one more important point about the dollar, and that is in relation to the metals market. Most believe that if you know how the dollar is going to trade, you know how the metals will trade. They assume it will be in lockstep in an inverse relationship. I see that as complete poppycock, and want to show you an example of why I feel as I do.
If you simply glimpse at the monthly chart of the DXY I have presented with this inverse relationship in mind, you would have to assume that the large rally we have seen in the metals began when the DXY topped out at 103.82 and dropped precipitously to 88.25. And, you would clearly be wrong.
Rather, I have highlighted the segment of the DXY movement wherein we experienced one of the strongest rallies the metals have ever seen. Is that really where you would expect it in relation to the DXY action? In fact, you probably cannot find a more innocuous segment of market action within which you would expect the metals to see one of its strongest rallies in many, many years. Moreover, the DXY was not even moving down the whole time when the metals were seeing their major rally.
So, I would like to reiterate a point I have made many times. You MUST analyze each chart on its own. Moreover, if your analysis methodology is unable to accurately predict the movement of a particular chart (the great majority of the time) without needing to look at another market for guidance, I suggest you find yourself another methodology. You see, correlations come and go, and unless you are able identify the point at which the seeming correlation will break, you are only setting yourself up for a potentially bad trade for which you will not likely understand the reason you took a large loss. And, more often than not, it happens at a major inflection point for markets.
Lastly, I want to remind you that, as we were coming into 2016, our analysis was pointing to an upcoming period of time wherein many old “correlations” would likely break down, as many of the charts we were following were looking for major trend changes. In fact, among our predictions for early 2016 was an expectation for a rally in commodities, metals, US equities, bonds and emerging markets all coinciding. So, not only were we able to identify the trend changes in each of the markets, we were able to even identify when the supposed “correlations” that many were following would break down. Yet, notice how no one really discussed this break down in correlations. In fact, it took a year until many in the market began to identify what we warned about a year earlier: https://www.zerohedge.com/news/2017-01-20/morgan-stanley-we-havent-seen-shift-severe-over-decade
But, can you imagine the amount of losses created in the accounts owned by those expecting those correlations to continue to hold? Not only did they not have the tools to understand what was happening, most continued to hold their losing positions because they were not able to recognize that what they were relying upon no longer worked.
I hope I made my point. Enjoy the rest of the weekend.