The Bulls Are Down 3-0
The best sports example I can come up with right now is that the bulls are down 3-0 in a four game series. And clearly, the next game is a must win for them.
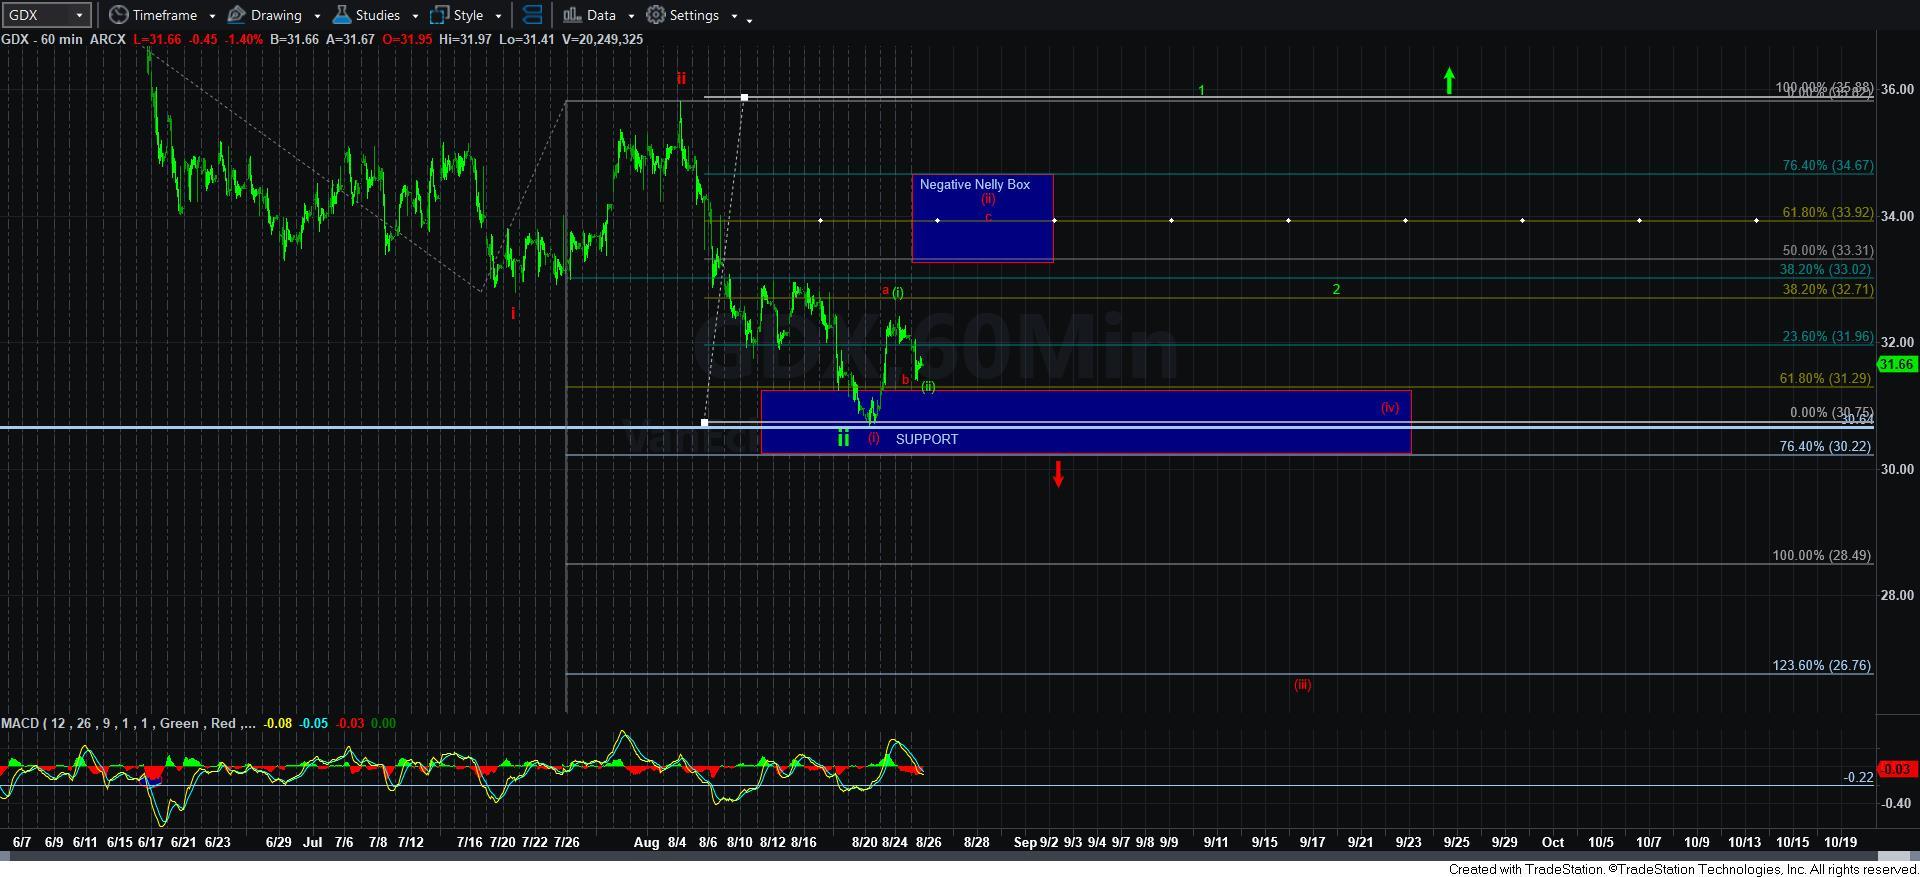
This week, we got the bounce we wanted to see, but it would only be half the ideal bounce I wanted to see. Thus far, we have only completed what I would consider an a-wave in a corrective rally, or possibly wave [i] of the next bullish move in GDX. And, yes, GDX is our clearest chart to follow through this progression right no.
That means that today’s pullback was a b-wave, or a wave [ii]. You can see this on the 60-minute GDX chart. So, it would now seem that the GDX should hold the 31.30 region, and begin another rally. If that rally fails to provide us 5 waves to take us through the top of the Negative Nelly Box, then the set up for the 21 region becomes a much higher probability. In fact, if we are indeed going to drop in earnest in the coming weeks, I would expect the 33.85 region would hold as resistance.
Of course, if the bulls can come back and win the next 4 games in a row by providing us with a 5-wave rally through the box, a 2nd wave corrective pullback, and then a rally through the high of the initial 5 waves, well, then they will provide us with one of the greatest comebacks of all time and go on to win the Stanley Cup of bullish action.
But, as history has taught us in sports, that feat is rarely accomplished.
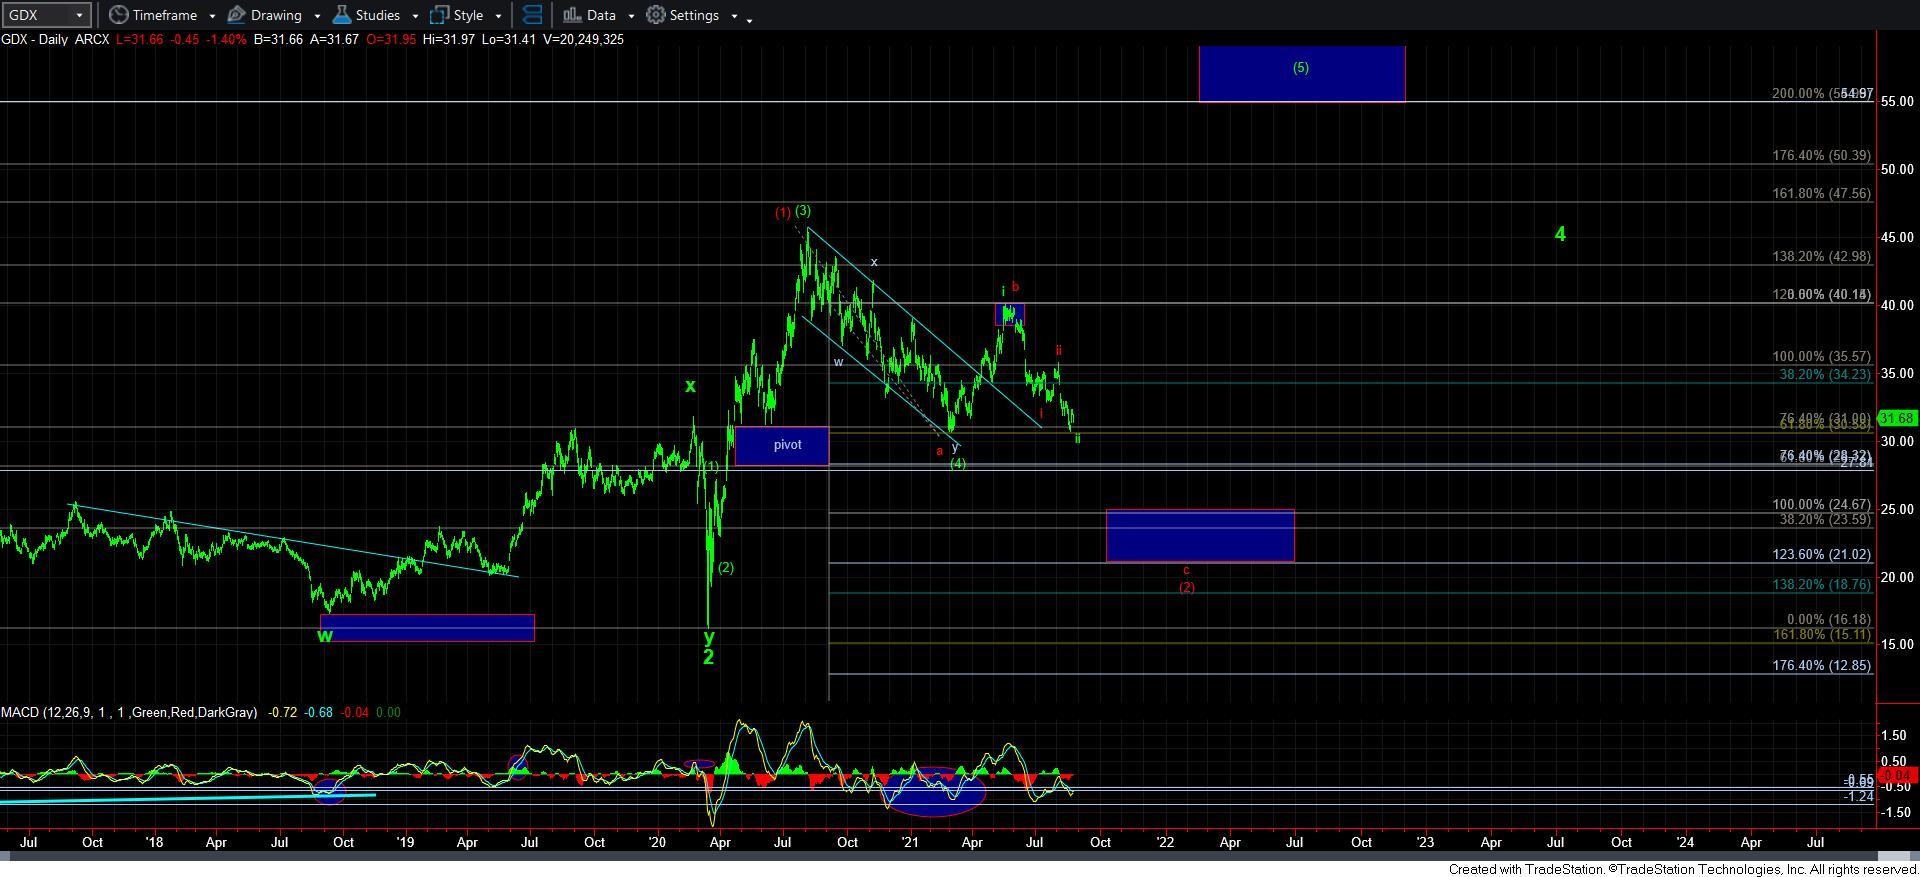
Now, clearly, if the market chooses a direct break down below last week’s low, then we clearly have an initial signal that a drop to the 21 region is likely in progress. Should that occur, I will send out another update to outline the targets for the micro-waves on the way down.
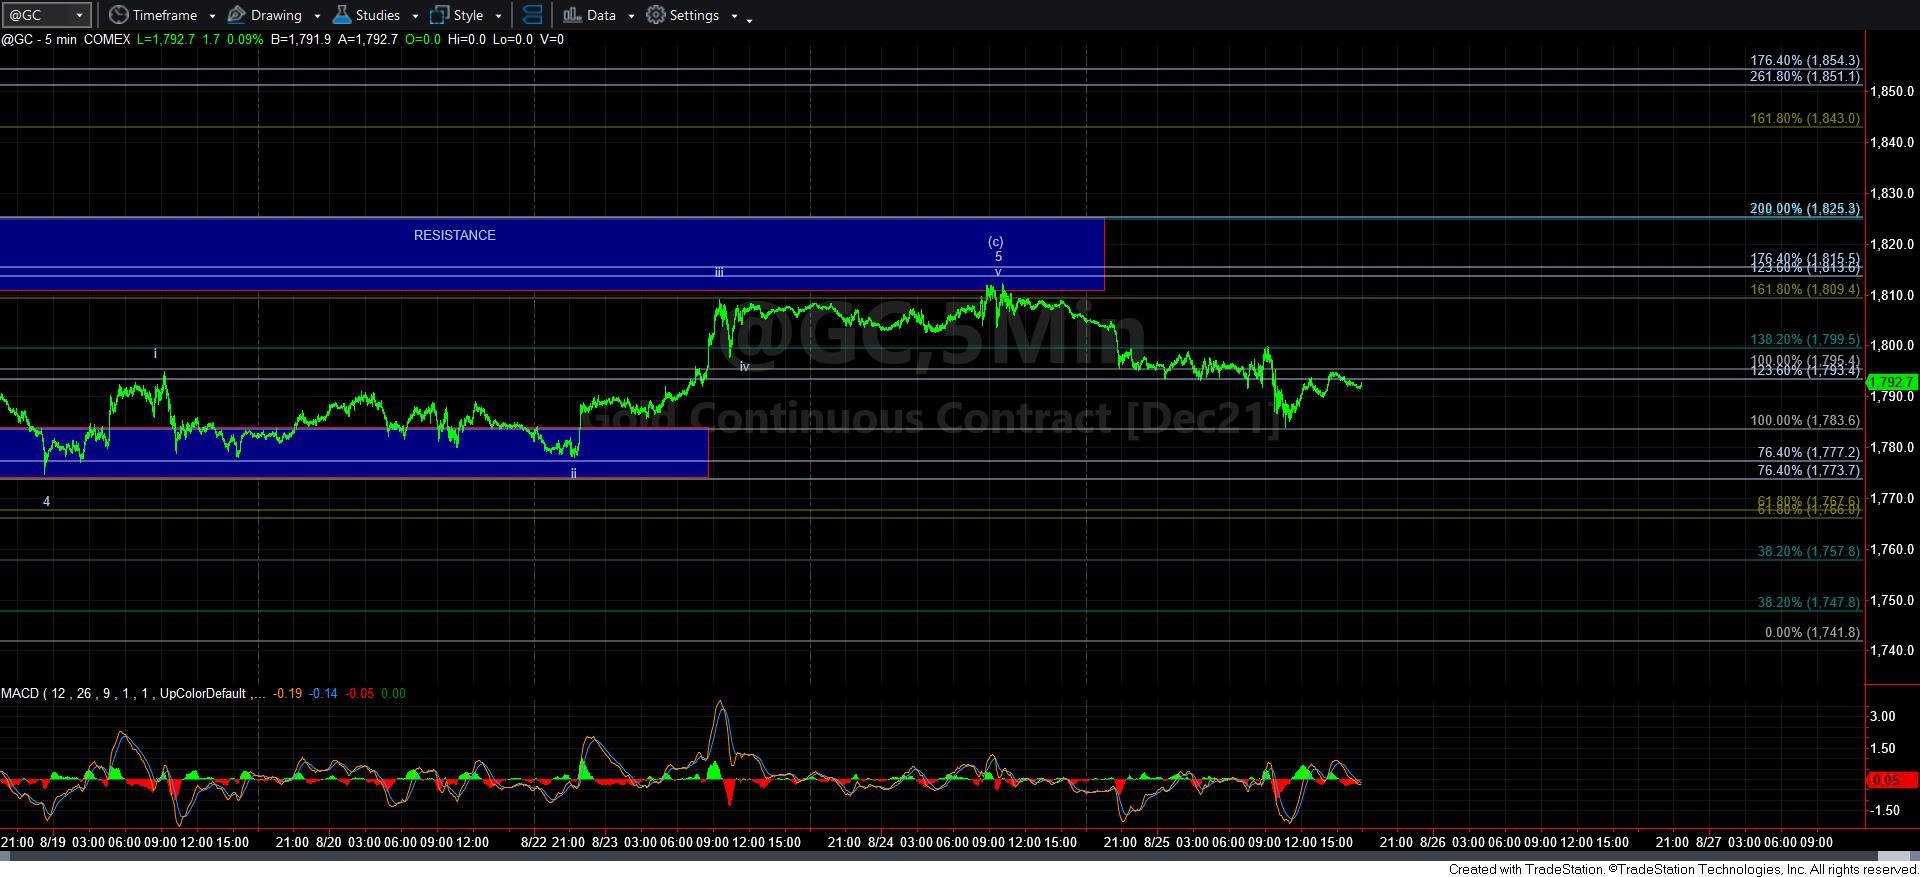
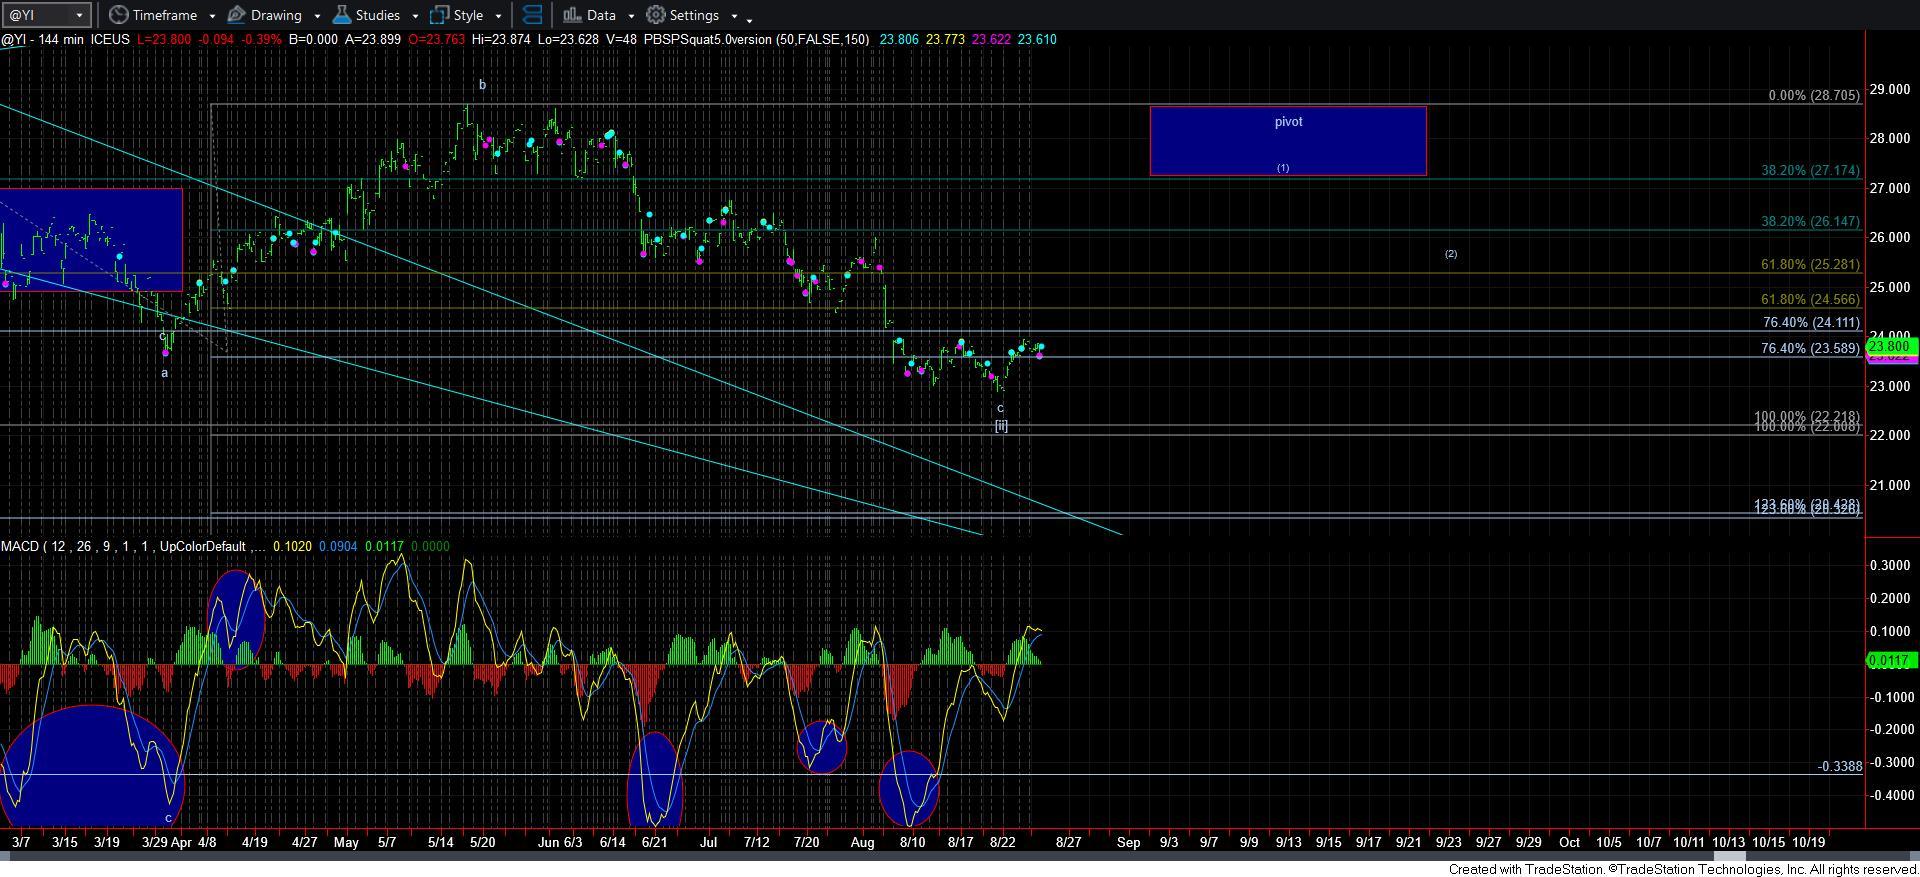
In the GC chart, we have seemingly completed an [a][b][c] corrective rally right into our resistance region. And, one can even argue that we have an initial 5 wave decline from that resistance. In order for GC to even have a shot at an immediate bullish resolution it must rally back up over yesterday’s high and rally through the resistance region. And, even then, the only way I can consider a bullish count is as a leading diagonal, which, as many of you know, is not a reliable indication to me.
Again, silver still retains the best impulsive structure out of these charts, and we can even make out a micro 1-2 structure off the recent low. But, we are still a long way from turning me into a near term bull.
To me, the most clear pattern is provided in the GDX chart. And, the bulls have their backs against the wall, and must come out playing to win. Anything that comes up short in the next week can send us down in a big way in the coming weeks/months.