Tesla: Were We Wrong? An Important Update
 By
Levi
By
Levi
By Levi at Elliott Wave Trader; Produced with Avi Gilburt
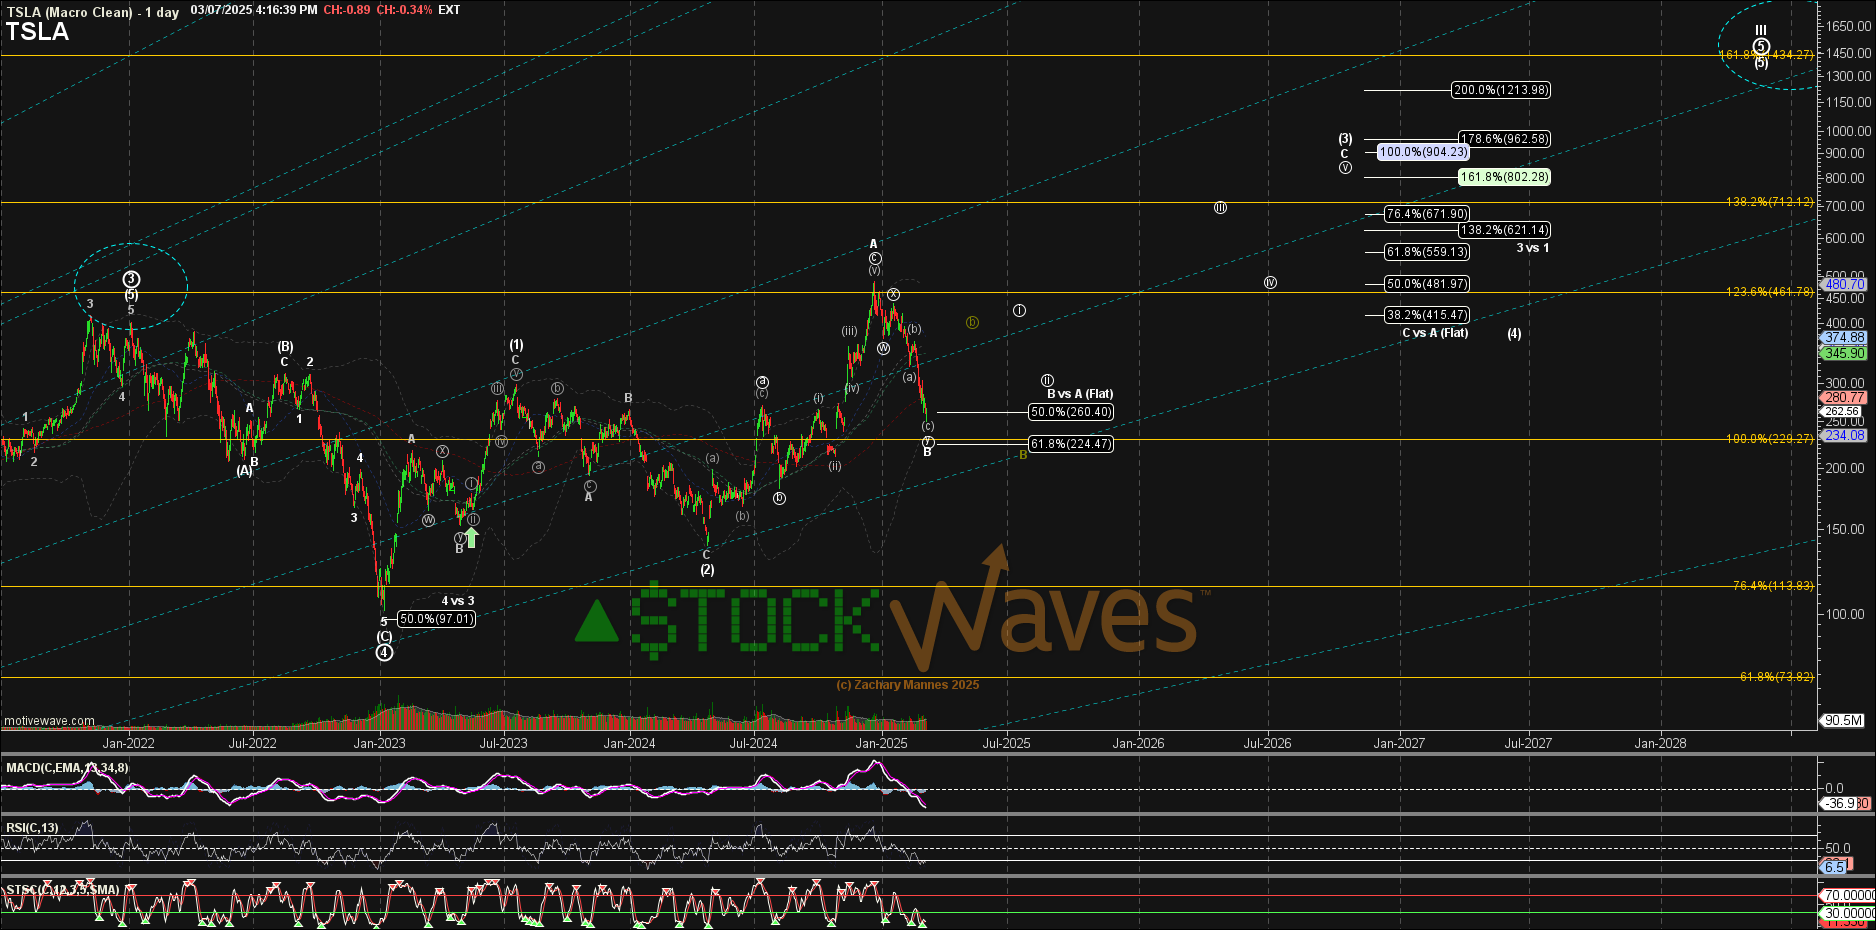
You know, we road the last bullish setup from $219 up to $484 before pulling the rip cord and showing the caution light, near exact trough to peak. The current pullback was anticipated and ideally projected to complete in the $302 - $315 region. Obviously we have extended below that area. But please allow us to show you what we are seeing now and why this is actually quite a solid scenario for an upside resolution.
A Swing And A Miss
Kindly take into consideration that our initial anticipation for this corrective leg was for a smaller [a] wave of the B that is now completing in its entirety. This means that the entire B wave would have formed an a-b-c structure and reached where we now actually find ourselves. Obviously price has decided to stretch lower sooner rather than later.
What does this mean? Clearly our scenario was wrong. Like a swing and a miss, we saw the pitch, it looked good and we took our chance. But there is something even more interesting to behold. Let’s get into the latest update that Zac Mannes just put out for our members. We wanted to share it with the readership here as well.
Back At The Plate
Even the best hitters strike out from time to time. Some traders may have stopped out of a long position take in the low 300’s. Others are adding to positions, and yet more may be flat or even short shares. Let us share with you this current setup as we are able to identify it and where shares might go to next.
Zac Mannes:
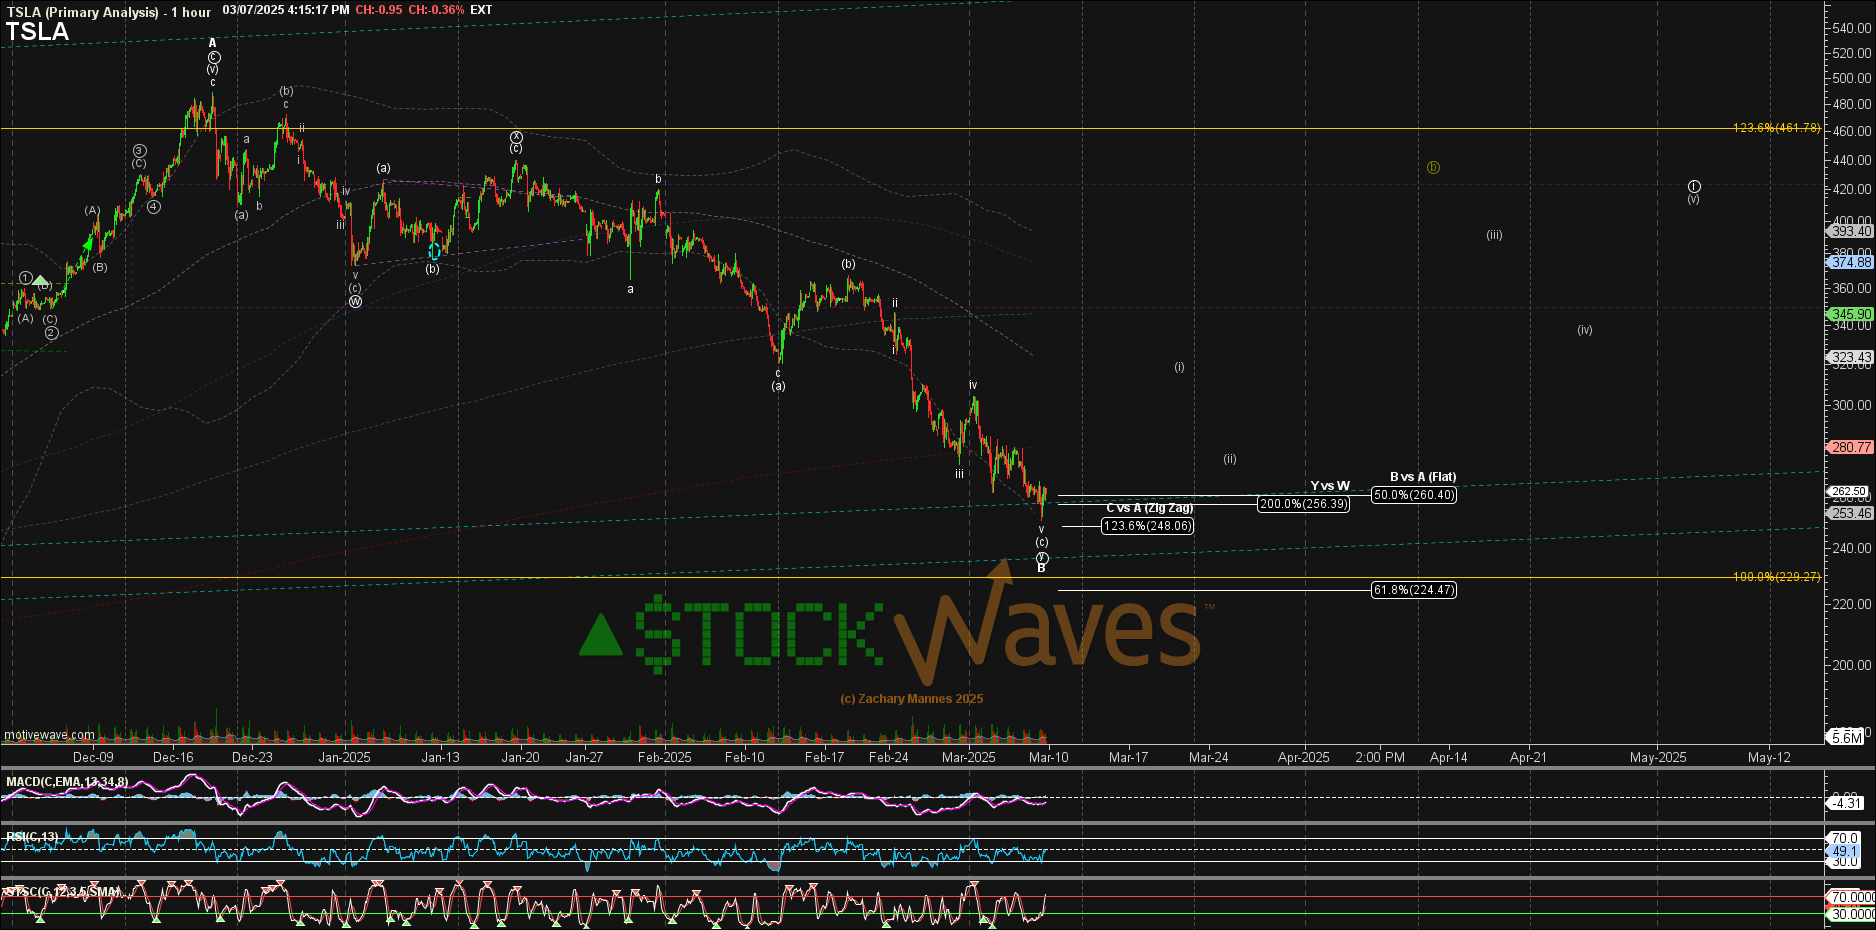
“In our 2/18 article we were looking for more of a B-wave to fill out with an immediate drop as the fifth of a [c] wave to possible complete the circle ‘a’ of B in the 315-302 region. It got that drop into the end of February, extending below the 300 region to the 200 day MA at 280. This could not count as ALL of the B-wave rather than merely the first half of a wider B. However the stretch was starting to get a little big to count as a fifth of a c-wave.
We shifted our subwave count in the StockWaves room to a ‘w-x-y’ for the B and thus inside of a fifth the [c] wave of ‘y’ had more normal proportions. But that did also allow for a bit more further extension toward the next Fib for B, the 50% in the 260 region. We are now looking for 5 waves up, 3 waves down to start to confirm the start of a new wave one of C.”
To sum up what we are seeing: the $250 area is key to hold in the near term. There are enough subwaves to consider the entire downside structure as complete. Positive divergences are forming on the 1 hour MACD time interval. 5 waves up from here that takes out the $284 resistance level would be better confirmation of a low in place.
It's A Setup, Not A Certainty
We view the markets through a probabilistic lens. This means that given the structure of price on the chart, we then display and project what is most probable. However, we also keep in mind that the markets are not linear in nature, rather dynamic and fluid. As such, our view must also update as the price fills in each respective chart.
Please also recognize that this in no way is to say that we do not have strong opinions about the direction we see a chart like (TSLA) is headed. It simply is to acknowledge the changing tides of sentiment. What we really need is a methodology that will rapidly speak to us about the best way to adapt to something that is beyond our control.
Do We Control The Tides?
That's easy, of course not. But through science and observation, we have learned how to predict the ebbs and flows of the tides nearly down to the minute. Then, we adapt to what nature is giving us. Our methodology is no different from adapting to what the markets show us. And, it is through science (biology) and observation that we have learned the true nature of how human behavior plays out before our very eyes via price action of stocks and indices.
Do You Have A System In Place?
Those who have experience forged by time in the markets will tell you that it's imperative to have a system of sorts in place. You need to be able to define how much you are willing to risk versus how much gain is likely. Those who survive across the decades in the greatest game on earth will also inform you that the preservation of capital is paramount.
While there are multiple manners of doing this, we have found Fibonacci Pinball to be a tool of immense utility for traders and investors alike. For much more information on how this system can work for you, please begin with part one of a six part series of articles from Avi Gilburt, "This Analysis Will Change The Way You Invest Forever."
I might also suggest giving this methodology a fair shake. Why? If you have heard of Elliott Wave Theory, what was the source? Surely, you would want to consult someone who has performed an in-depth study of the how's and why's of the method. As well, this comprehensive investigation would be backed up with published studies on the matter and a body of work that shows the utility of said methodology in real-time.
Conclusion
There are many ways to analyze and track stocks and the market they form. Some are more consistent than others. For us, this method has proved the most reliable and keeps us on the right side of the trade much more often than not. Nothing is perfect in this world, but for those looking to open their eyes to a new universe of trading and investing, why not consider studying this further? It may just be one of the most illuminating projects you undertake.
