Tesla: The Narrative Or The True Story - Which Will Help You More?
 By
Levi
By
Levi
By Levi at Elliott Wave Trader; Produced with Avi Gilburt
Aren’t we talking about the same thing here? Story versus narrative - what’s the difference? We’ll get into that as it pertains to Tesla. Also, we’ll give a real-world results update that you can verify via past articles that we’ve shared with the readership over the past several months. What’s more, we’ll examine the big picture for the (TSLA) chart and the near term projection. Give this information a chance to reach the reasoning center of your brain. Allow it the opportunity to show you an entirely new way of viewing the markets - you just might even surprise yourself.
Right out of the gate, know that the structure of price as we are able to identify on the chart is bullish for (TSLA). This does not mean though that there won’t be some serious twists and turns to be seen and navigated along the way. This is the story that we mention. It is much different than the narrative.
Beware The Narrative
As human beings we love narratives. Tell me a tale, captivate my mind, or at least entertain me while time passes by. However, these are narratives that are meant to stir emotions. This is one of their main purposes. Emotions are sentiment and vice versa.
But, here’s the danger as an investor. While emotions are certainly present in the investing environment, rather than be adversely affected by them, why not use this to your advantage? However, if the individual becomes caught up in the sentiment of their surroundings, then, rather than benefitting from emotions, their own feelings and decisions will be skewed. How many times have you sold the bottom or bought near the top? We’ve all experienced this at some time in our time as investors and traders.
The narrative for (TSLA), and even the markets, is spun from the fabric that the source wishes you to hear. Are they selling for or selling against? The tale can be crafted to fit both sides of the same coin. And, really that’s what makes a market. Wouldn’t you like to have a uniquely and dynamically adaptable tool in your belt that could assist in removing some of the subjectivity from investing? Give this next section a chance and then you be the judge.
Does This Really Work? See The Results For Yourself
We will be the first to tell you the answer to that question: “Not always”. However, we have yet to find another analysis methodology that can provide context at any moment in time for the observed market/stock. Nor have we found another tool that can dynamically adapt in real-time to the markets as this does. Please allow me to show you the recent history of our TSLA articles shared with the readership over the past several months.
Our most recent is the piece from a few months back entitled, “Sentiment Is Telling A Story - Are You Listening?”. (TSLA) price is up +112% in that time period. That’s not a misprint. +112% vs a +3.69% gain in the (SPY). Caution is advised against conflating the narrative here that this has only happened because of ‘X’ taking place. We have been projecting this path for many moons now. Let me show you that history.
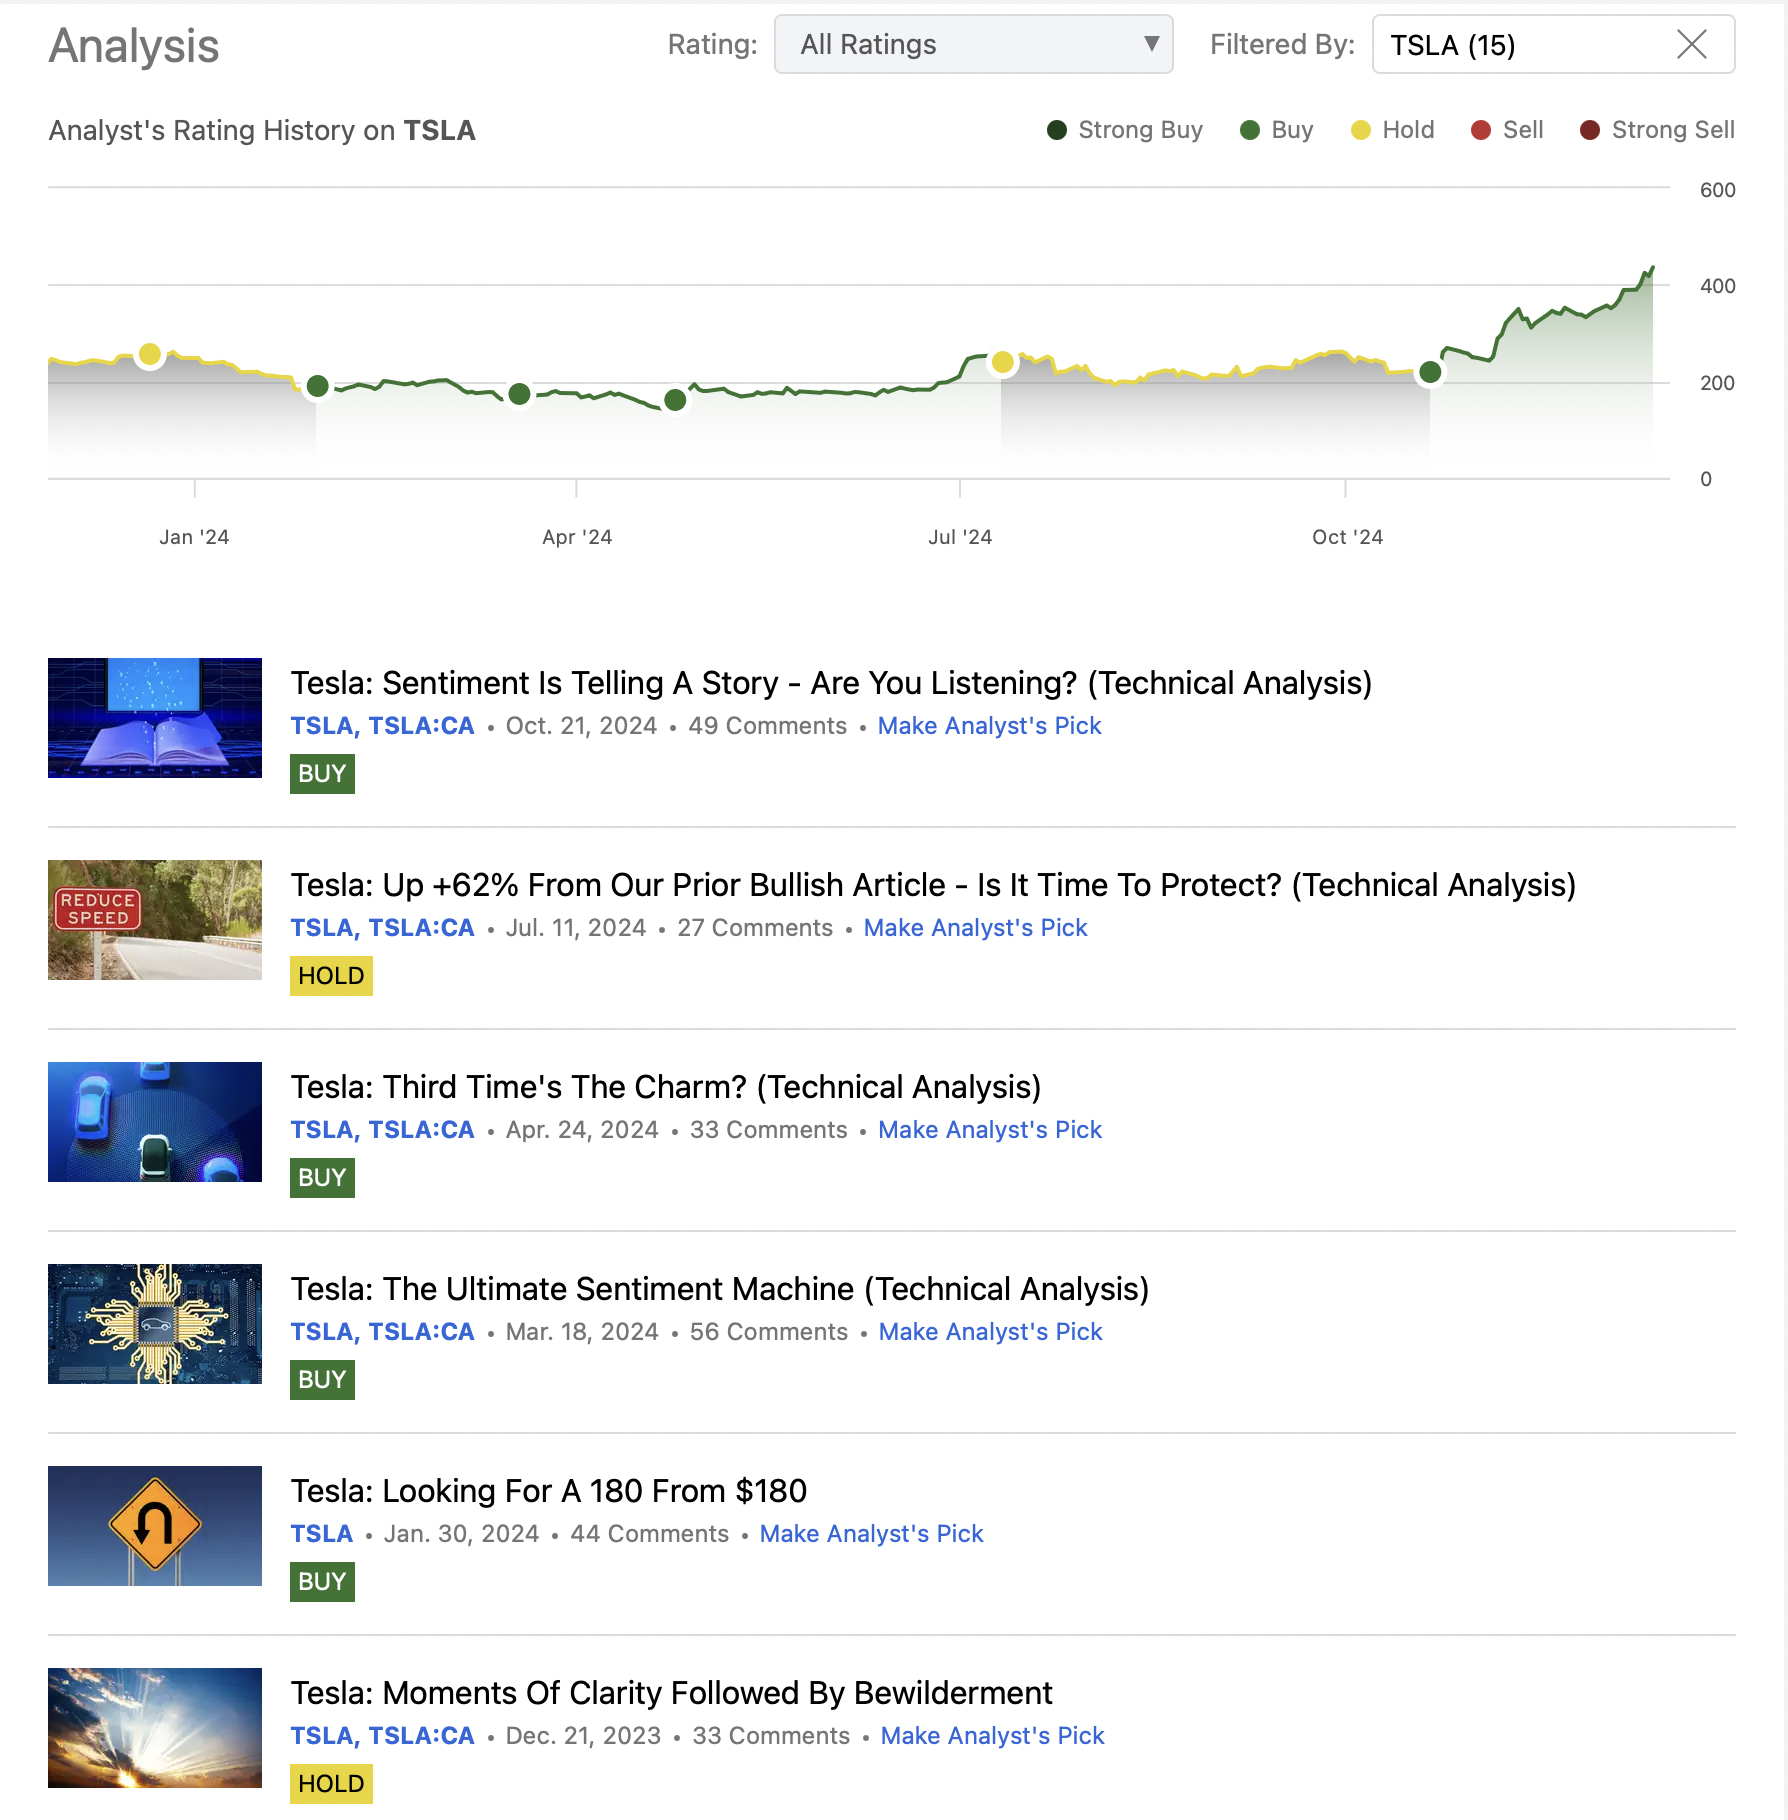
(credit: Seeking Alpha)
The rating system requires that we place a “buy”, “hold”, or “sell” on each article. In reality, the nuances of this methodology are much more granular in nature and complicated than a simple label. Even in this case though, articles have been published for the readership as we are able update in these public forums. And it happens that they have consistently come out at key turning points. We may indeed be at another such pivotal moment right now.
Sentiment And Its Story
Do you want the true story of what’s really taking place with a stock or the market itself? Avi Gilburt recently published this article for the readership regarding (SPY): “Sentiment Speaks: This Time Is Different”. Here’s a brief excerpt from the introduction:
“General George S. Patton once noted that “if you are thinking like everyone else, then you are not thinking.” Effectively, he was trying to convey that if everyone is thinking the same thing, then everyone is simply following the crowd. And, this is what we normally see at major market tops.
One of the key factors in signaling a major market top is the expectation by the masses that one cannot happen. And, anyone who knows their history knows this to be true.” - Avi Gilburt
I would encourage you to take the time to read that piece in its entirety. As well, there is a plethora of other pieces to peruse and enjoy. These will edify and educate your mind to a new way of viewing the markets.
The basic underlying premise is that while economic fundamentals do matter, sentiment and human behavior is what leads markets. We have much educational material available for those willing to invest the requisite time and effort into the endeavor. Here is how we correctly apply the study of sentiment to the current (TSLA) chart.
Theory In Action Via The TSLA Chart
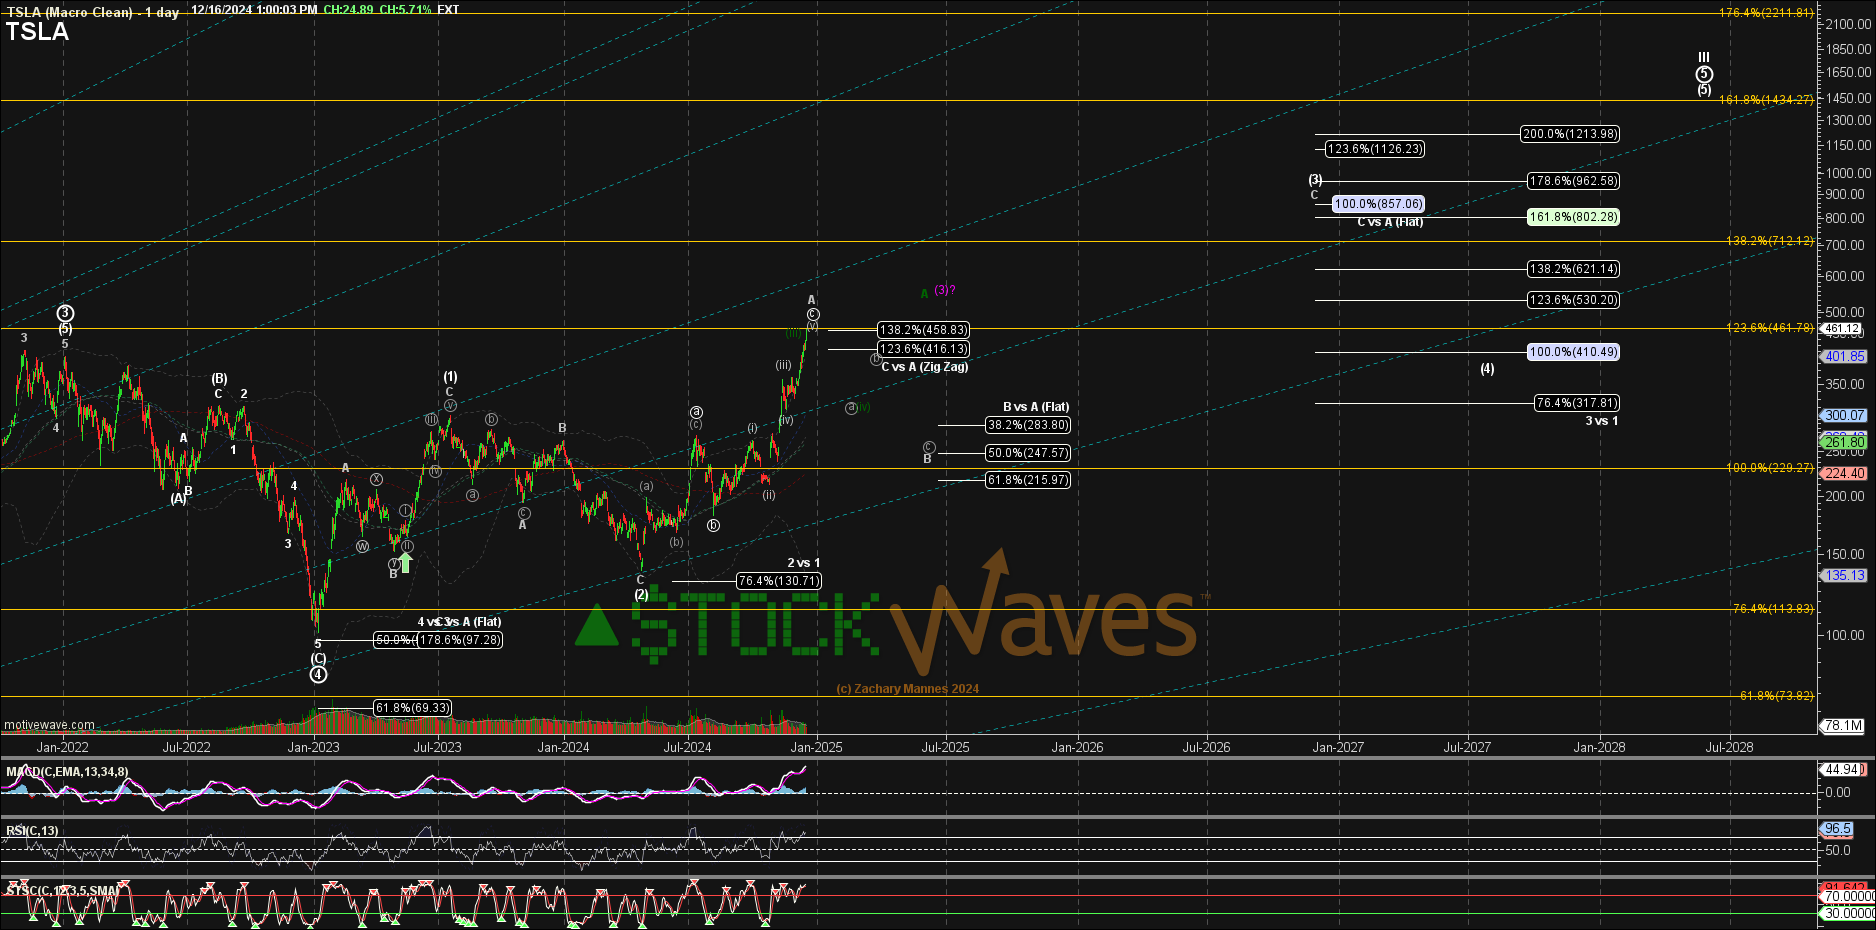
As you can see on the chart shared by Zac Mannes, the structure of price projects much higher for (TSLA) over the next several years. This projection is not a prophecy that must be fulfilled without fail. It is a projection of probabilities. We view the markets via a lens of probabilities. It is the adaptability of this method that allows us to rapidly adjust should our primary path not play out as projected.
Supposing though that this chart is what will take place over the next weeks to come, we should be nearing a swing high in price for (TSLA) quite soon. This high will be followed by a corrective consolidation and pullback.
We will closely monitor this pullback by means of the structure of the smaller subwaves that price forms. You can see on Zac’s chart shared above that there are a few possible permutations for the near term. Primary is in white and there are two other potential paths in green and magenta. All three paths do point to a likely swing high soon. Then it will be the structure of the pullback that points us to what’s most likely next.
Price should find a swing high in the $475 - $523 price range. We favor the lower end of that range and will be closely following the structure of price in any pullback.
Conclusion
Sentiment is simply human behavior, which is not logical or reasoned, in motion via the price of the stock or the index being analyzed. If (TSLA) trades mainly on sentiment, then how would it be possible to track in any reliable fashion something that irrational?
This is precisely why Elliott Wave Theory, when correctly applied, can help bring some structure to an illogical, emotional environment. There are some important and, for lack of a better word, fundamental guidelines that we must employ to understand the structure of price.
Yes, there are nuances to the analysis. Once familiar with our methodology, our members discover a powerful ally on their side to provide guidance and risk management in their trading/investing.
There are many ways to analyze and track stocks and the market they form. Some are more consistent than others. For us, this method has proved the most reliable and keeps us on the right side of the trade much more often than not. Nothing is perfect in this world, but for those looking to open their eyes to a new universe of trading and investing, why not consider studying this further? It may just be one of the most illuminating projects you undertake.
