Tesla: Sentiment Is Telling A Story - Are You Listening?
 By
Levi
By
Levi
By Levi at Elliott Wave Trader; Produced with Avi Gilburt
The Structure Of Price Tells A Story
We’re going to delve into the story that the structure of price on the TSLA chart is telling us. Sit down with your favorite beverage and give it a chance to perhaps open your mind to a new way of viewing the markets.
I want to share with you that this is not “Technical Analysis", as you may know it. It is not trendlines and moving averages. Over many years of diligent study, observing markets in real-time, superimposing our methodology onto price as it unfolds in front of us, we have come to appreciate that this is not a linear environment.
*This being the case, how could we apply linear analysis to a non-linear world? That simply would not work in reliable fashion*
So, while this may be ‘tagged’ as “Technical Analysis,” it really is so much more than this. We have a multitude of educational information available to those wishing to explore this further. In just a bit of time and with a portion of effort, you just may discover the true nature of the markets and come to understand them with greater depth, especially regarding stocks like TSLA.
What Exactly Is This Methodology?
Over the years, we've had many questions about how we arrive at these targets, along with support and resistance levels. Some are less than genuine in their intentions, but quite a few honestly want to know how we are consistently able to find these high-probability setups.
If you would truly like to learn about this methodology, Avi Gilburt is an active educator. Take note of one of his past articles here. Inside this piece, you will see a detailed dive into the how and why of Elliott Wave analysis. Here is a brief excerpt:
“For those of you that have not read my analysis before, you are probably thinking that I will change my bullish perspective if rates rally a bit more, or if inflation numbers come in a bit higher, or if the war in the Middle East expands, or for many other reasons most view as being important to the market.
But, those that have read my analysis for some time know that none of that really matters to the market in the bigger picture. And, I have provided a multitude of real-world examples, as well as many recent studies supporting my perspective in many prior articles. So, I am not going to go into that again in this missive. Rather, I am going to try to take some time in this article to explain how I view the current structure from an Elliott Wave perspective.
Moreover, this article will go into a lot of basic instructions regarding Elliott Wave patterns. So, you may want to stop reading if you really do not want to learn something about Elliott Wave analysis.” - Avi Gilburt
A Brief History Check Of Past Results
We do our best to regularly update the readership of what the structure of price is telling us on the TSLA chart, as well as many others. Let’s take a quick trip back so as to review the most recent articles regarding TSLA.
Here’s the last piece we wrote back in July of this year: “Tesla: Up +62% From Our Prior Bullish Article - Is It Time To Protect?”. And to accompany the link, this tidbit: just after it was published price declined some -80 points, right into support. Timely information indeed. You can also see from the chart below that the prior three bullish setups took a bit to gain true traction.
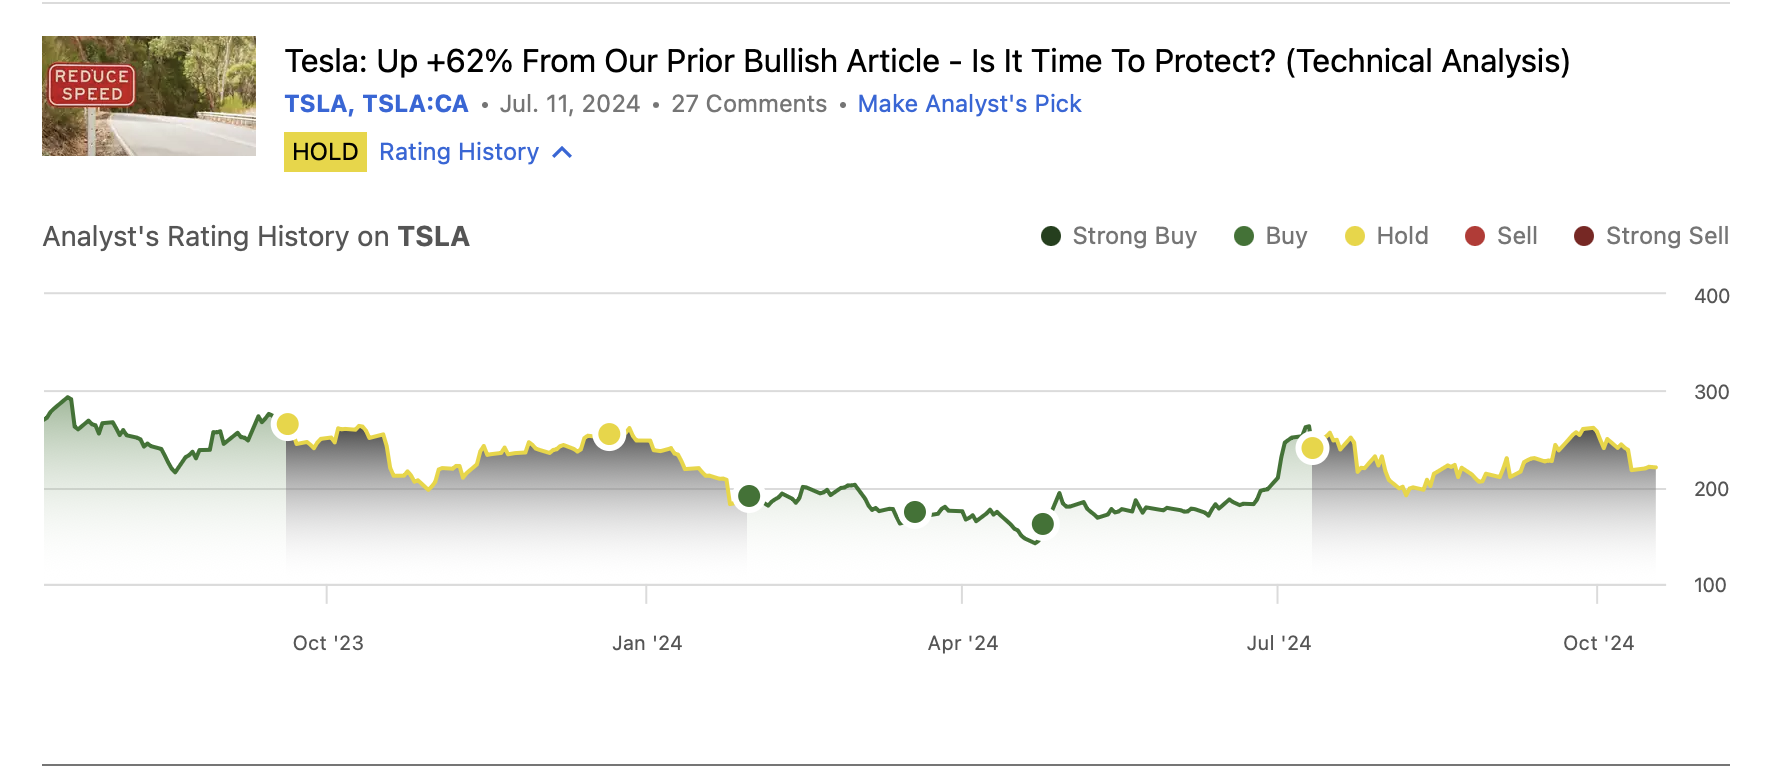
(Source: Seeking Alpha)
This can be the case in a non-linear environment. We see this across sectors as we are not always dealing with straightforward structures. Human behavior is dynamic, and as such, so are stocks and the market.We are currently seeing a potentially bullish setup in the TSLA chart. Let’s use our Wave Setups feature to provide some guidance.
Wave Setups Applied To TSLA
This is a feature for members that we also often share with the readership. Take a look at the current parameters for the near term setup in TSLA stock.
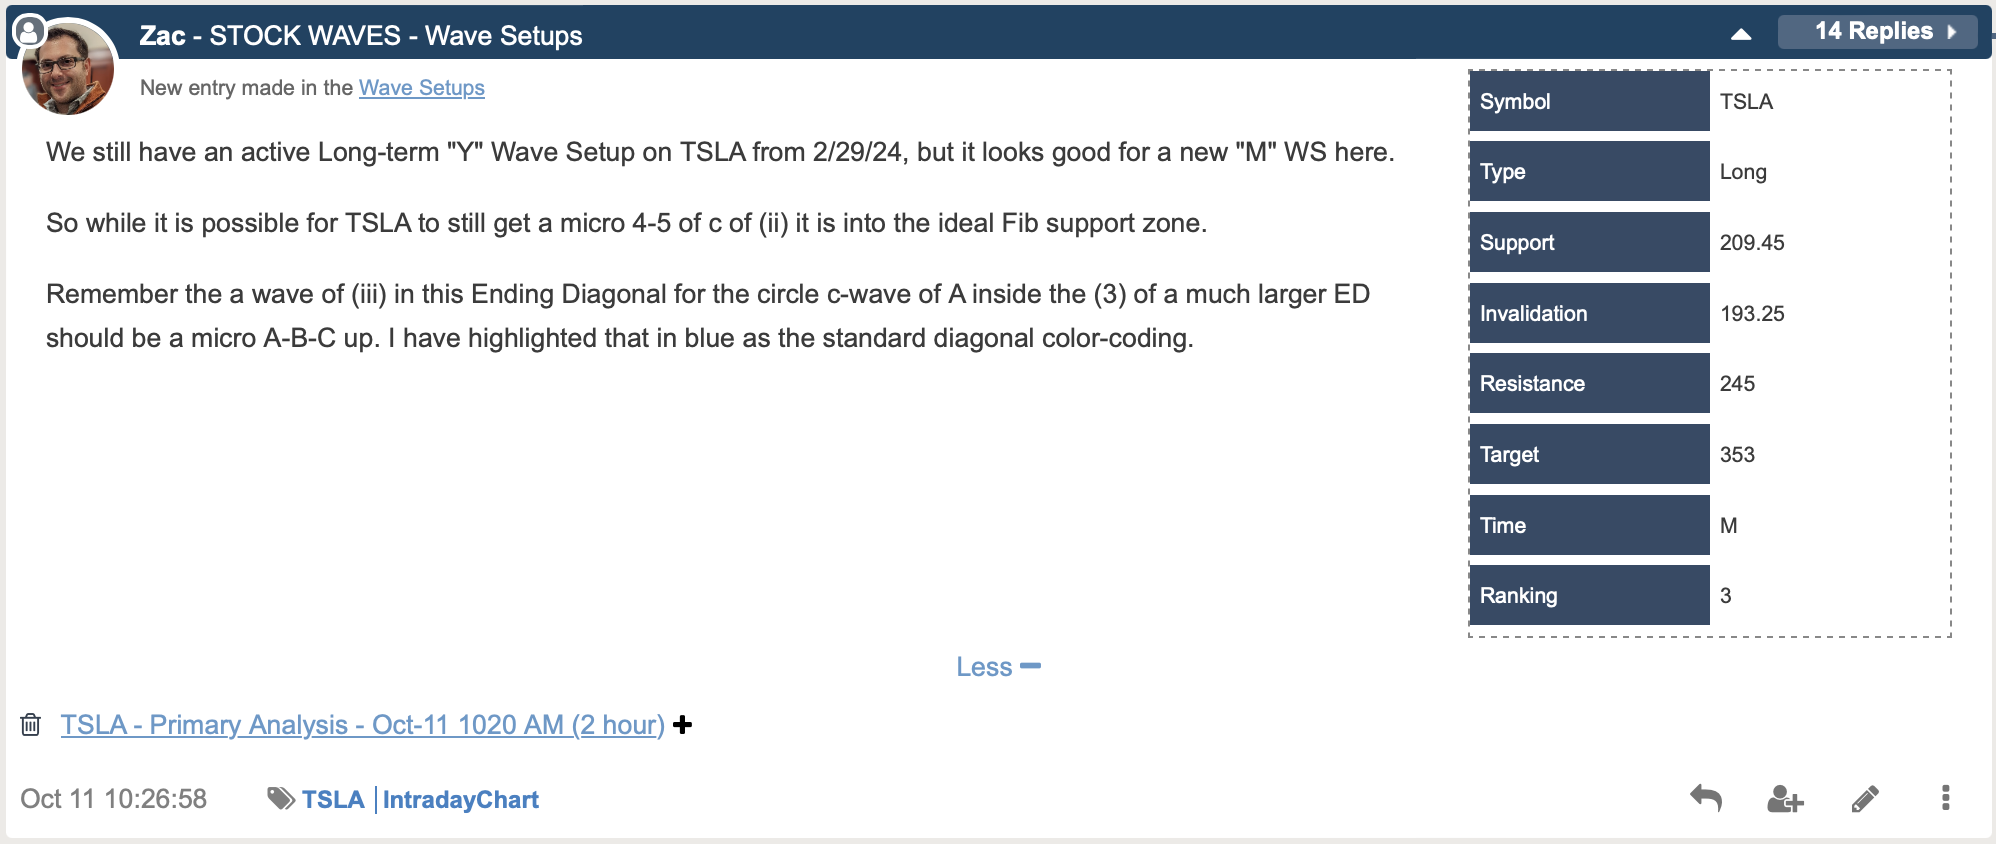
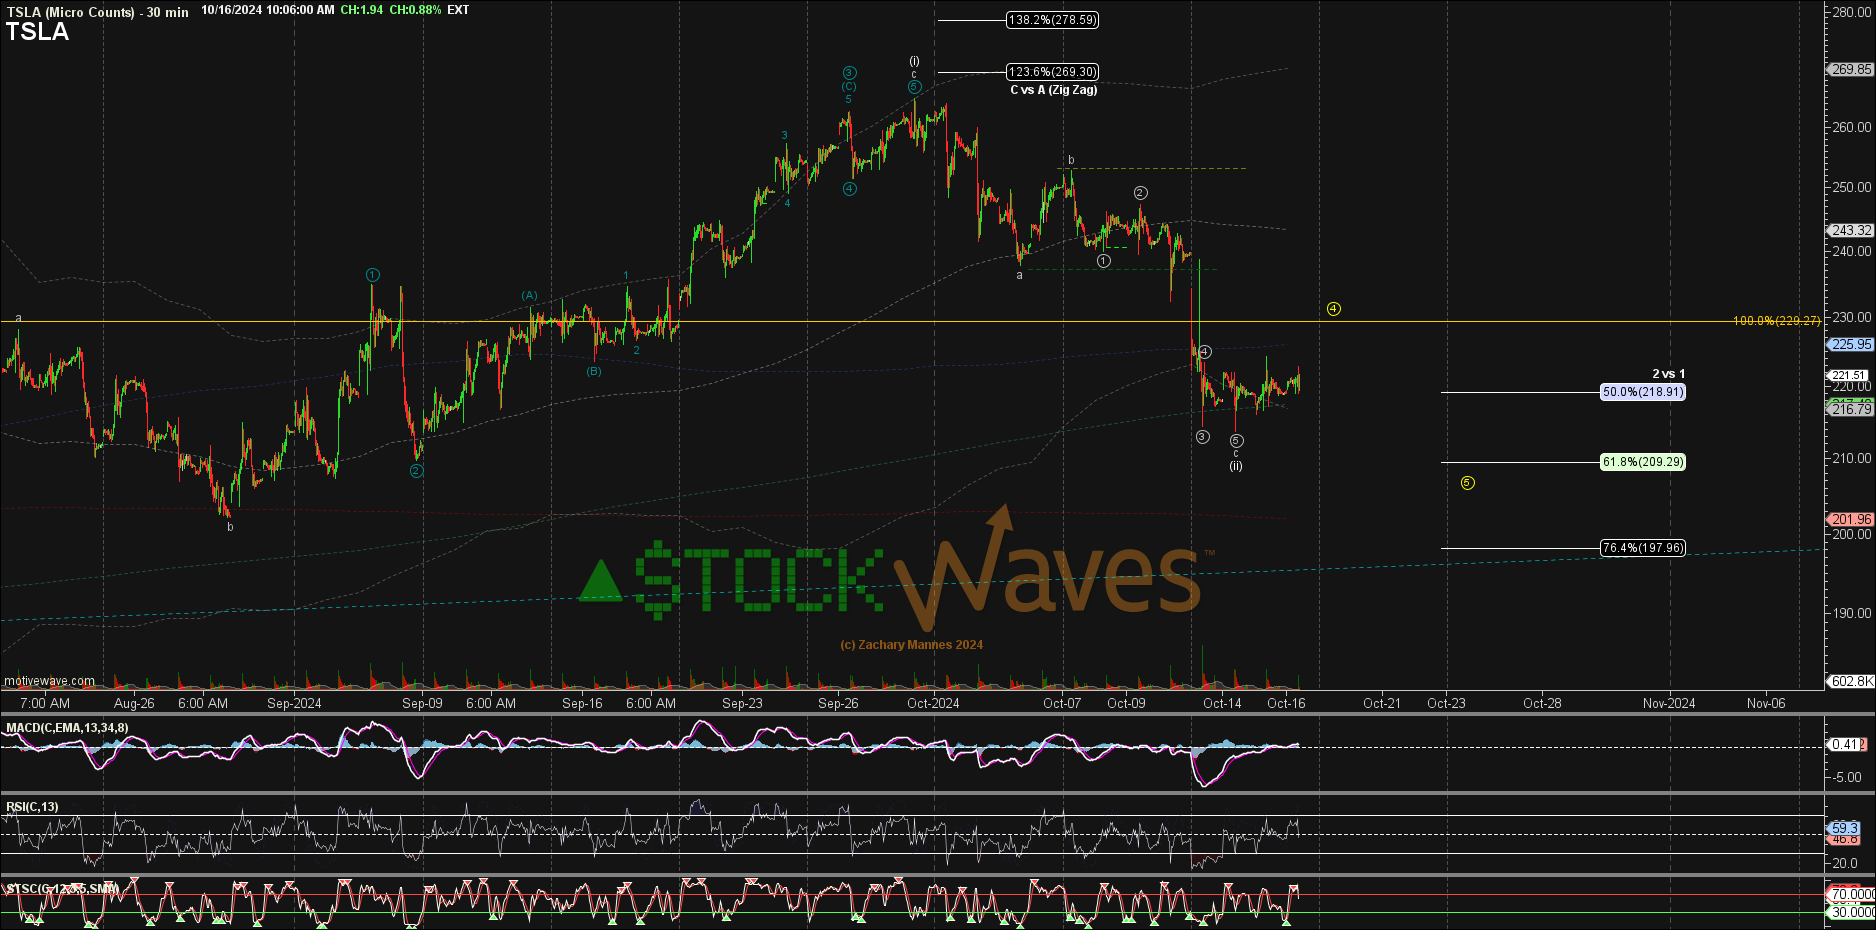
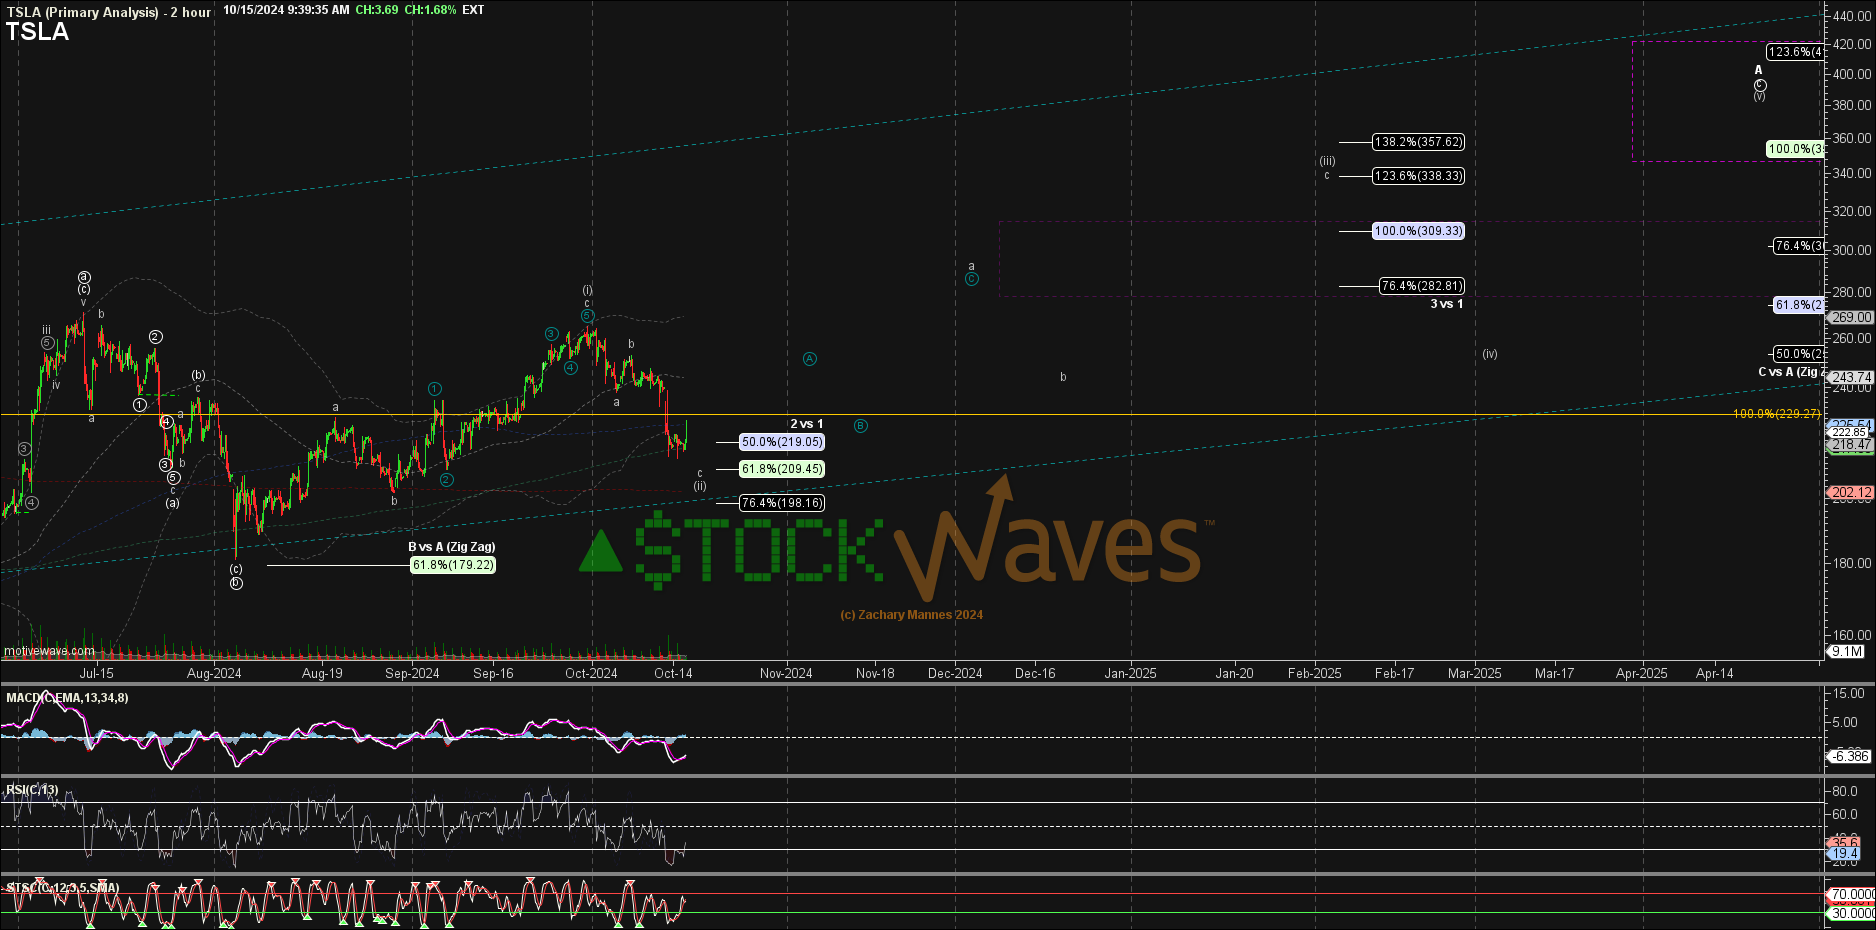
As you can readily see in the table we have clear levels that define risk vs reward and where the scenario would invalidate. Yes, in the immediate time frame, there are some minor machinations possible. Note the 30 minute interval chart below as well as a bigger picture view from our two lead analysts, Garrett Patten and Zac Mannes.
Now, please keep in mind that these scenarios are not certainties. Rather, they are probabilities. We view the markets via a probabilistic lens. That means that we identify what is the most likely path and also provide a plausible alternative should the primary path not play out as illustrated.
And, we have noted over many years of observation and study that guiding our analysis by standards and then applying these to the primary path projection typically will lead to consistent success.
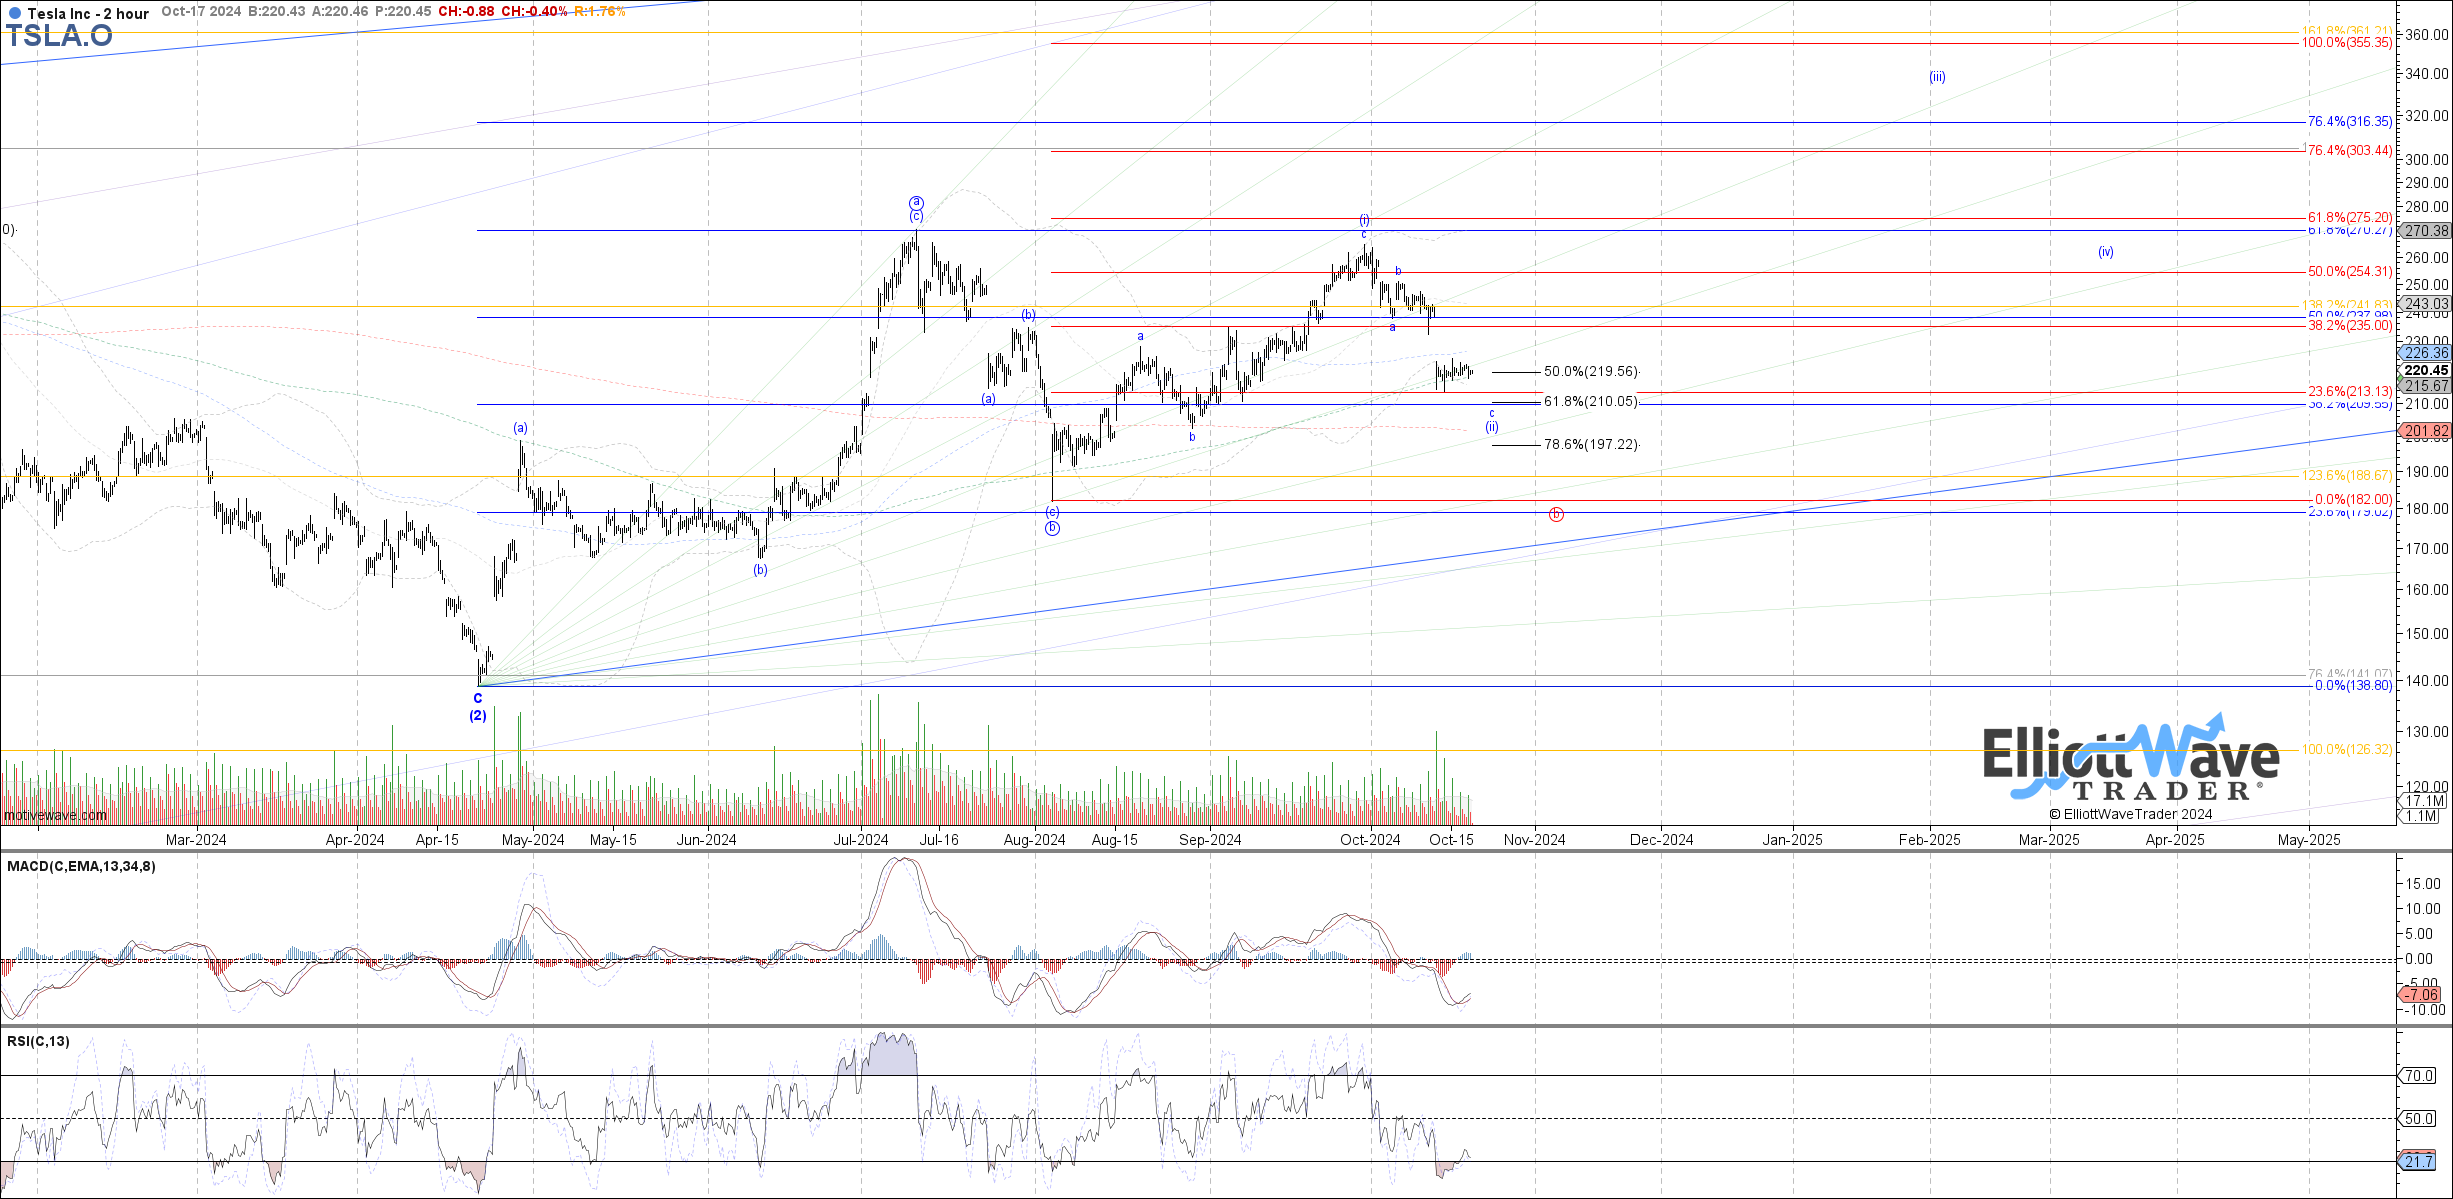
So, here is what we are able to identify in the near term and the bigger picture for the TSLA chart. Should the 209 area or higher hold, then we should next see a move above 230 to better confirm that an important low is already in place. From there, you can see on the attached charts how the subwaves will likely fill in the structure of price on the way up.
However, if price moves directly below the 209 area it would suggest that the 180 zone is more likely instead. And we would accordingly set up a new scenario with updated parameters.
This is not unlike what happened in the prior three occasions we shared articles with the readership. Each setup provided a bullish opportunity with clear parameters. A nimble trader could have entered the trade and likely would have stopped out at a slight profit or near breakeven when the upside did not follow through as suggested.
When the bullish sentiment did actually take hold in the third scenario, price advanced some +62% into the time we shared the article where we turned cautious.
Don't Be Turned Off By Misapplication Of This Methodology
Obtaining a true understanding of this methodology takes time and effort. For those willing to invest in said effort, it pays off immensely. Those who are turned off by the words "Elliott Wave" typically have come across those who misapply the theory or are not willing to devote the requisite energies needed.
Our methodology is pointing to the potential for a low-risk, high-reward bullish setup for TSLA stock. Not all paths will play out as illustrated. As mentioned, we view the markets from a probabilistic vantage point. But at the same time, we have specific levels to indicate when it's time to step aside or even change our stance and shift our weight.
There are many ways to analyze and track stocks and the market they form. Some are more consistent than others. For us, this method has proved the most reliable and keeps us on the right side of the trade much more often than not. Nothing is perfect in this world, but for those looking to open their eyes to a new universe of trading and investing, why not consider studying this further? It may just be one of the most illuminating projects you undertake.
