Tesla: Preparing For Plaid Mode
 By
Levi
By
Levi
- TSLA continues to provide an excellent model for us to follow as we track its bullish structure of price.
- We believe TSLA has higher yet to go before a much larger pullback unfolds into 2022.
- Read further in this article about the evolution of analysis and the adaptability of Elliott Wave with Fibonacci Pinball.
There are Uber bulls and frenetic bears in the (TSLA) trade. You can take note of the high emotion that reigns in the comments section of any article tracking this current move in the same. Those that are long-time perma-bullish in their view will extol the disruptive technology now going main stream via (TSLA) vehicles and how all other automakers are miles behind them. The forever bearish provide the fundamental basis for their deeply entrenched beliefs. You will hear about metrics that are beyond reason and valuations that can never be justified. So, who is right?
To the reader that is interested in discovery how markets truly work, that is not the correct question to ask. Instead, ask yourself, does it really matter? Now, for those that will directly benefit from the technology and love the vehicles, sure, enjoy the conversation. But that dialogue will likely devolve into diatribes and discourses about how ridiculous the stock is currently trading and that it is surely to collapse to zero or lower.
Let’s ask another question based on what is possible and what is probable. Could something catastrophic happen to the (TSLA) product, management team or some other apocalyptic event down the line from here? Yes. It’s possible. But, what is probable? Do you buy life insurance because you believe you will die? It’s in the case of some sort of catastrophe. You want your interests to be protected. So, if we follow what is probable, then (TSLA) is likely to continue along the current structure of price.
This is why we use Elliott Wave with Fibonacci Pinball. Yes, there are many methods of analysis that lead their users to success in the markets. Our preferred method is not the only way. We embrace fundamental analysis. One of our primary analysts in StockWaves, Lyn Alden Schwartzer, is one of the finest pure fundamental analysts you will find anywhere.
She has also learned the synergy that can be enjoyed by using what many would describe as technical analysis. In our case, that is Elliott Wave with Fibonacci Pinball. We can get into the background and foundation of this at a later time. For now, let’s dive into what we see as most likely to happen next in (TSLA).
I would ask you to approach this with an open mind. Also, for the moment, press pause on your desire to ask “why?” and simply accept what is. Leave the “why?” to the pundits and your philosophy discussions. With no further preamble, here we go.
If you look back at the first article published here on Seeking Alpha on August 5th of this year, you will see the setup we were stalking for a long entry into (TSLA). There were two main scenarios we were following. As it turned out, our alternate scenario quickly ended up becoming our primary.
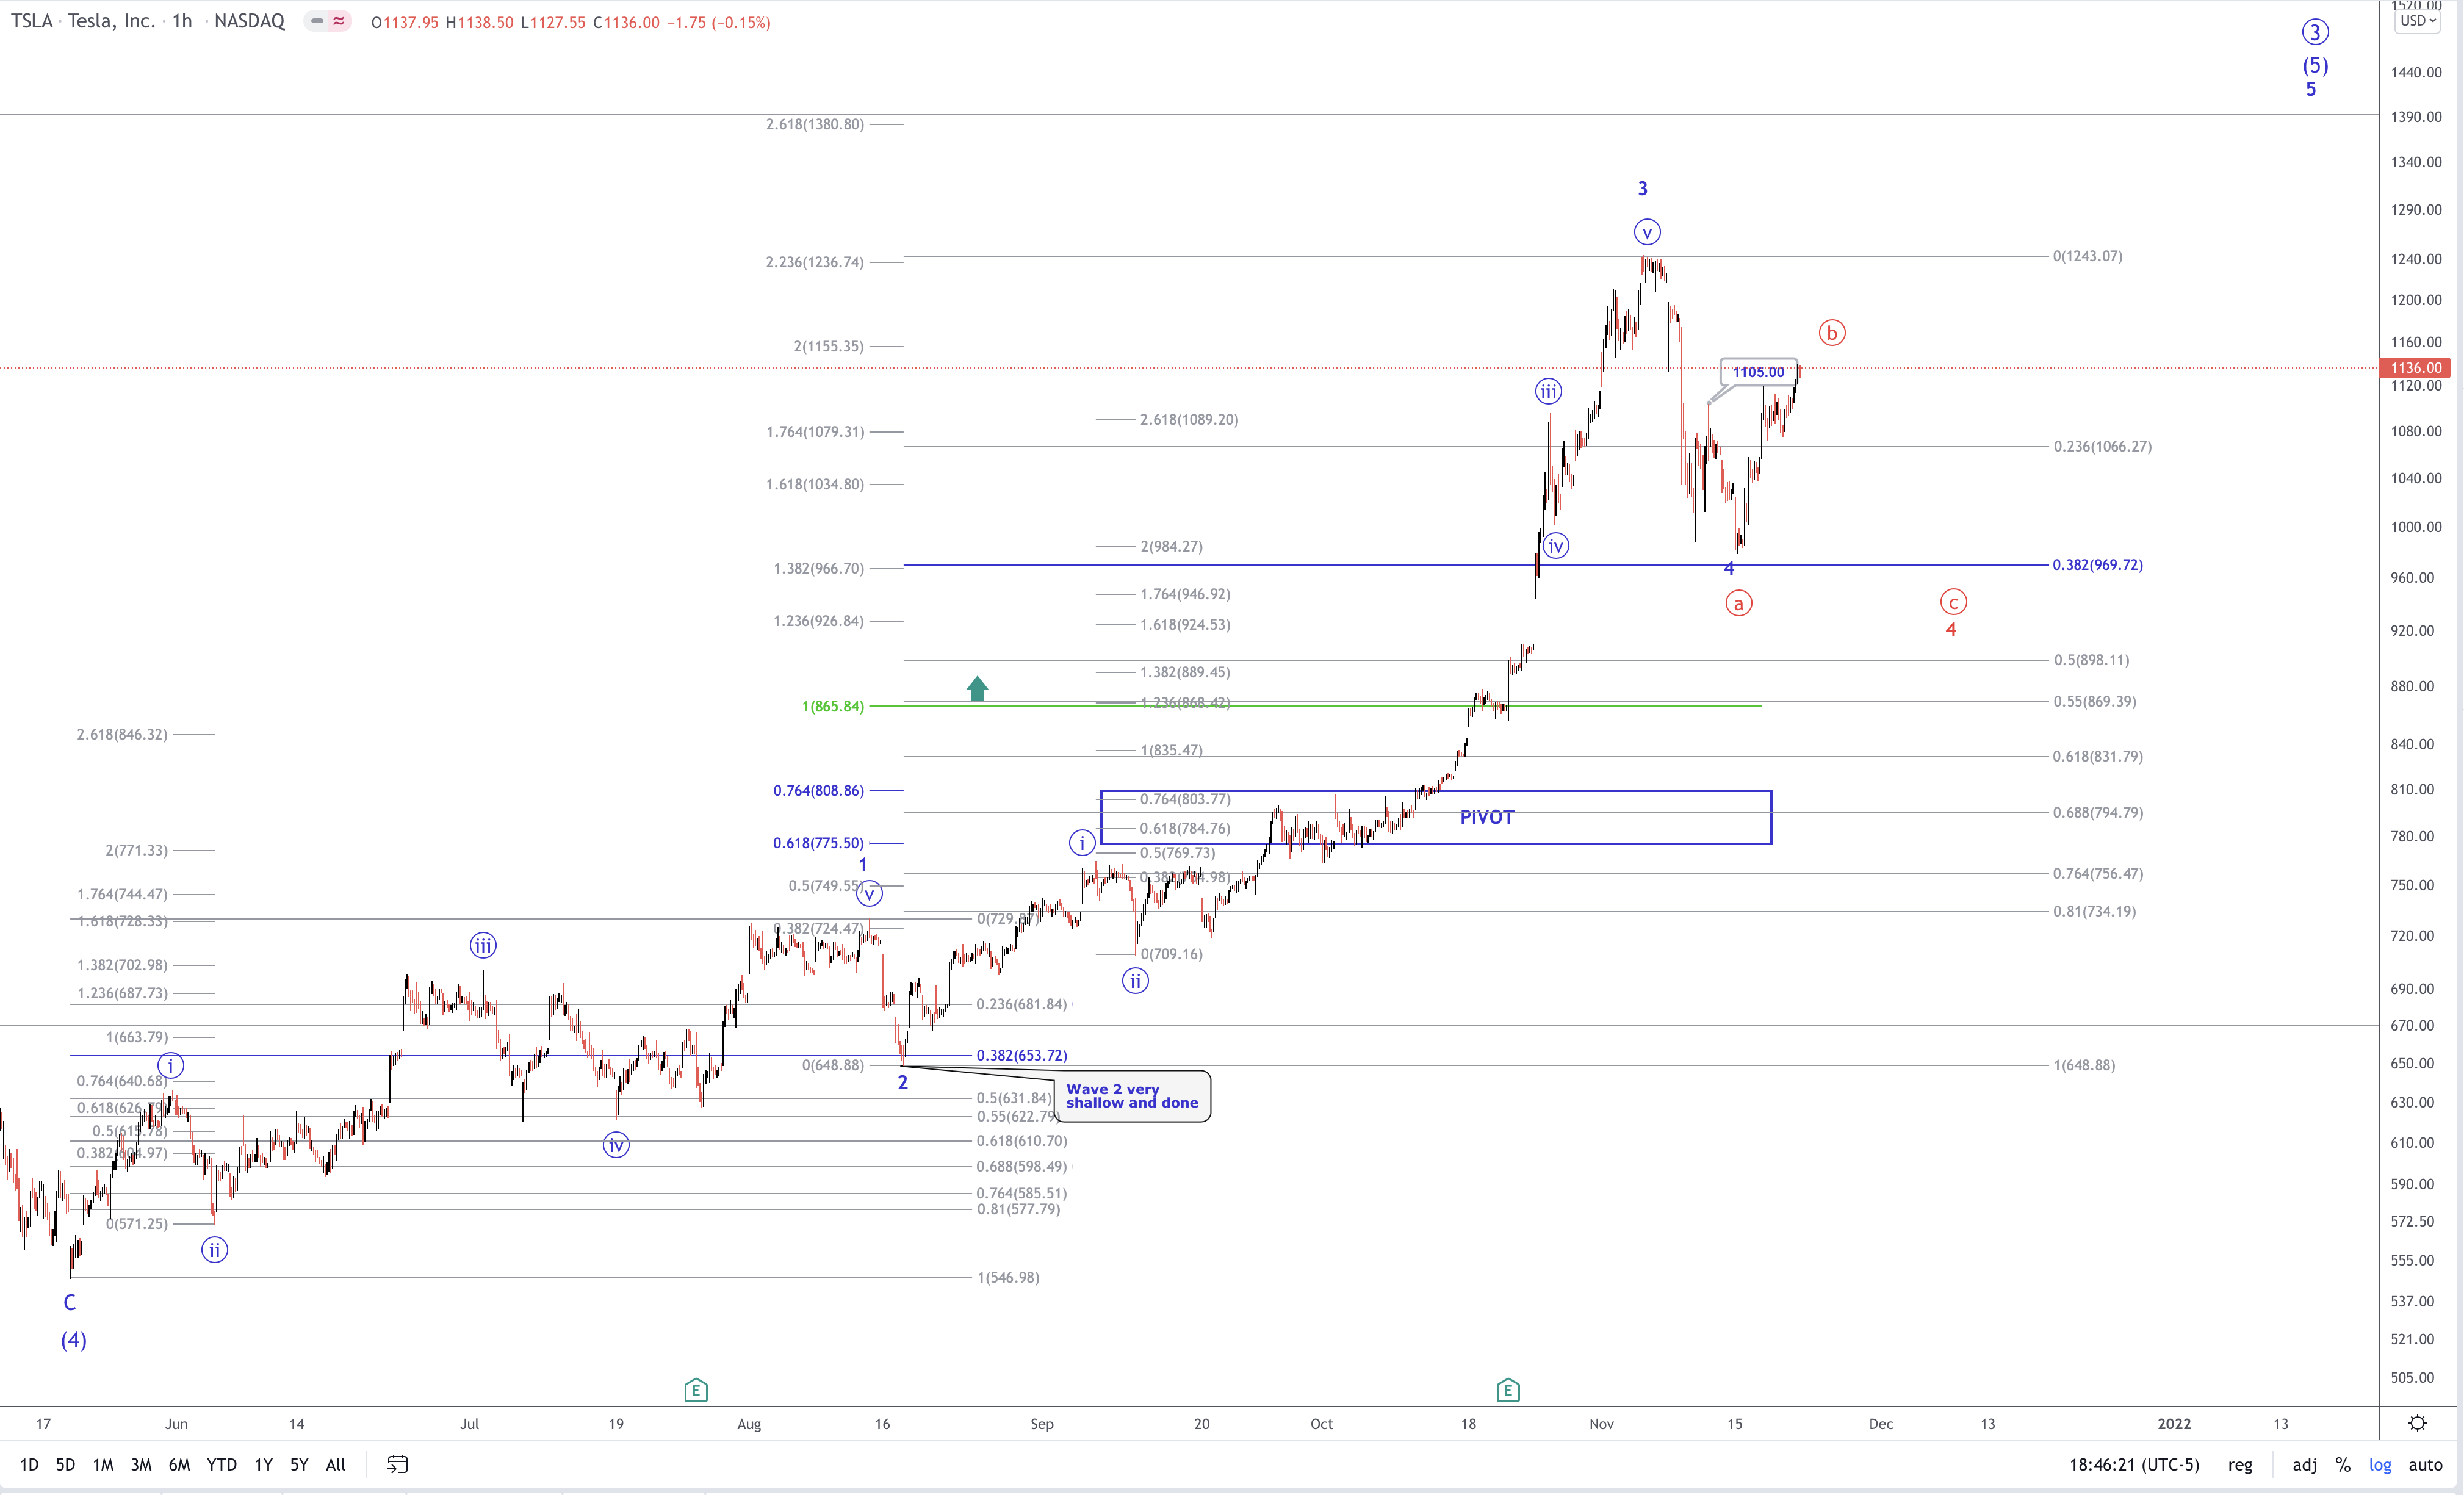
In that article and in the progression of our analysis in StockWaves we showed our members what was most likely to happen once (TSLA) conquered the pivot that is still displayed on the 1 hour interval chart shown in this current article. The initial target was the $1098 level. This is also where the progression of analysis is important.
As (TSLA) filled out its structure of price we were able to identify the $1237 area as a high probability target for the near term. (TSLA) ended up striking $1243 and then pulled back. On November 4th we advised our members that the $920 - $990 area would be the most likely area for this pullback to complete. Thus far, $978 has been the low in price. (This possible scenario was also updated in the article published on October 30th here on Seeking Alpha - Tesla: What Comes After Ludicrous Mode?)
What should happen next? This is where the principle of self-similarity shines brightly in our analysis. It means that advances in price will be in 5 wave structures and declines or corrections will be in 3 waves. This structure will be visible at all time intervals. It also means that as the structure of price fills out at larger degrees, the pullbacks will become bigger and will typically take more time.
The next high we anticipate in (TSLA) is at the $1400 level. There are two near term paths that we are projecting. You can see the blue vs. red on the 1 hour chart in this article. Once that level is struck, a pullback to as deep as $575 could unfold and will probably take several months to fulfill. We’ll take this one step at a time though and let the future structure of price dictate our actions.
(TSLA) should not see significantly below the $865 level for us to maintain this current projection. Our primary scenario is that the corrective low has already been seen for wave 4 as shown. But, we must respect the possibility of the wider corrective move in illustrated in red.
Please allow me to conclude this brief update with some further thoughts as to why we use this methodology as our primary analysis tool. Again, it’s with questions. Have you observed the markets to be logical in their nature and function? How many times have you personally seen a stock or even the entire market go beyond what is reasonable from a fundamental standpoint? Many many many times.
Have you ever discovered the reason why this is the case? The underlying cause is that markets are non-linear, dynamic and fluid in their nature. They are also emotional and irrational. So, if that is the landscape on which we operate, why would we attempt to forcefully overlay logic to such a place?
I would like to take this opportunity to remind you that we provide our perspective by ranking probabilistic market movements based upon the structure of the market price action. And, if we maintain a certain primary perspective as to how the market will move next, and the market breaks that pattern, it clearly tells us that we were wrong in our initial assessment. But here is the most important part of the analysis: We also provide you with an alternative perspective at the same time we provide you with our primary expectation, and let you know when to adopt that alternative perspective before it happens.
As I have said many times before, this is no different than if an army general were to draw up his primary battle plans, and, at the same time, also draws up a contingency plan in the event that his initial battle plans do not work in his favor. It's simply the manner in which the general prepares for battle. We prepare for market battle in the same manner.
There are many ways to analyze and track stocks and the market they form. Some are more consistent than others. For us, this method has proved the most reliable and keeps on us the right side of the trade much more often than not. Nothing is perfect in this world, but for those looking to open their eyes to a new universe of trading and investing, why not consider studying this further? It may just be one of the most illuminating projects you undertake.