Tesla: Looking For A 180 From $180
 By
Levi
By
Levi
By Levi at StockWaves; Produced with Avi Gilburt
The clouds have parted and we have a bright, shining opportunity before us. Will this key low at $180 hold? Does (TSLA) pull a 180 degree about face from this level? We’re going to get into a bit more of the theory behind our methodology. Also, we’ll talk about how we specifically zeroed in on the $180 level in the days before the last earnings report. Plus, more importantly, what is the forward-looking scenario? Where will it be further confirmed? Where is it wrong? Buckle up, because here we go!
Here is the prior article that we published 5 weeks ago. To sum up what we were expecting then, the chart was telling us that the $260 - $270 level was important resistance. Thereafter, price should pull back and seek support at the $225 level. Should price break below that region, then a deeper correction would unfold.
Price did find a key high at $265 and we can all see where it went since then, a swift swoon to $180. This is the exact level within six cents where we projected for our members in the last few days before the earnings announcement on the 24th of this month, after the bell. TSLA was trading at the $215 level during those posts back on the 22nd. It was below our key support. The structure of price was pointing to multiple confluences in price that stood out at precisely the $180 level. Voodoo, you say?
Actually it’s mathematics that help measure and project human behavior. Poppycock! Before you simply dismiss out of hand the possibility that human behavioral patterns can be tracked and traced out into likely future probabilities, please take a few brief moments and read what Avi Gilburt has written on the subject. Start here with Part 1 of the 6-part series entitled, "This Analysis Will Change The Way You Invest Forever.”
Let’s delve into this a bit deeper. We will assume that the reader now has a basic understanding of how we apply Elliott Wave Theory in our analysis.
Lyn Alden Says Tesla Is Best Analyzed Via Sentiment
This is a stance that Lyn has held for some time now. She has commented on several occasions that TSLA trades predominantly "on sentiment and technicals.” Our lead fundamental analyst does not arrive lightly at that conclusion. For years now, TSLA stock has defied gravity and the logic of most. However, since when can logic and reason be successfully applied to an emotional environment?
We use sentiment, i.e. human behavior, to analyze which path is most likely going forward. It manifests itself via patterns. We tend to call this the structure of price. How a stock or an index arrives at price targets is important. It is indeed this very structure that tells us what is probable thereafter.
The power of this method is that the patterns exhibit self-similarity at all degrees of the structure on the chart. Another way of expressing this same sentence is that the markets are fractal in nature. These structure will repeat over and again. Using the prior context, we can then project forward a likely path and a possible alternative.
OK, enough theory. Let’s put this into practice.
Sentiment Speaks Via The TSLA Chart
Avi uses the phrase “Sentiment Speaks” as the title to his frequent articles that analyze the S&P Index. Here is his latest from Monday of this week. Now, using the very same methodology, we will show two possible paths for TSLA and how we will differentiate the most probable from the alternative.
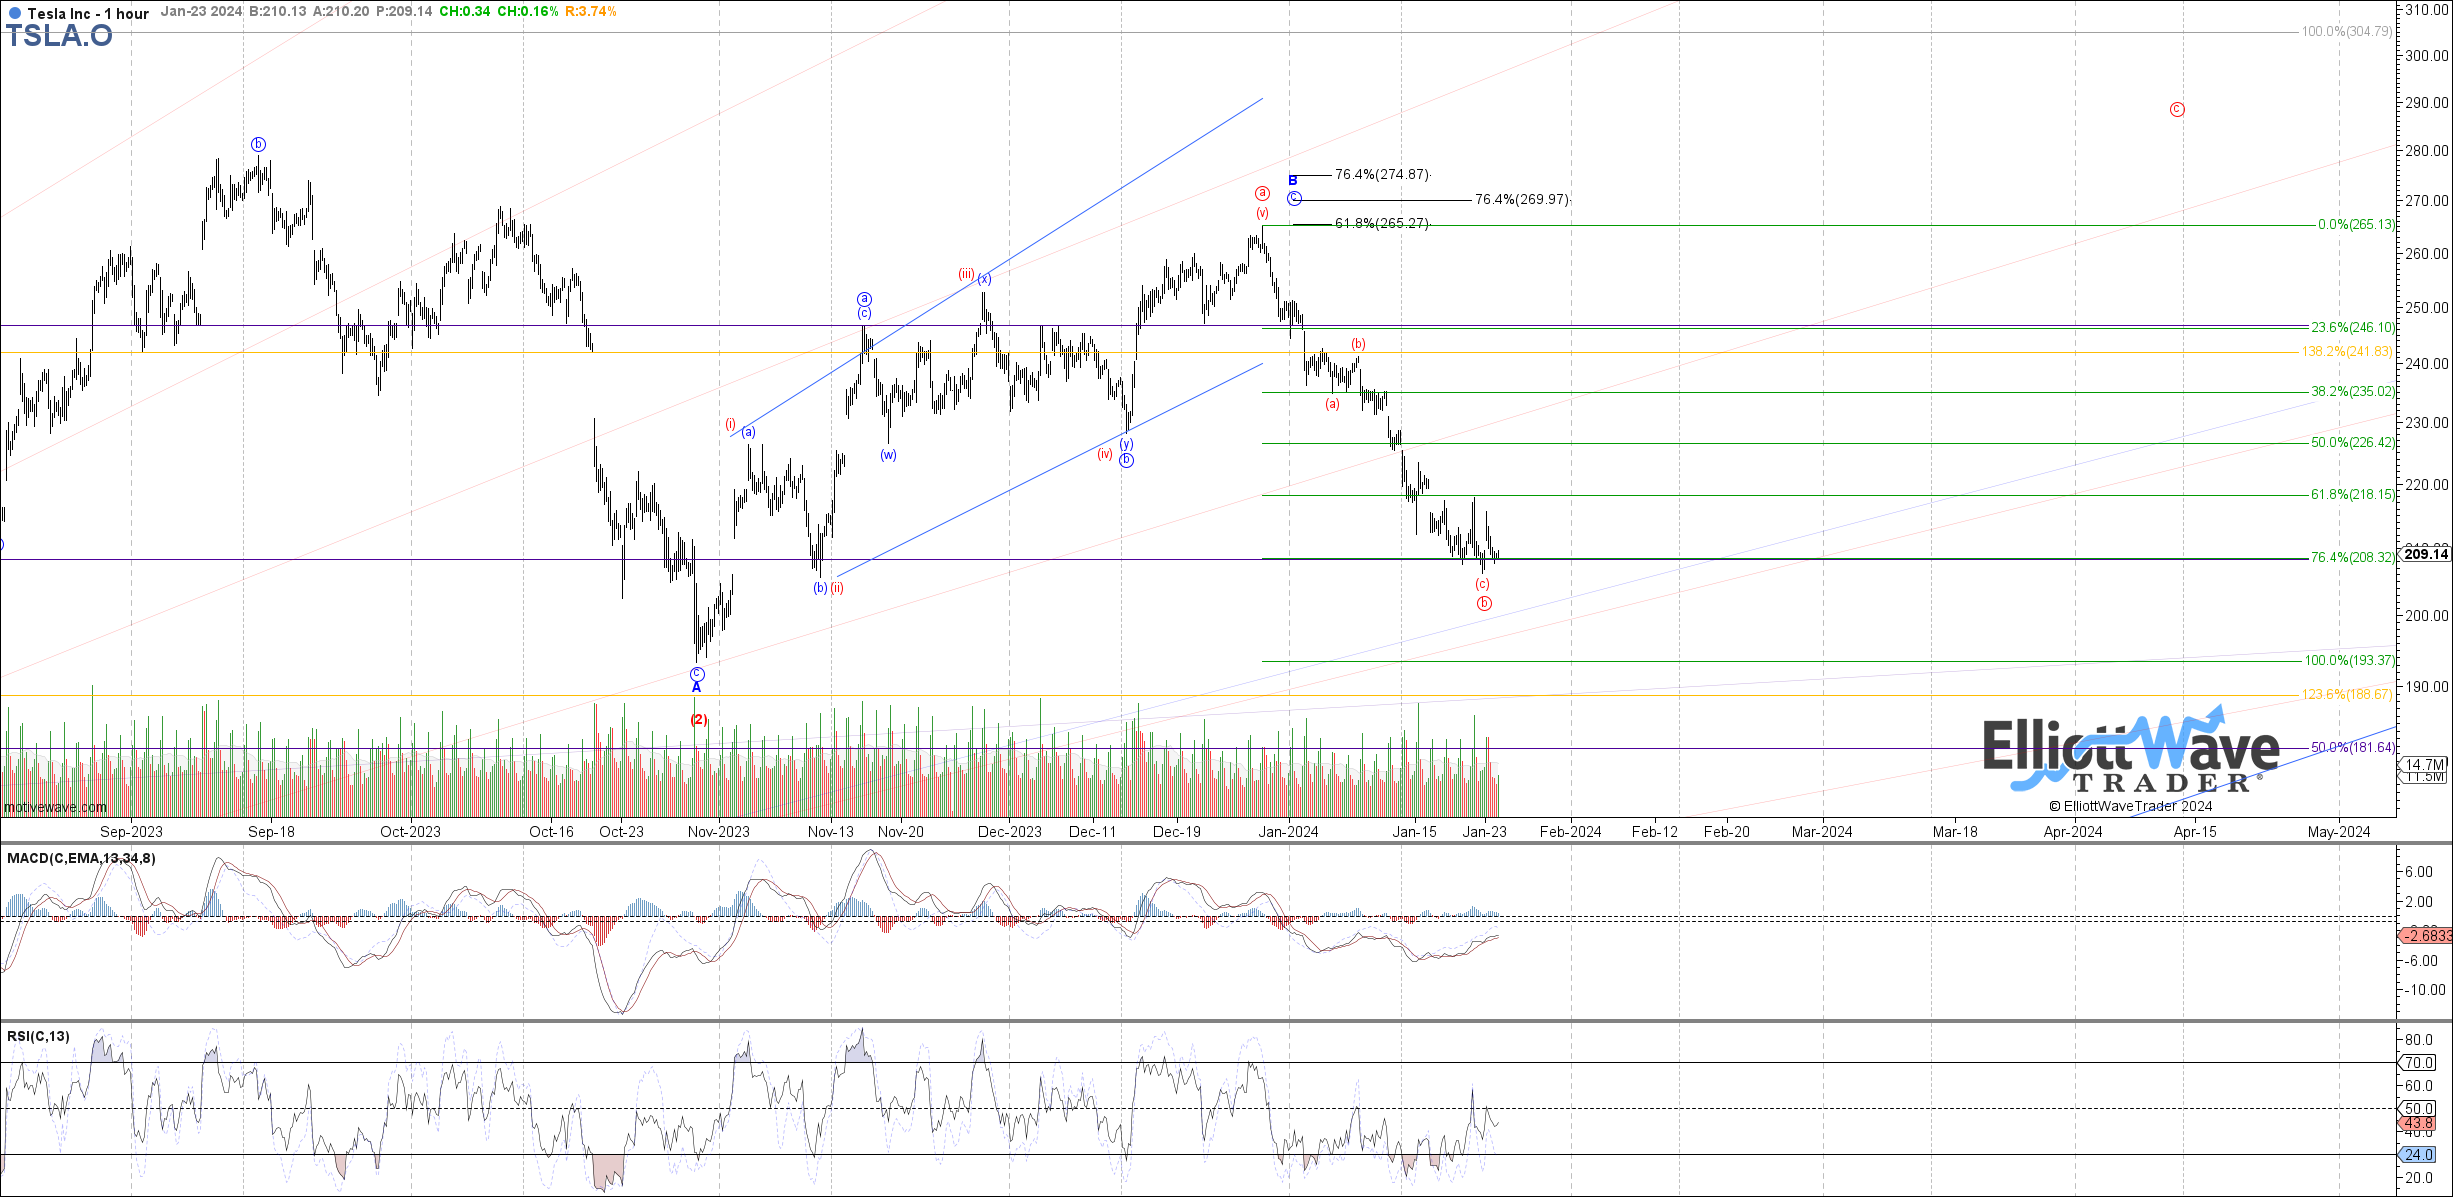
Note in this chart that Garrett Patten is showing the possibility of TSLA finding a low in this region, perhaps from the $180 level. How would we better confirm this? Note that there is a Red ‘c’ wave projected overhead. C waves are nearly always 5 waves in their structure. What’s more, we don’t recall ever having observed a ‘c’ wave that was not 5 waves. How does this help us?
Should TSLA be embarking on a ‘c’ wave up here, the initial move should be a smaller 5-wave rally. Thereafter, price should retrace in corrective fashion and a 3-wave structure that holds above the $180 low. That is the highest probability and lowest risk type of entry in the current situation. A trader would enter on a pullback and place their initial stop at the $180 low.
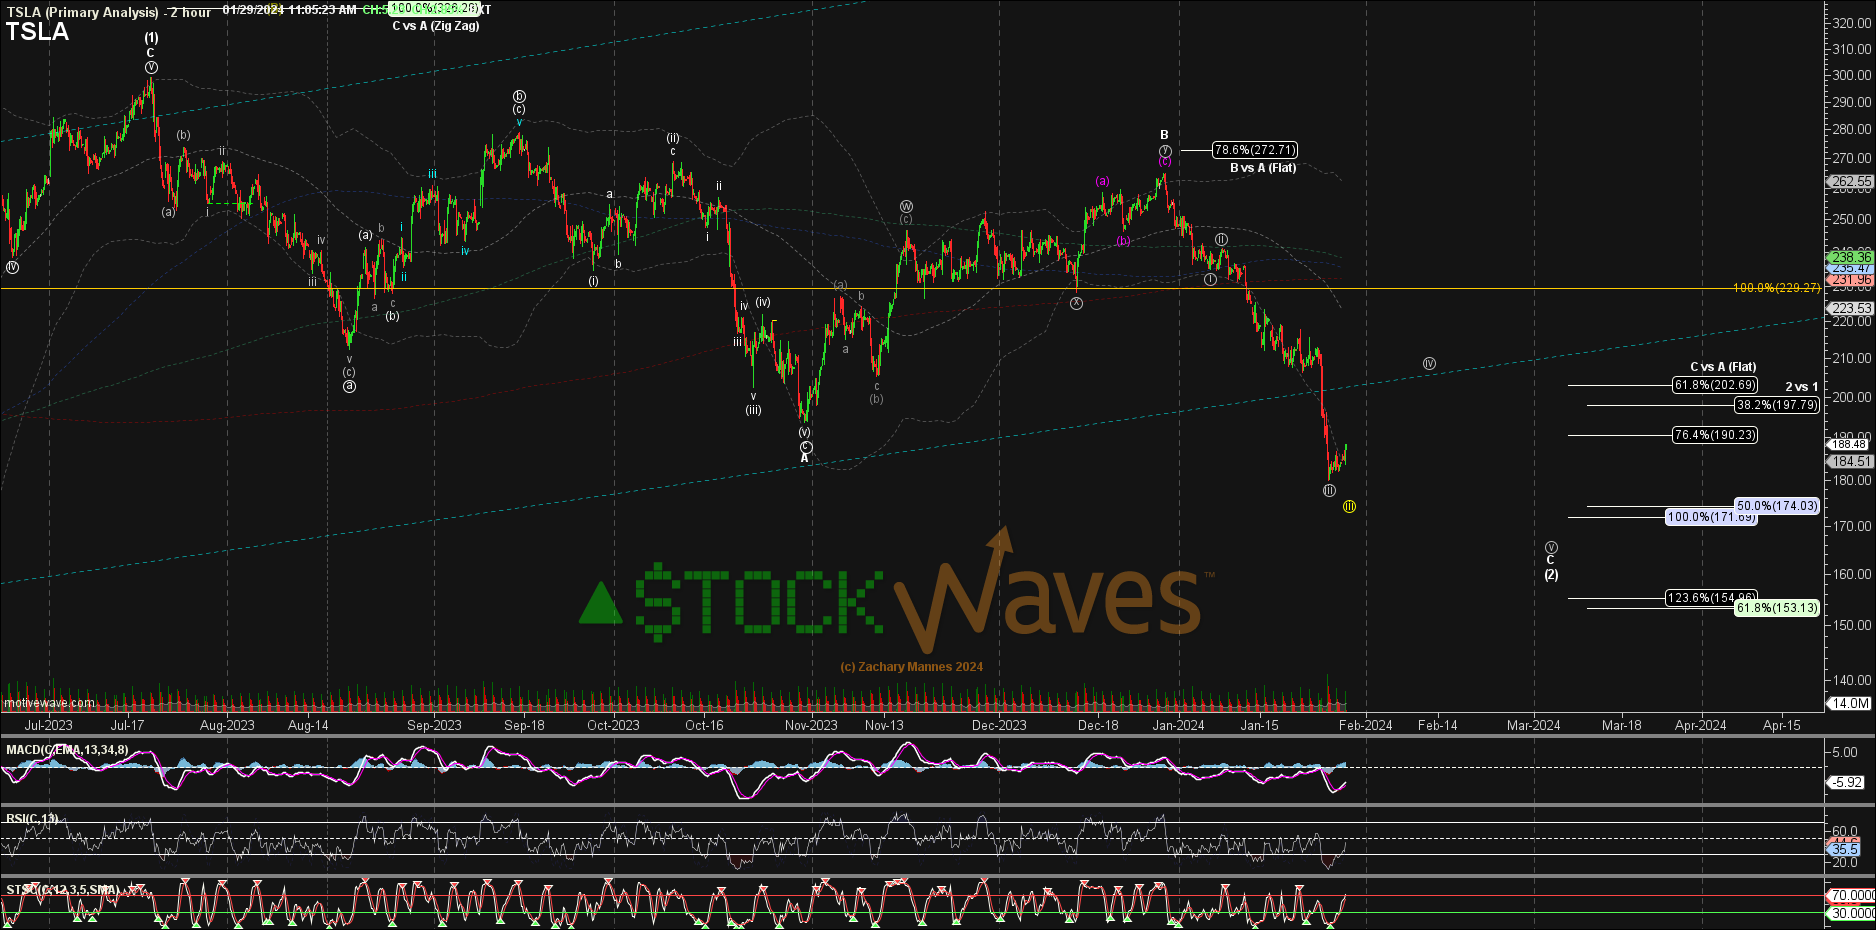
Here we can see that Zac Mannes is projecting the possibility that price will bounce correctively to perhaps the $200 - $210 level and turn down for a final low in the $171 area.
Suppose that someone has already placed a trade at the $180 area and is now managing that position. Should price bounce in a corrective type 3-wave structure and not take out resistance at the $200 - $210 zone, then a protective trailing stop would be advised so as to not turn a winner into a losing trade.
However, if price takes out that resistance, especially with a 5-wave structure, it would lend more credence to the potential path of a ‘C’ wave higher. How high? That will depend on the first smaller, lesser degree 5 waves up. Remember the fractal nature of markets.
Wait - You Guys Just Project All These Scenarios To Always Be Right?
Please keep in mind that markets are dynamic, fluid and non-linear in nature. We will start with multiple possibilities and then whittle them down to one or two likely paths with key levels that tell us which is which.
In this particular case, the structure of price on the TSLA chart is telling us that $180 could be an important low. But we won’t be more convinced of that until we see an initial 5 waves up. Then resistance will yet loom overhead. Under $180 again and we will turn to the $171 area and finally $153 as supports. Above $210 on 5 waves up will project much higher for the first part of 2024.
The Fibonacci Queen Weighs In On Tesla
Carolyn Boroden is a world-renowned technical analyst and author of "Fibonacci Trading - How To Master The Time And Price Advantage," published by McGraw-Hill in early 2008. She has been involved in the trading industry since 1978, starting on the floor of the Chicago Mercantile Exchange. She is often featured on the "Off The Charts" segment of CNBC's Mad Money with Jim Cramer. She is also a lead analyst with her own trading room for members of Elliott Wave Trader.
Here is her latest post from earlier Monday the 29th:
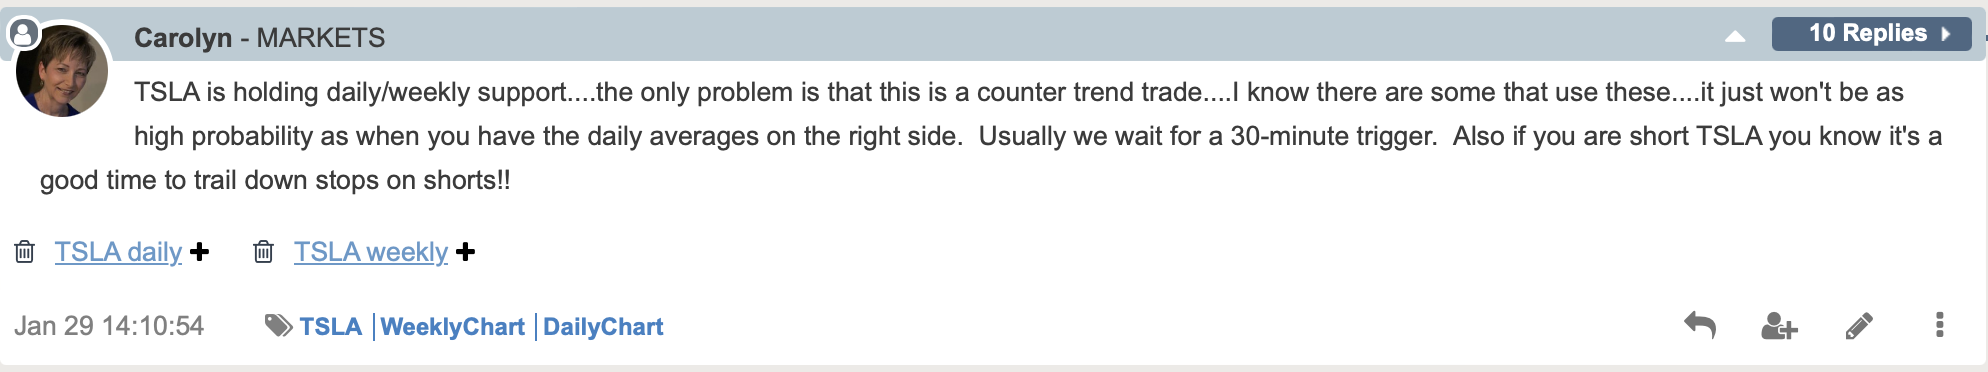
Many times, Carolyn’s work will complement our own methodology.
Conclusion
Our methodology is pointing to a low-risk, high-reward setup for TSLA. Not all paths will play out as illustrated. We view the markets from a probabilistic standpoint. But at the same time, we have specific levels to indicate when it's time to step aside or even change our stance and shift our weight.
There are many ways to analyze and track stocks and the market they form. Some are more consistent than others. For us, this method has proved the most reliable and keeps us on the right side of the trade much more often than not. Nothing is perfect in this world, but for those looking to open their eyes to a new universe of trading and investing, why not consider studying this further? It may just be one of the most illuminating projects you undertake.
