Tesla Is the Market's Rorschach Test
 By
Levi
By
Levi
Bulls and bears look at the same chart and see entirely different companies. That disagreement is not noise — it is the signal.
Show ten investors a Tesla chart and you will get ten different companies described back to you.
One sees a generational innovator reshaping transportation, energy, and artificial intelligence simultaneously. Another sees a meme stock with a cult following and a valuation untethered from any recognizable financial gravity. A third sees both — and cannot decide which version to believe on any given Tuesday.
This is not a debate that gets resolved by earnings reports.
Tesla has always occupied a strange position in the market — a stock where fundamentals are almost beside the point in determining the next move. Even analysts who specialize in valuation models will privately acknowledge that traditional metrics do not explain Tesla's price behavior with any consistency. The stock does what it does. The explanations arrive afterward.
That is not a criticism. It is a description of how crowd psychology expresses itself through a stock that has become something larger than an equity.
Tesla is a canvas.
What investors project onto it reveals far more about their own assumptions than it does about the company's balance sheet.
Consider the range of reactions to any single piece of Tesla news. A robotaxi announcement produces euphoria in one camp and eye-rolling dismissal in another — using the same information, consumed at the same moment. An earnings miss that would crater most stocks barely registers. A tweet moves the price more than a quarterly filing.
These are not the characteristics of a stock driven by discounted cash flows. These are the characteristics of a stock driven by emotion — and the oscillation between confidence and doubt is precisely what makes its price structure so readable.
Here is why that matters for anyone trying to navigate it.
When conviction runs high in one direction, price extends. When that conviction exhausts itself, price corrects. The movement between those two states is not random. It follows recognizable patterns that reflect the crowd's emotional cycle — from enthusiasm to overconfidence to doubt to capitulation and back again.
The wider the emotional range, the more readable the structure can become.
And no stock in the market carries a wider emotional range than Tesla.
This is precisely what makes it readable through the lens of Elliott Wave Theory — a framework designed not to predict what a company will do, but to identify where the crowd stands in its own psychological cycle. The structure of price becomes a map of collective conviction and collective doubt, measured not in earnings per share but in the amplitude of human belief.
Tesla's chart does not resolve the Rorschach test. It does not tell you whether the bulls or bears are correct about the company.
What it does — with remarkable consistency — is tell you which side currently holds the psychological momentum, and how far that momentum is likely to carry before the other side takes over.
That is what the structure is showing now.
Structure Reveals the Signal
Let’s have a look at Zac’s latest chart.
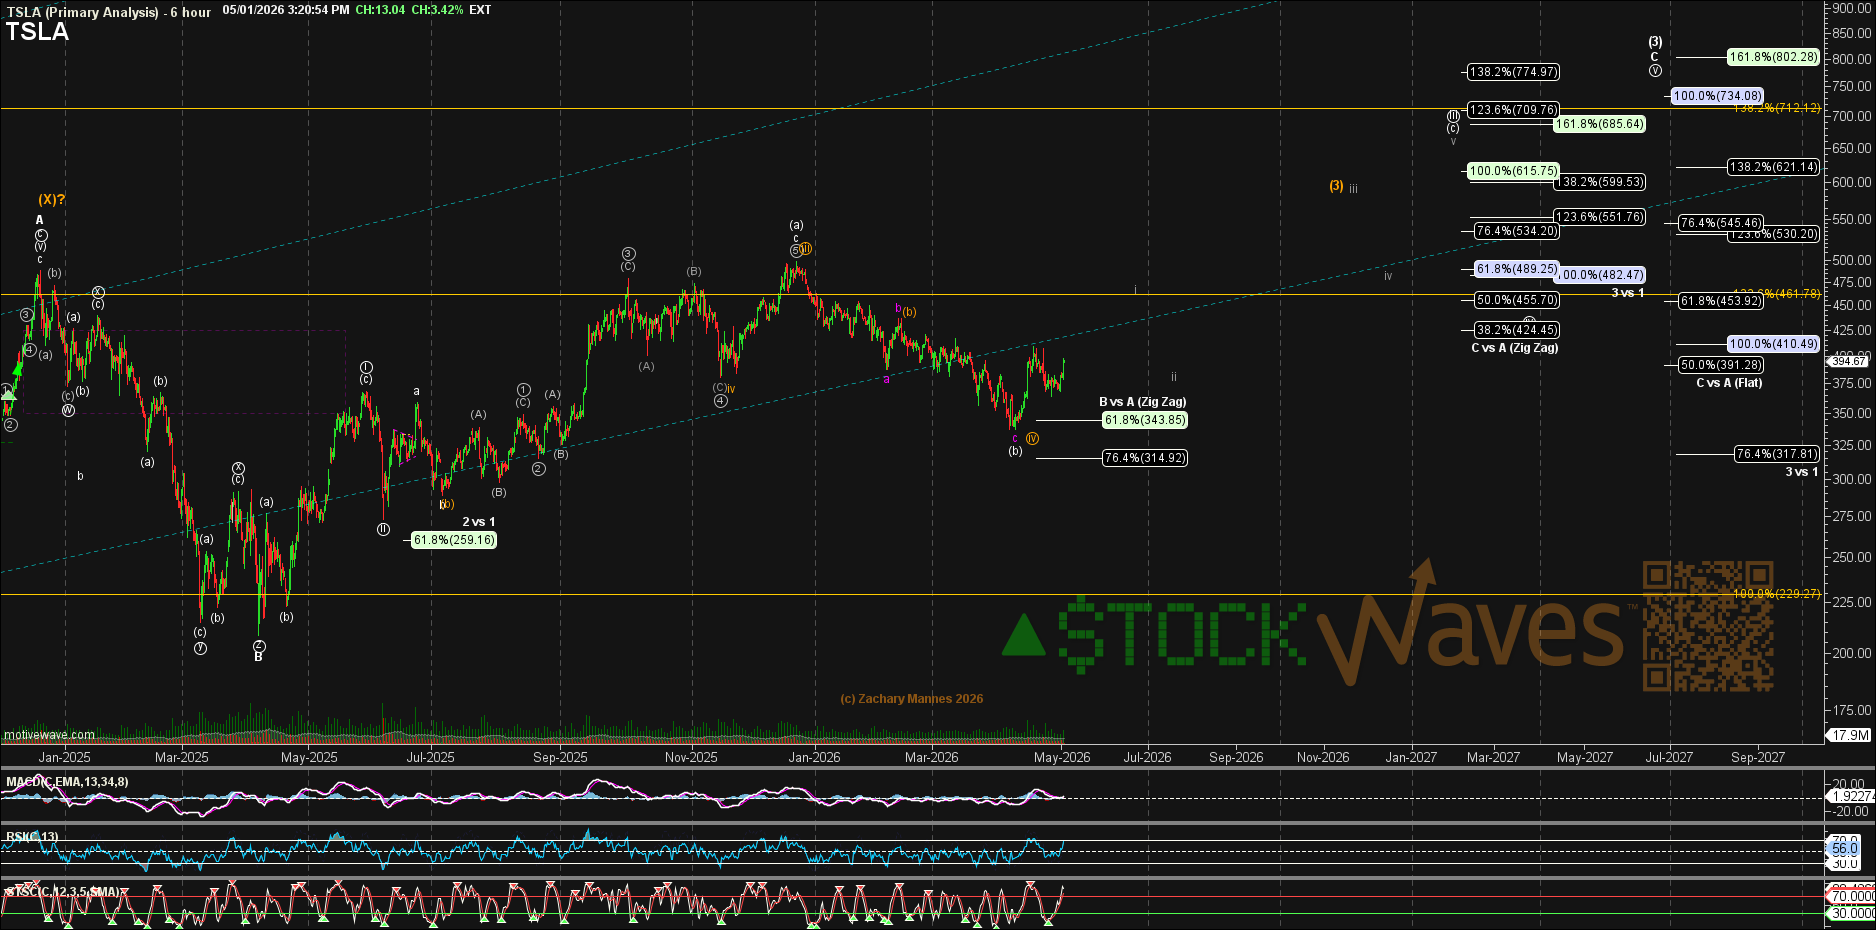
The current setup illustrates the probable path as higher in the near term. Note how price is likely in the C wave of the larger Intermediate Wave (3). This C wave should evolve as five waves. The context suggests price may now be entering the heart of that move.
The parameters provided on March 23 remain valid.
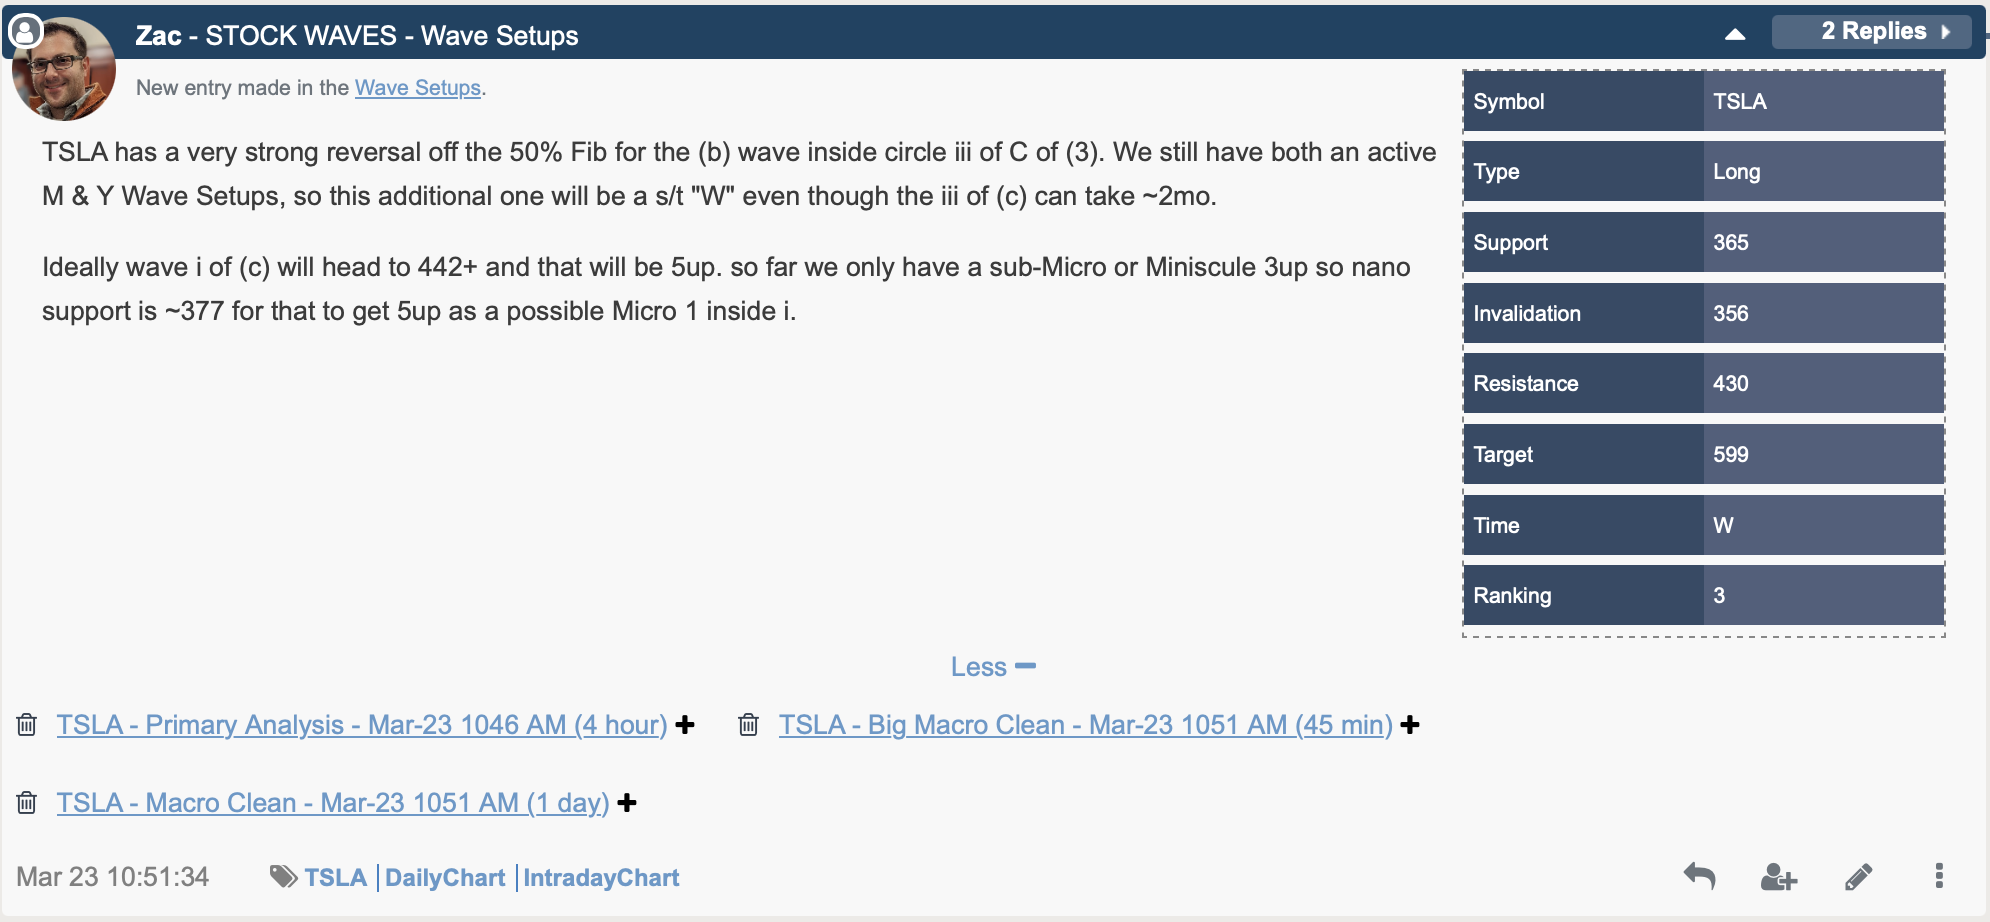
Support sits at $365, invalidation at $356, resistance at $430, and the potential target is $599.
The Practical Takeaway
The point is not to resolve the debate around Tesla.
It is to recognize where the market stands within it.
When the structure is expanding, conviction tends to be rewarded. Moves extend, pullbacks are absorbed, and participation broadens as the prevailing narrative gains strength.
When the structure shifts into a corrective phase, the experience changes. Rallies can still occur, sometimes sharply, but they tend to overlap, lose follow-through more quickly, and create uncertainty about whether the larger trend has resumed.
That distinction matters more than any single headline.
At present, the longer-term structure remains constructive, while the shorter-term setup suggests the market may be entering the most directional phase of the current advance.
For those navigating it, the task is to recognize the phase before reacting to the move.
Because in a stock defined by belief, the most important signals often emerge not from what is said, but from how the market responds.
Tesla will remain a Rorschach test. The chart simply tells us which interpretation is winning.
