Tesla: How We Nailed The Last 4 Turns And What’s Next
 By
Levi
By
Levi
By Levi at Elliott Wave Trader; Produced with Avi Gilburt
Now this is not chest-beating braggadocio. We simply want to share the specific and verifiable results that this investing methodology has reaped. And, please keep in mind that this is what we do day in and day out, week after week, for some thirteen years now via analysis made available to the public. In a structure such as what presents on the (TSLA) chart, having nailed down the pivotal moments over the past several months, it bolsters the confidence in the larger framework.
We will show this larger formation below and then zoom in to see what the next key levels are. First, please review with us the last key turning points and what they likely lead to thereafter.
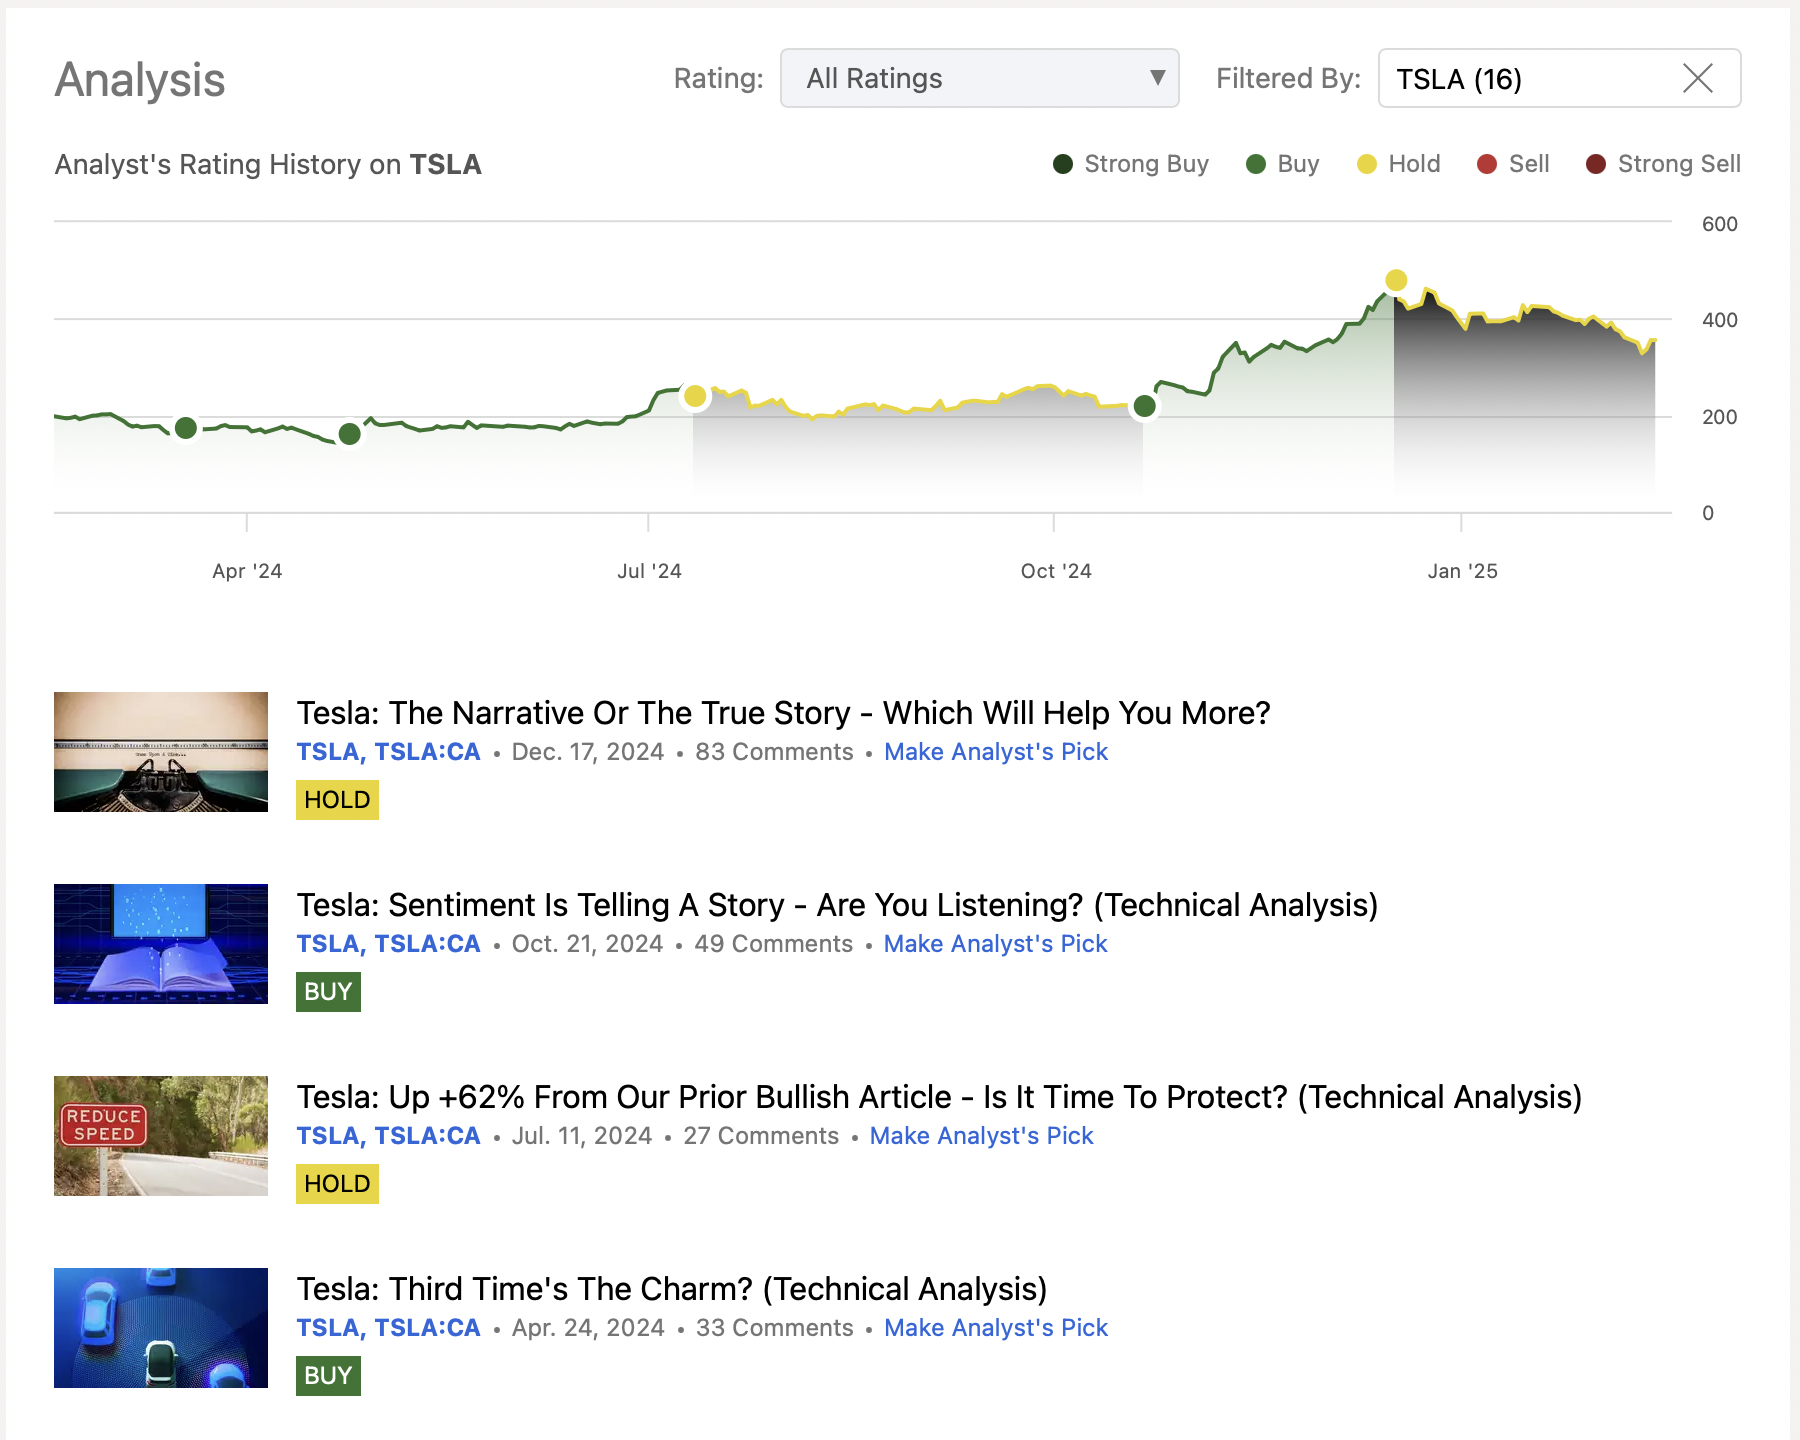
(Source: Seeking Alpha)
The last four articles shared with the readership have been showcasing different opportunities along the larger path. These waypoints have proved to be quite lucrative to those so inclined to trade the winds of change. We give our best efforts to provide timely updates to those that peruse these missives. Kindly keep in mind that our members will always receive the most current guidance via what the structure of price on the charts reveals to us.As well, inside the constructs of these articles available to the public, we are required to place a rating, as well as give wider variables and validation or invalidation levels, thereby loosening our focus slightly. It’s the nature of the beast and we recognize this as such.
All this to say that these pieces provided to the public are more to demonstrate the utility of this methodology and to share some trading and investing ideas based on it. The markets are lively in nature. They can and do change before our eyes like the shifting seas. However, the dynamic adaptability of our methodology allows us to be malleable to whatever we are given.
Have you ever wondered how this type of analysis works and why it is so effective? Well, I’m glad you asked that - allow a brief aside to provide a preamble to what we see taking place next in (TSLA).
Not Slapdash Nor Sophistry
Well, if it’s not something just haphazardly sketched on a chart, nor is it some sort of trickery, then what is this? Simply put, it is human behavior at the crowd level that manifests itself inside of clear mathematical patterns. Why does it happen that way? Frankly, it is easier to say that it is something that has been observed but not yet explained. Why do crowds behave the way that they do? One of the clearest examples of this was provided in some of the exhaustive research shared by Avi Gilburt in this article, “This Analysis Will Change The Way You Invest Forever - Part 2”. Here is a brief excerpt from that piece:
(If you would like to see the entire 6-part series, here is the last article which contains links to all)
“In moving onto studies conducted on individuals rather than stock market history, these will likely be of great interest to those who are seeking the truth about the human thought process.
In 1997, the Europhysics Letters published a study conducted by Caldarelli, Marsili and Zhang, in which subjects simulated trading currencies, however, there were no exogenous factors that were involved in potentially affecting the trading pattern. Their specific goal was to observe financial market psychology “in the absence of external factors.”
One of the noted findings was that the trading behavior of the participants were “very similar to that observed in the real economy, wherein the price distributions were based on Phi.”
In a different study conducted at the School of Social Sciences at the University of California, they came to the conclusion that “We may suppose that in a human being, there is a special algorithm for working with codes independent of particular objects.” Specifically, when subjects were asked to sort indistinguishable objects into two piles, their decision making within that process divided the objects into a 62/38 ratio. In other words, these individuals exhibited a Fibonacci tendency in their personal decision making.
Therefore, the more research that is being done into this issue, the more evidence we are uncovering that behavior and decision making within a herd and on an individual basis displays mathematically driven distributions based on Phi, which do not seem to be affected by exogenous events.
This basically means that mass decision making will move forward and move backward based upon mathematical relationships within their movements, and not based upon outside stimuli. This is the same mathematical basis with which nature is governed, as Elliott stated back in 1941.” - Avi Gilburt
What does this suggest in charts such as (TSLA)? That there is much more at work here than just the underlying fundamentals of the company. Let us show you what our analysis is telling us is most likely going forward from here.
A Proven Theory Applied In Real Life To The TSLA Chart
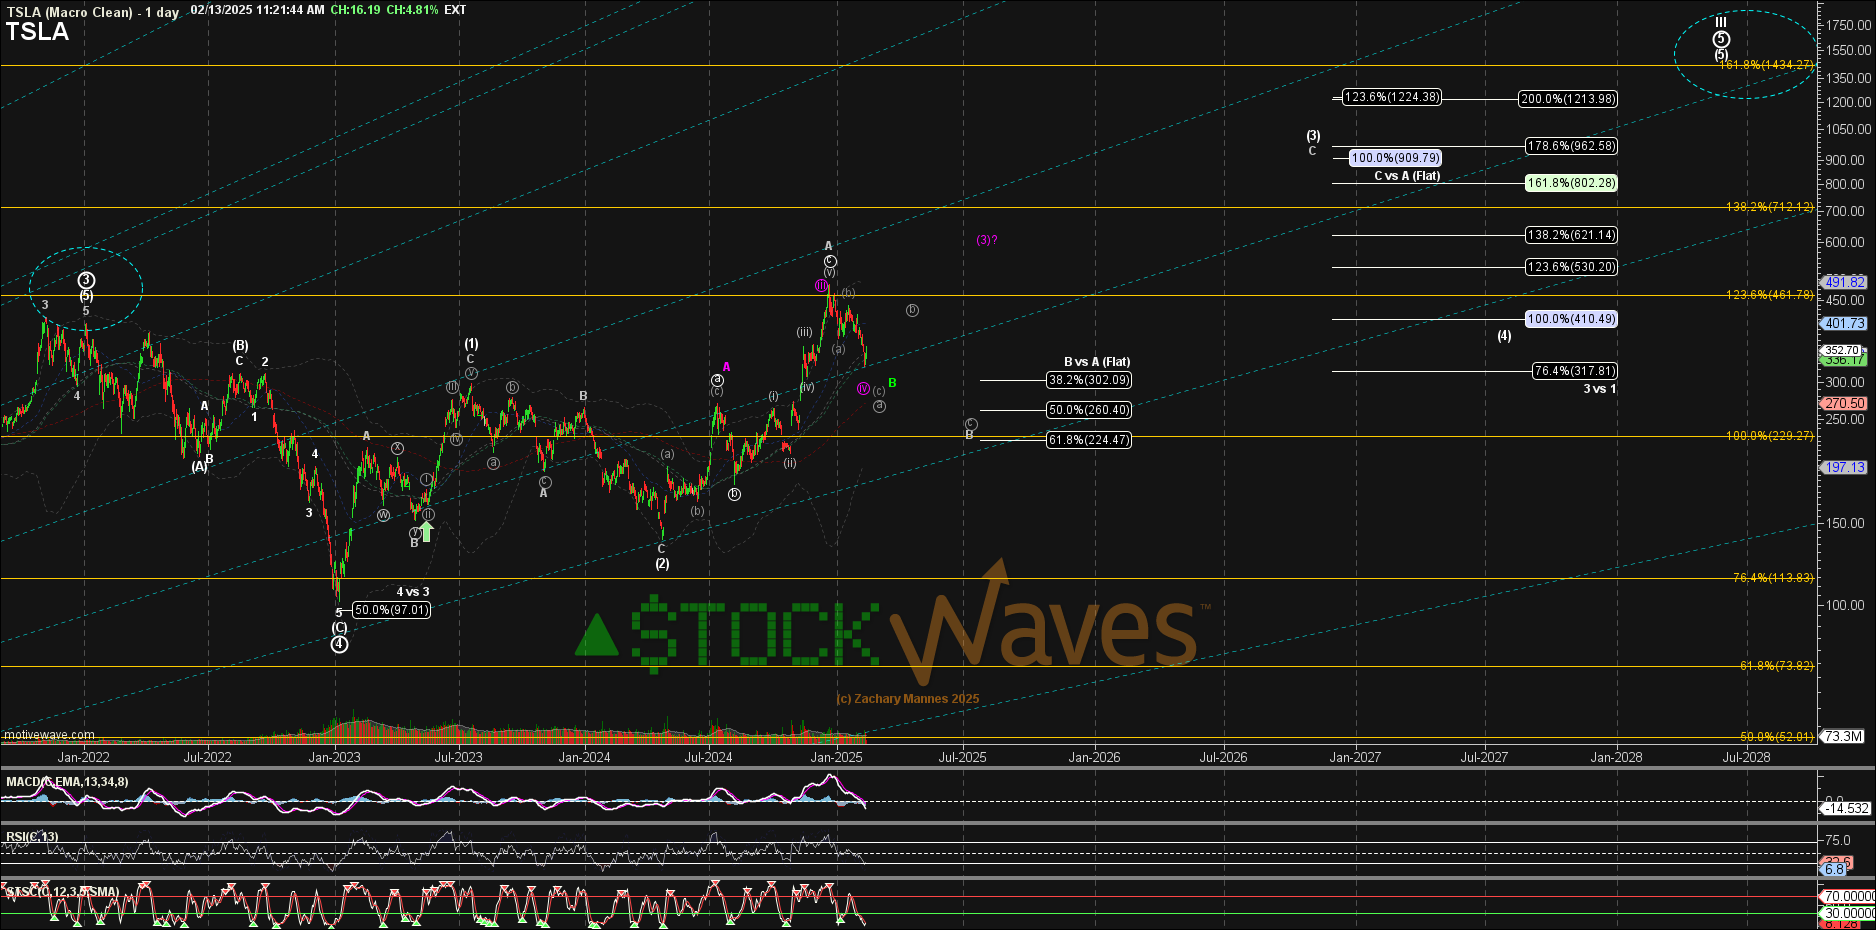
You can see that we anticipate the next larger move to be up. As well, that next high as projected may also be longer lasting than the prior peaks. It is the near term that has just a bit of cloudiness. We are not left in the fog without a beacon to guide us though. Here is the near term structure and the key levels to watch.
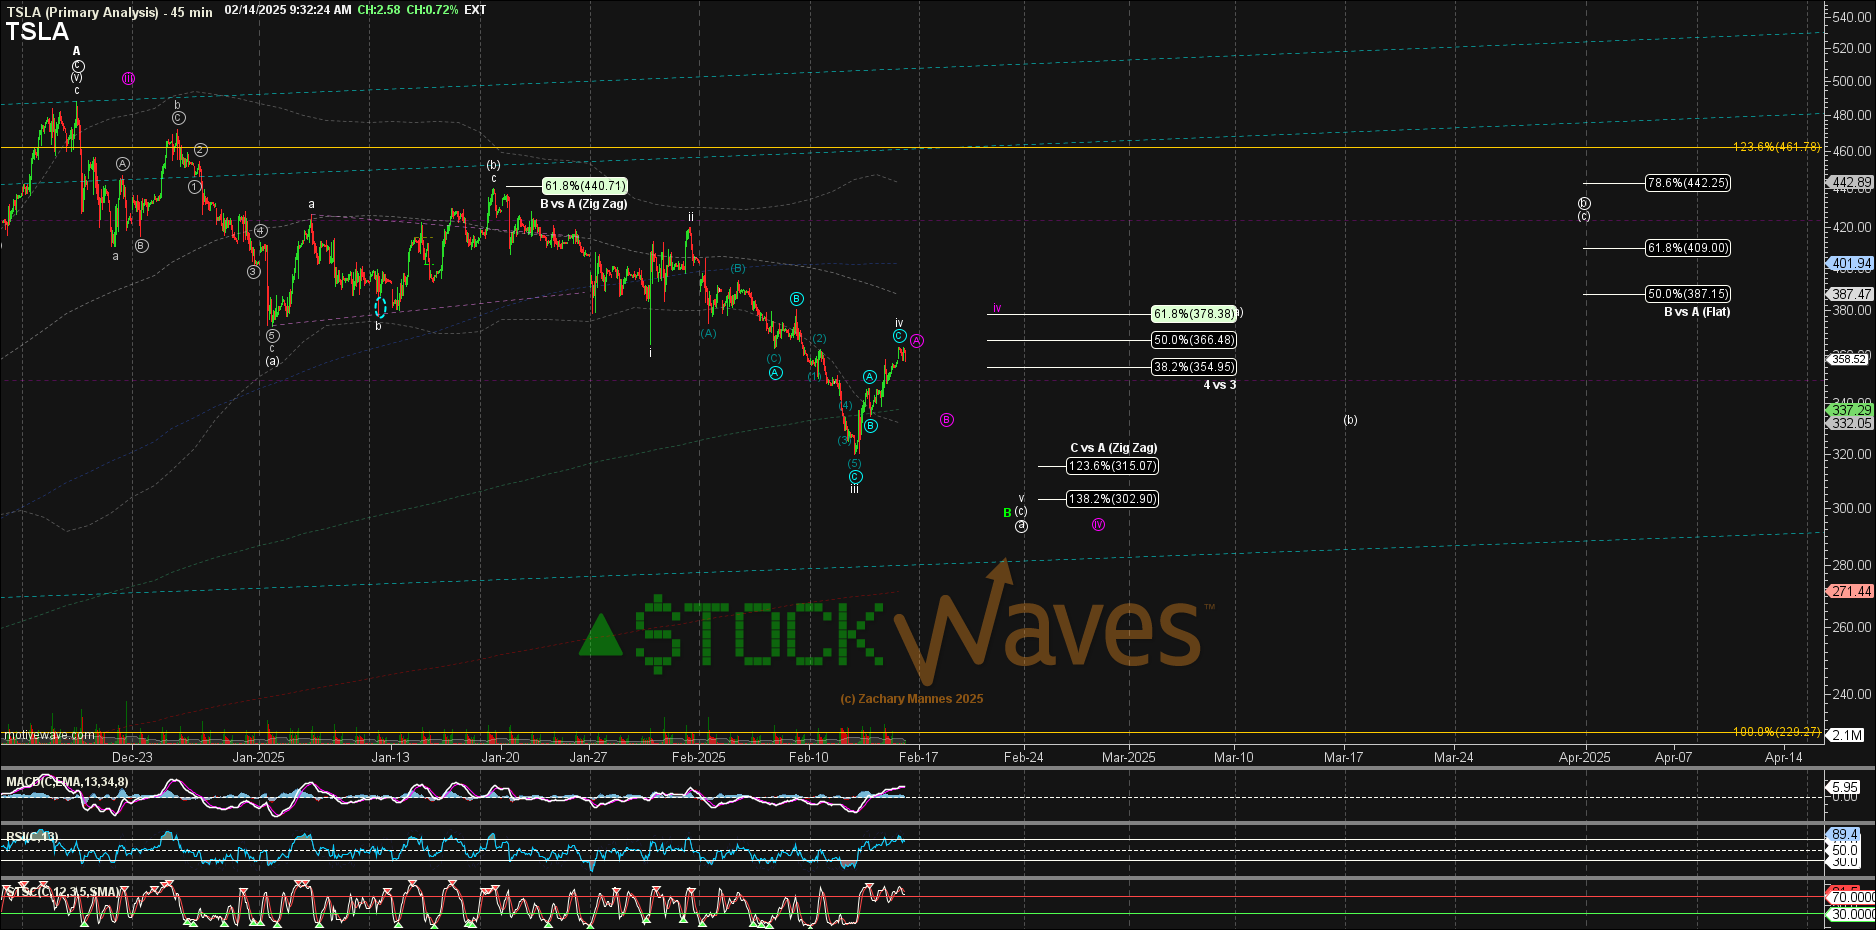
Note that Zac is seeing probabilities for a move slightly lower for the termination of this current corrective segment. The $303 - $315 region may yet beckon. That would be an area where one might be more aggressively bullish, if/when seen. Potentially price could see a move back to the $409 - $442 area thereafter, or higher.
Where might this near term bullish stance be invalidated? Should price move below $270 with follow through, then (TSLA) is more likely to see a deeper correction instead and we would reevaluate the structure as illustrated on the charts shared.
Now, could the framework also suggest something more bullish in the near term? Yes, it could, but price would need to prove itself with a more immediate move above the $380 area instead of the $303 - $315 region. Should that take place then it becomes more probable that the low struck at $326 is important and pivotal. As you can also see on the daily chart shared above, we anticipate price to yet move above the $500 level in a larger rally later on this year.
Fallacies And Folly
Over the years, Avi Gilburt has shared many of the widely believed axioms in the market which actually have turned out to be fallacies. One of the difficulties for the market participant that has invested time and energy into these broadly held beliefs is what is known as “sunk cost fallacy”. Said plainly, this fallacy is feeling that one has already spent so much of their resources, both material and even emotional, into their efforts that they simply cannot see the value or viability of setting aside their system and adopting another.
Well, we are not saying that you must completely discard what you are currently using. But, perhaps ask yourself, “Are these past 4 articles showing pivotal moments in (TSLA) just perchance projections, some sort of guesswork for the gullible?” We can assure you that they are solidly based on decades of observation and practical application. And, we have thousands of members that regularly employ this method of viewing the markets to provide guidance and light the way forward.
Conclusion
Yes, there are nuances to the analysis. Once familiar with our methodology, our members discover a powerful ally on their side to provide guidance and risk management in their trading/investing.
There are many ways to analyze and track stocks such as (TSLA) as well as the market they form. Some are more consistent than others. For us, this method has proved the most reliable and keeps us on the right side of the trade much more often than not. Nothing is perfect in this world, but for those looking to open their eyes to a new universe of trading and investing, why not consider studying this further? It may just be one of the most illuminating projects you undertake.
