Tesla: A Highly Charged Issue
 By
Levi
By
Levi
- The structure of price continues to point to one more high near term in TSLA, and it may perhaps be quite significant.
- In our last article we provided two likely scenarios. Our secondary scenario played out near exactly as drawn up. We explain why and how we tracked it.
- What is most likely to happen next and how deep could the following pullback reach?
We seem to be tracing out quite the odyssey along the way with (TSLA). It has been an adventure to say the least. If you have been following the evolution of our analysis and the three articles published thus far, there is likely one point that we can all agree on. There are few stocks in the market that evoke such a charged reaction from both sides as does Tesla. Why is this?
Let’s further this with a few more questions and then what we anticipate is most likely to happen next in the stock. Have you ever seen a company trade at such relatively lofty levels for an extended period of time as this one does? When one attempts to proffer standard fundamental analysis to Tesla’s financials, this summons all sorts of reasonings, logic and the like to disprove the trajectory of the stock. From the fundamental standpoint, it simply does not make sense.
However, whoever said correctly that the market and the stocks that make it up operate on logic and reason? Those that attempt to sally forth girded with fundamentals as their weapons of choice soon find themselves in full retreat. There is a simple reason to explain this. Markets do not operate via logic and reason.
Given this landscape on which we operate as traders and investors, what is the solution? Use human behavior to your advantage. Don’t fight against that nature. You would more likely succeed in holding back the tides of the seven seas than win in the struggle against human nature.
If we believe that Tesla is being driven by human behavior and mass sentiment, then what is most likely to happen next? From the prior article posted on November 20, 2021, “Tesla: Preparing For Plaid Mode” (here), we described two likely scenarios.
The Blue scenario assumed that the low for what was marked as wave 4 of (5) of a larger Primary wave 3 was already in place. The Red scenario was also included. Why do we include two scenarios in our analysis? The main reason for this is that markets are fluid, dynamic and non-linear in nature. That simply means that human behavior and sentiment do not operate in a straight line. However, the larger structure of price does typically win out.
So, we were not sure whether Blue or Red would be the path for the corrective structure of wave 4. In our StockWaves posts one could easily follow the evolution and progressive development of our analysis. We had anticipated a low in the $920-$990 area and that could have been all of wave 4 or the circle ‘a’ of wave 4 (Red scenario). We quickly shifted to the Red scenario as the following subwave from the $978 low did not maintain a standard impulsive pattern.
This is the principle of self-similarity that manifests itself at all degrees of Elliott Wave analysis. It means that impulse waves in a rally will be 5 waves up and corrective structures of that same rally will be 3 waves. When the bounce from $978 did not create a 5 wave structure, we began to track the Red scenario and advised our members to watch for the $916 level with a stop at $865.
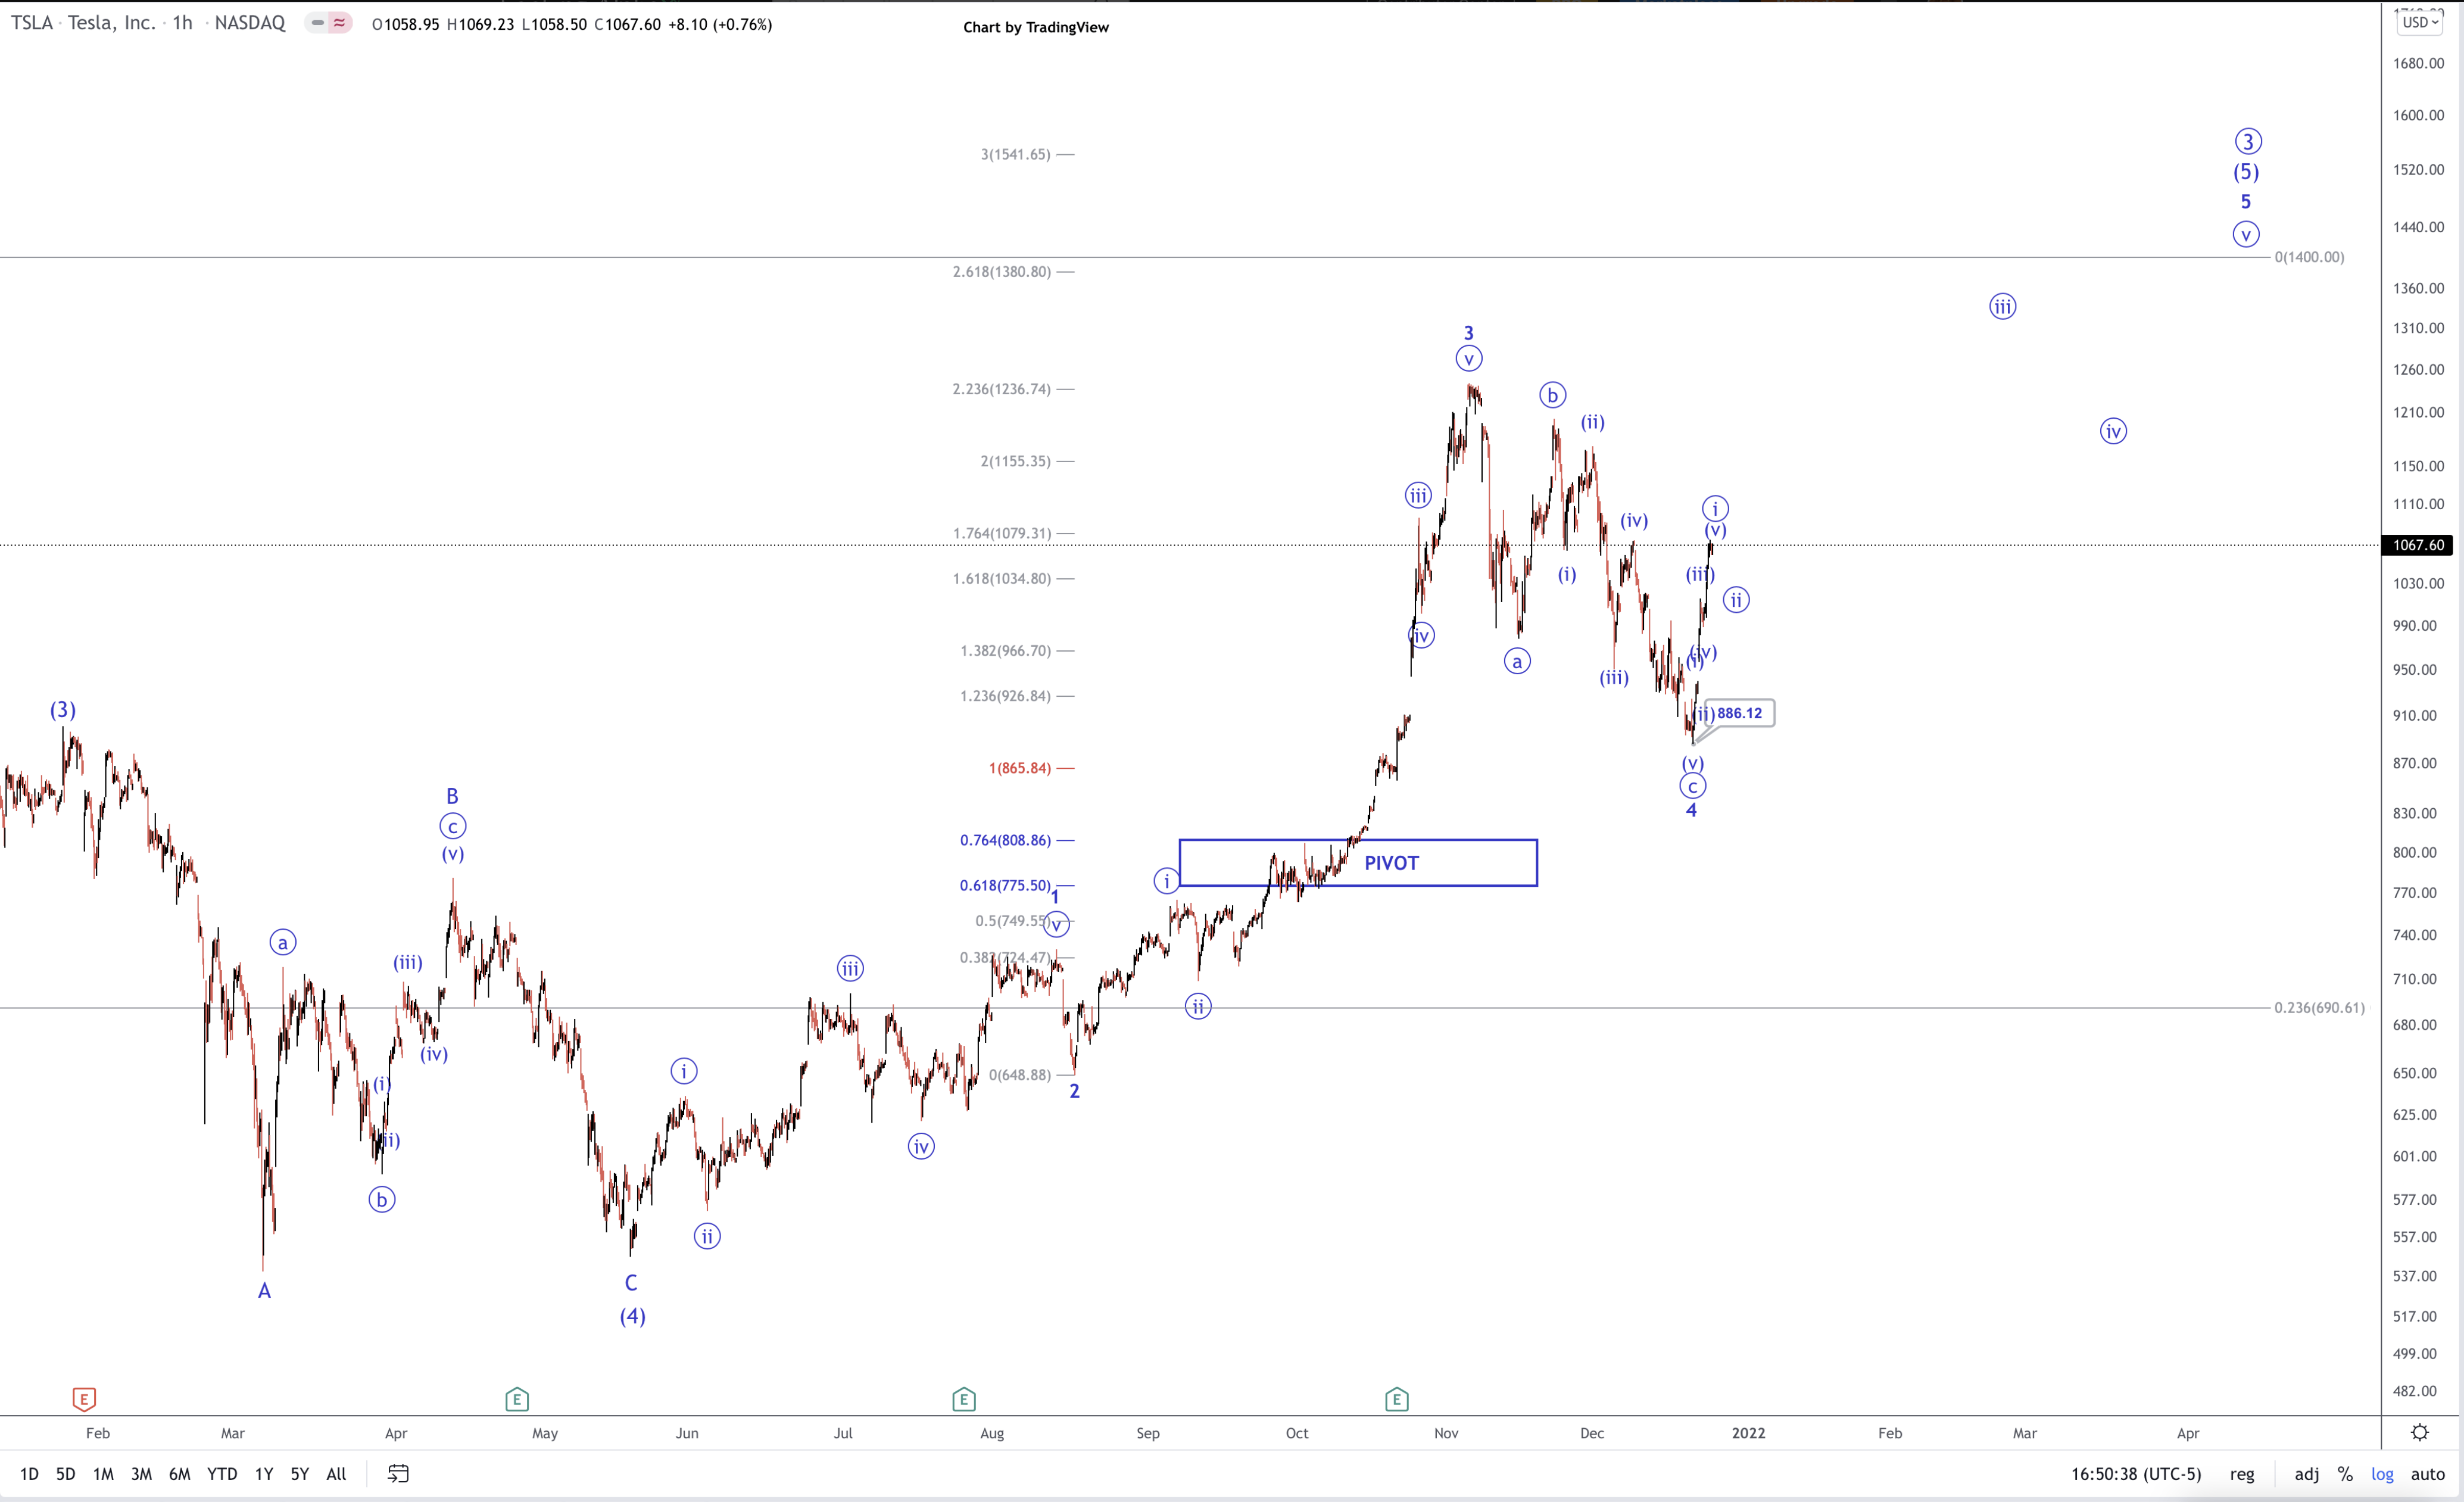
As you can see from the attached chart, the ultimate low was $886 and has since bounced some near $200 in price. We are tracking this current bounce as an impulsive move and wave circle ‘i’ of 5 of (5) of P3. What does this nomenclature signify?
If our view of this larger structure of price is true, then the next high struck may indeed be significant and pivotal for some time. It may be the culmination of several prior subwaves of varying degrees that are currently pointing to the $1400 level.
Here is what we need to see next. For as long as the stock remains below the $1133 level, we anticipate a slight consolidation/pullback here in what would be counted as wave circle ‘ii’. This could reach the $1000 level. From there another lesser degree 5 wave structure should unfold. Then, another smaller second wave pullback. This would be the highest probability spot for a long entry and the possible move to $1400.
As always, in a dynamic structure such as this, analysis will evolve and adapt to what price fills out in the chart. At any moment going forward from here, should price move materially below the $865 level before striking another higher high above $1243, then something else is playing out and we would change accordingly. This is not an attempt to put forth so many scenarios that one will end up being correct.
One way of comparing our analysis is that of a head coach of a football team and the staff that compose a game plan for their upcoming opponent. Many coaches even have 15 pre-scripted plays that they run at the beginning to see what the reaction of the opposing coach will be. As well, the game plan of each coach usually has provisos and possible adaptations given certain scenarios that can come up during the actual game.
The football coach must adapt to what is given during the real game. It simply is not possible to stubbornly stick to one specific path when the facts in front of you change. We do the same in our analysis. There is a likely path in the bigger picture. This is similar to it being likely that the superior team will come out victorious in any competition. We have our most likely scenario that we follow, but we also have an alternative to consider.
Being able to quickly adapt to changing landscapes is one of the hallmarks of Elliott Wave analysis, when correctly applied. I want you to imagine this possible scenario: let’s suppose Tesla does indeed fulfill its larger structure and that it finds an important pivotal high in price at the $1400 level. The potential decline from that next major high is as much as -$700. Yes, a possible -50% decline from that high. Please keep in mind that a scenario such as this is some three steps ahead of where we are now. We will continue to adapt and then project what we see as most likely for this and hundreds of other individual stocks in StockWaves.
Should a -50% decline unfold, one can only envision the reasons that will be conjured up from both the bull and bear side of the equation. However, in the end, Tesla will follow sentiment, as it always has.
I would like to take this opportunity to remind you that we provide our perspective by ranking probabilistic market movements based upon the structure of the market price action. And, if we maintain a certain primary perspective as to how the market will move next, and the market breaks that pattern, it clearly tells us that we were wrong in our initial assessment. But here is the most important part of the analysis: We also provide you with an alternative perspective at the same time we provide you with our primary expectation, and let you know when to adopt that alternative perspective before it happens.
There are many ways to analyze and track stocks and the market they form. Some are more consistent than others. For us, this method has proved the most reliable and keeps on us the right side of the trade much more often than not. Nothing is perfect in this world, but for those looking to open their eyes to a new universe of trading and investing, why not consider studying this further? It may just be one of the most illuminating projects you undertake.