Tempus AI: Trending Towards Profit And Beyond
 By
Levi
By
Levi
By Levi at Elliott Wave Trader; Produced with Avi Gilburt
There are many ways to place a valuation on a company that is yet to turn a profit. Some analysts will use discounted cash flow. Others blend that with the price-to-sales ratio. These will yield some sort of price estimate that may or may not align with what is happening in the marketplace. Why is that? The stock prices of pre-profit companies are based on what the crowds believe — or hope — they will be worth someday in the future. Isn’t that the true essence of sentiment?
Have you ever used sentiment to project a likely forward path for a stock? In many cases, it actually results in a more accurate forecast. Why is that? We want to use Tempus AI (TEM) as our case study. It is an ideal example of how we can use the collective behavior of the participating masses to help us, perhaps, gain an edge.
First, let’s see what we are dealing with at the company level and how their financials are trending. Then we’ll delve into the structure of price on the chart to listen to sentiment. I believe that you will find this quite useful, as it provides specific price levels that will either further confirm the bullish thesis or will tell us when we must adjust our stance.
Tempus Q2 Results From Last Week
Take a look at the highlights from their Q2 earnings conference call.
CHICAGO--(BUSINESS WIRE)--Aug. 8, 2025-- Tempus AI, Inc. (NASDAQ: TEM), a technology company leading the adoption of AI to advance precision medicine and patient care, today reported financial results for the quarter ended June 30, 2025.
- Revenue increased 89.6% year-over-year to $314.6 million in the second quarter
- Genomics revenue increased 115.3% year-over-year to $241.8 million on accelerating year-over-year volume growth in Oncology (26%) and Hereditary (32%) testing
- Data and services revenue increased 35.7% year-over-year to $72.8 million, led by Insights (data licensing), which grew 40.7% year-over-year
- Quarterly gross profit was $195.0 million, a 158.3% year-over-year increase
- Issued $750 million of 0.75% convertible senior notes that will drive significant interest expense and cash savings
- Increasing full year 2025 revenue guidance to $1.26 billion, along with positive adjusted EBITDA of $5 million, a $110 million improvement over 2024
“The business is performing well with revenues and margins growing faster than expected, contributing to our continued improvement in adjusted EBITDA on a year-over-year basis,” said Eric Lefkofsky, Founder and CEO of Tempus. “We saw significant re-acceleration of our clinical volumes which grew 30% in the quarter, as we delivered more than 212,000 NGS tests. Combined with our continued leadership in AI and progress toward building the largest foundation model in oncology, ‘we’re hitting our stride’ as we approach our 10th anniversary.”
[You can see the news release here: Tempus 2nd Quarter Results]
If you were to blend what they are reporting with what the chart is telling us, then things are trending in the right direction for a bullish outcome. But we need to define our risk versus reward and identify key prices in the journey to corroborate this.
Follow along as we describe the methodology for accomplishing said task and then the practical application overlaid onto the TEM chart.
The Basis For The Method
I want to share just a brief excerpt from one of Avi Gilburt’s articles that discusses the foundation for our method of analysis.
“There is significant evidence that behavior and decision making within a herd and on an individual basis displays mathematically driven distributions based on Phi.
This basically means that mass decision making will move forward and move backward based upon mathematical relationships within their movements. This is the same mathematical basis with which nature is governed. The same laws that were set in place for nature also govern man’s decision making en masse, and on an individual basis.” - Avi Gilburt
So what if an analyst was able to define a structure for such movements? Postulate further that this structure would repeat at all time frames - from small to large - and that the forms created would then be predictable. That is exactly what we do every day. And yes, there is just a bit more to the method than a few short paragraphs. But, if you wish, we have an Education section that will enlighten you to an entirely new way of viewing the markets as well as individual stocks.
Let us show you how we apply this very way of analysis to TEM.
How Current Sentiment Is Showing The Way Forward
TEM is one that we had been closely watching in StockWaves for many weeks. On August 1, the chart finally filled out the pattern that had been projected some time before. A Wave Setup was generated for members when price was in the mid-$50s.
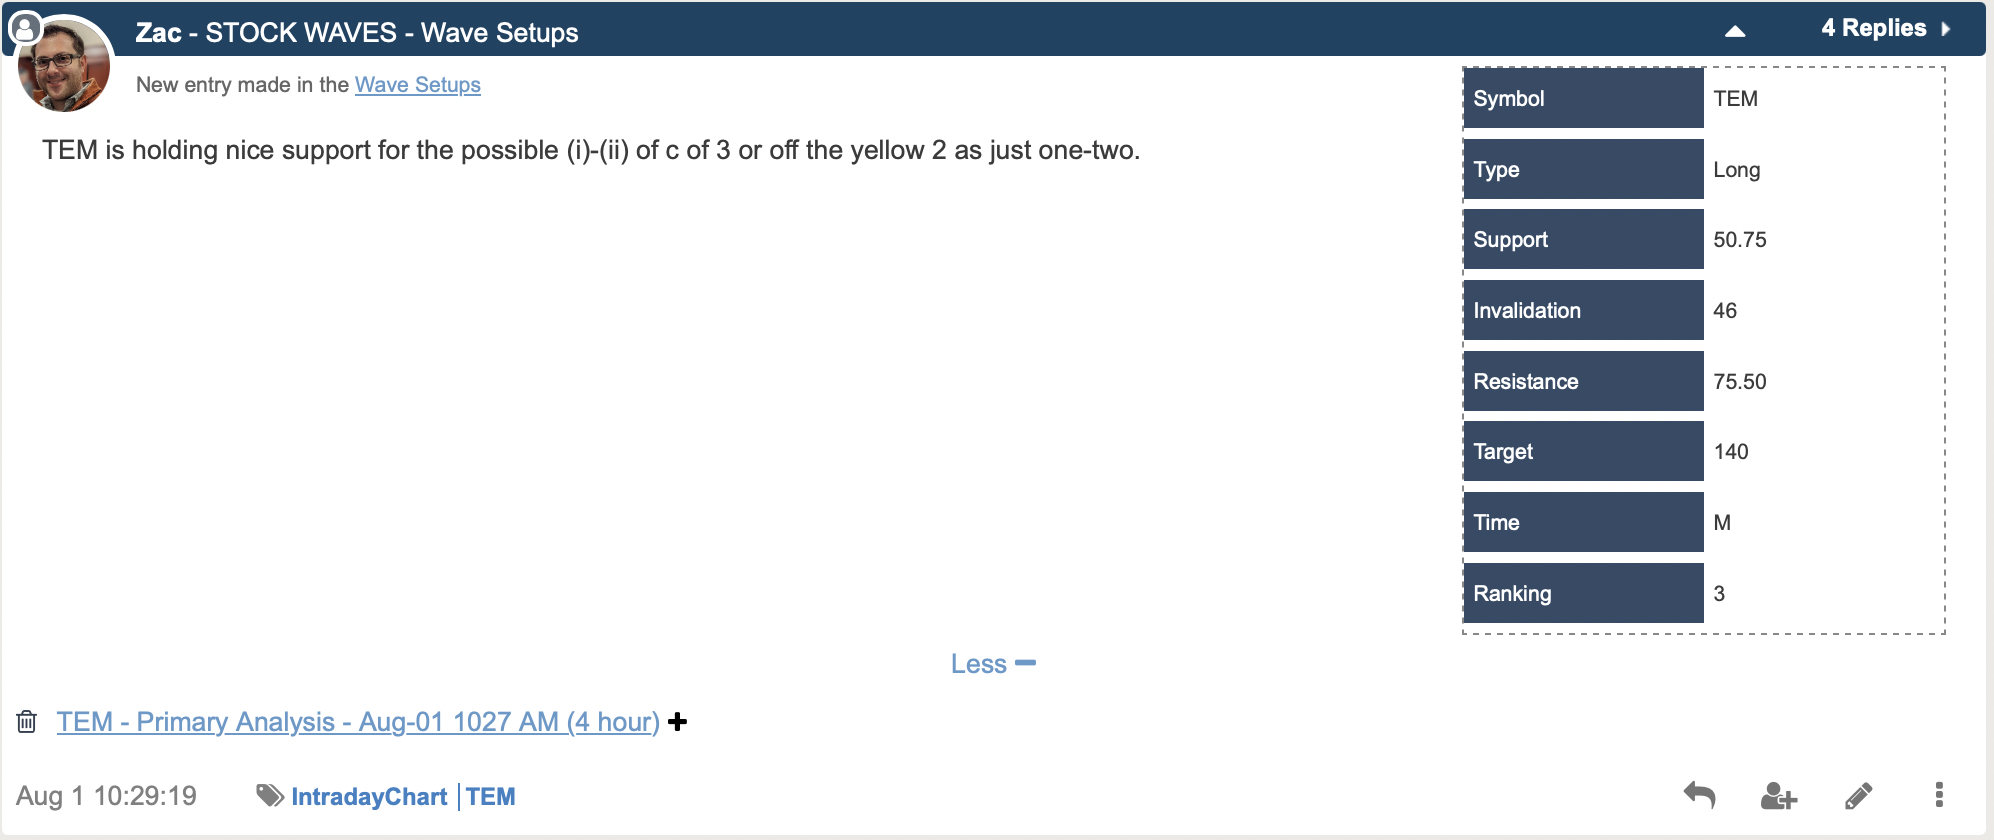
Then, pre-earnings, Zac updated near term support to the $53 level. Post-earnings, the stock reached as high as the $66 area in extended hours trading. Since then, we’ve seen a micro pullback and consolidation. What is likely next?
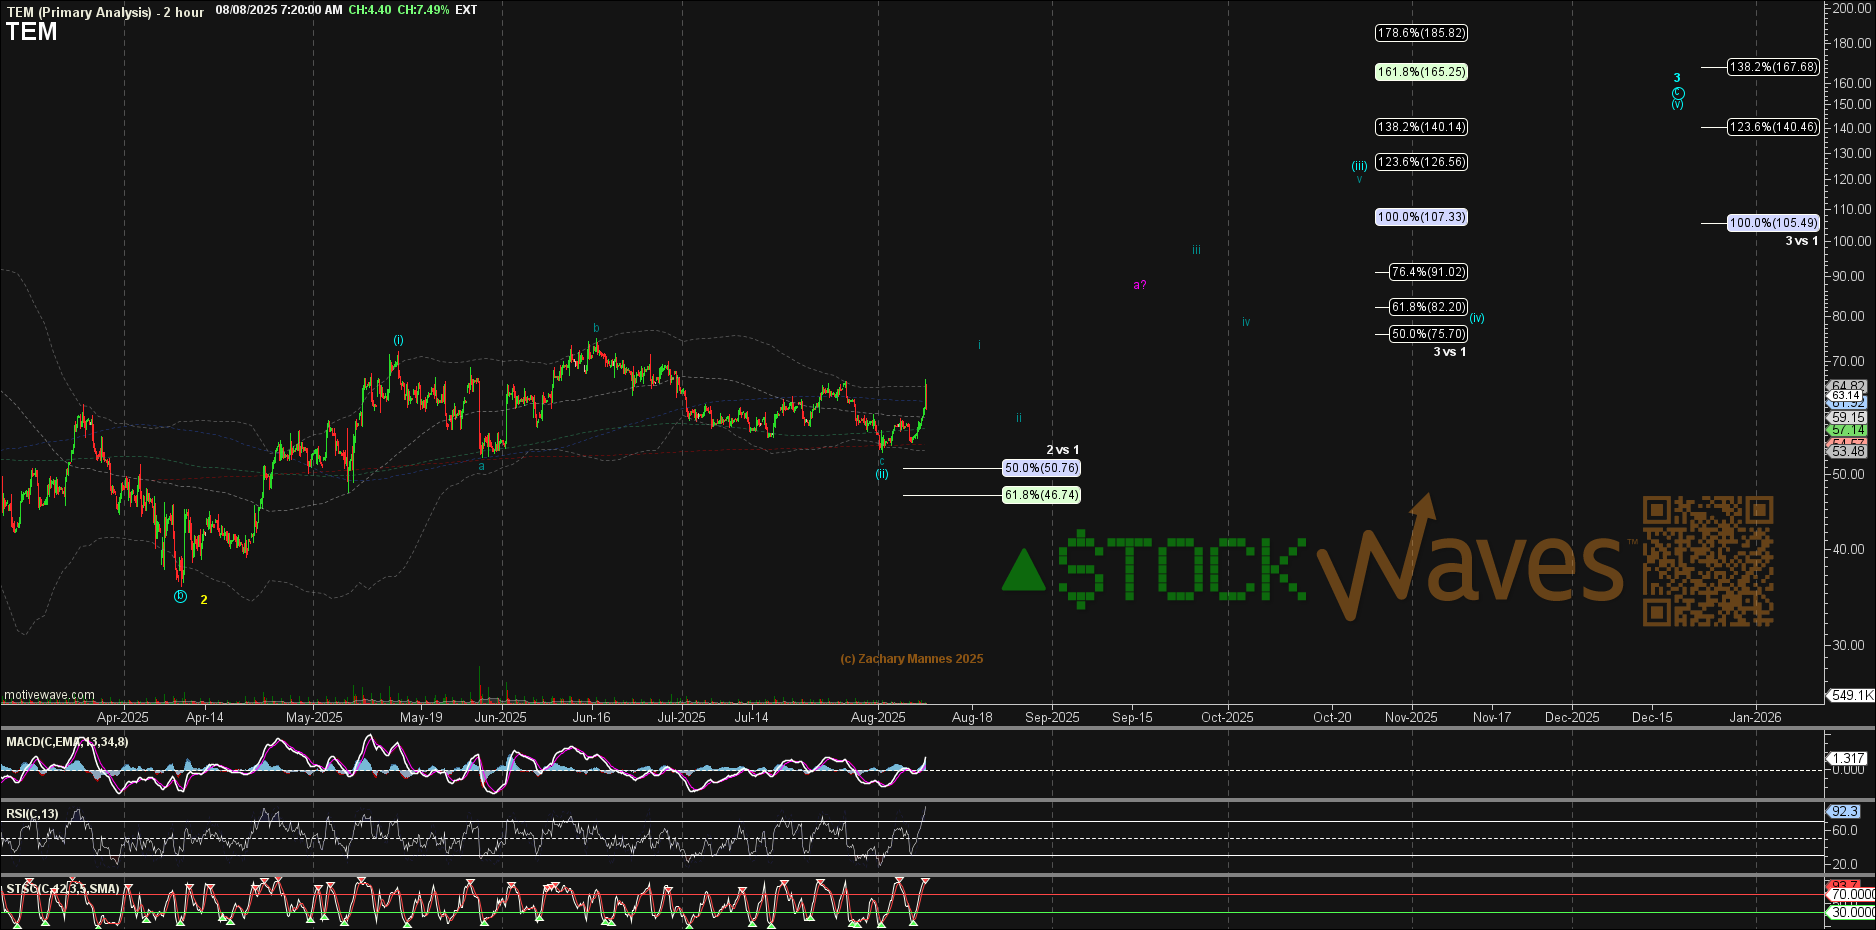
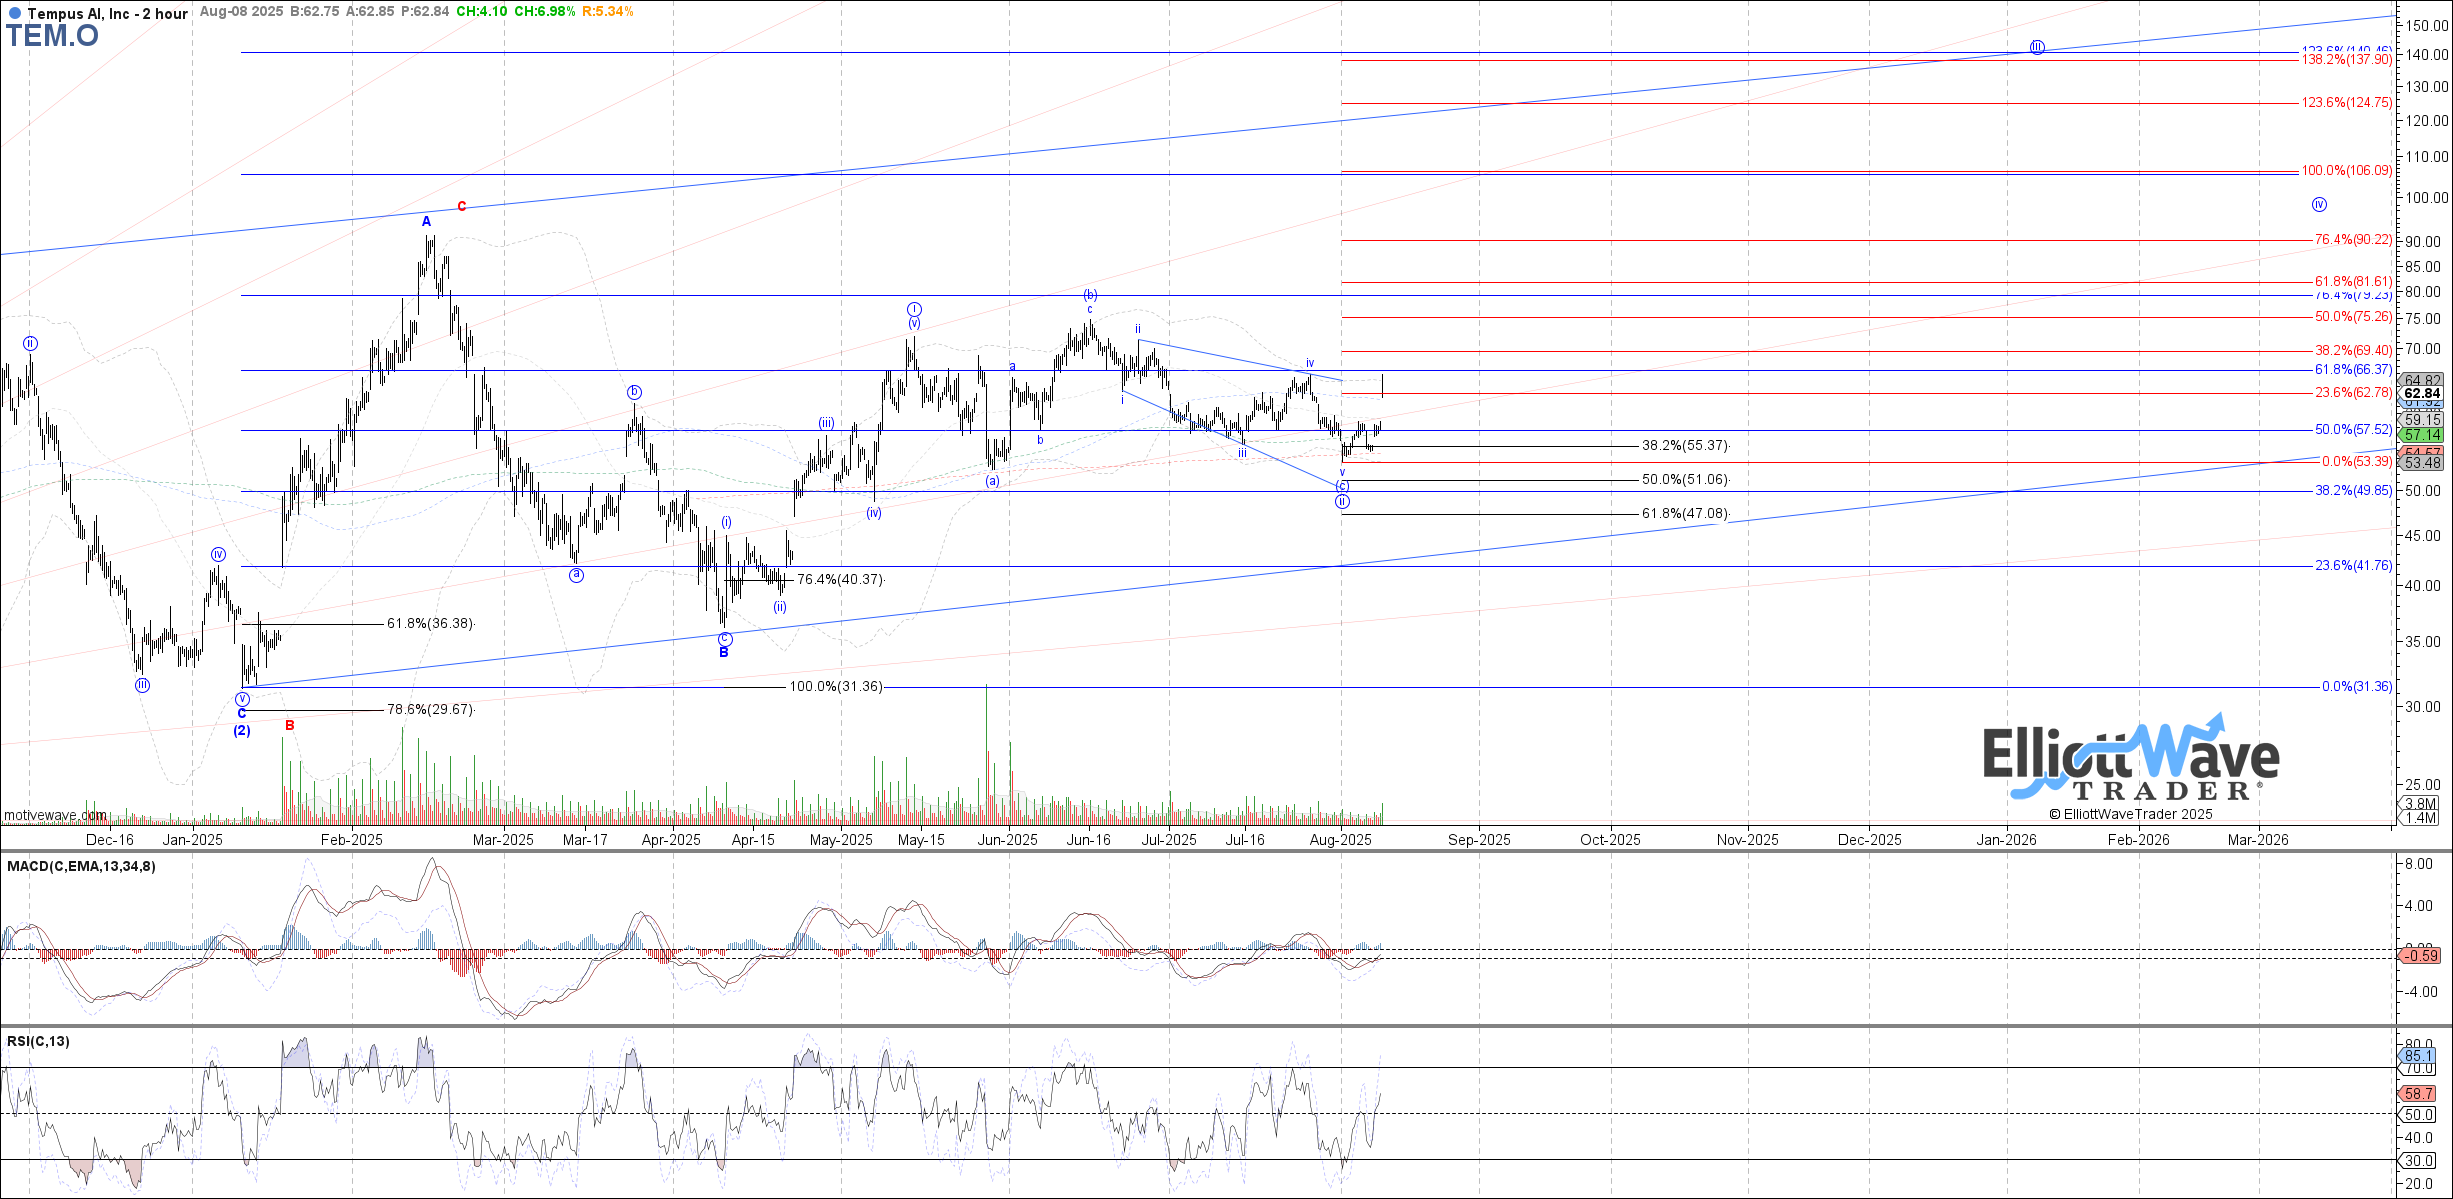
You can see that Zac and Garrett are in lock-step with their probable paths forward. Overhead targets are shown, and we have our near term invalidation level at $53 for now.
How did we arrive at these levels? Is this simply some sort of sophistry? No - it is actually deeply founded in science and mathematics. Yes - it takes a bit of time and effort to wrap your arms around a new way of viewing the markets. But the payoff is a tool of immense utility in your trading and investing.
Add This To Your Toolbox
Markets are emotional. They are irrational. In their wake, they can leave the seemingly most intelligent and logical among us battered, bloodied, and feeling deserted. Striving to constrain the markets in a linear box of reason and clean geometry will exhaust the brilliant and mercilessly bash the bravest. This is not how markets function.
However, we are not left in the lurch. A system is needed to bring structure to the apparent madness. We have such a system in place, it is the very foundation of our methodology. You too can add this utility to your own trading toolbox.
Please keep in mind that we provide our perspective by ranking probabilistic market movements based on the structure of the market price action. If we maintain a certain primary perspective as to how the market will move next, and the market breaks that pattern, it clearly tells us that we were wrong in our initial assessment. But here's the most important part of the analysis: We also provide you with an alternative perspective at the same time we provide you with our primary expectation, and let you know when to adopt that alternative perspective before it happens.
There are many ways to analyze and track stocks and the market they form. Some are more consistent than others. For us, this method has proved the most reliable and keeps us on the right side of the trade much more often than not. Nothing is perfect in this world, but for those looking to open their eyes to a new universe of trading and investing, why not consider studying this further? It may just be one of the most illuminating projects you undertake.
