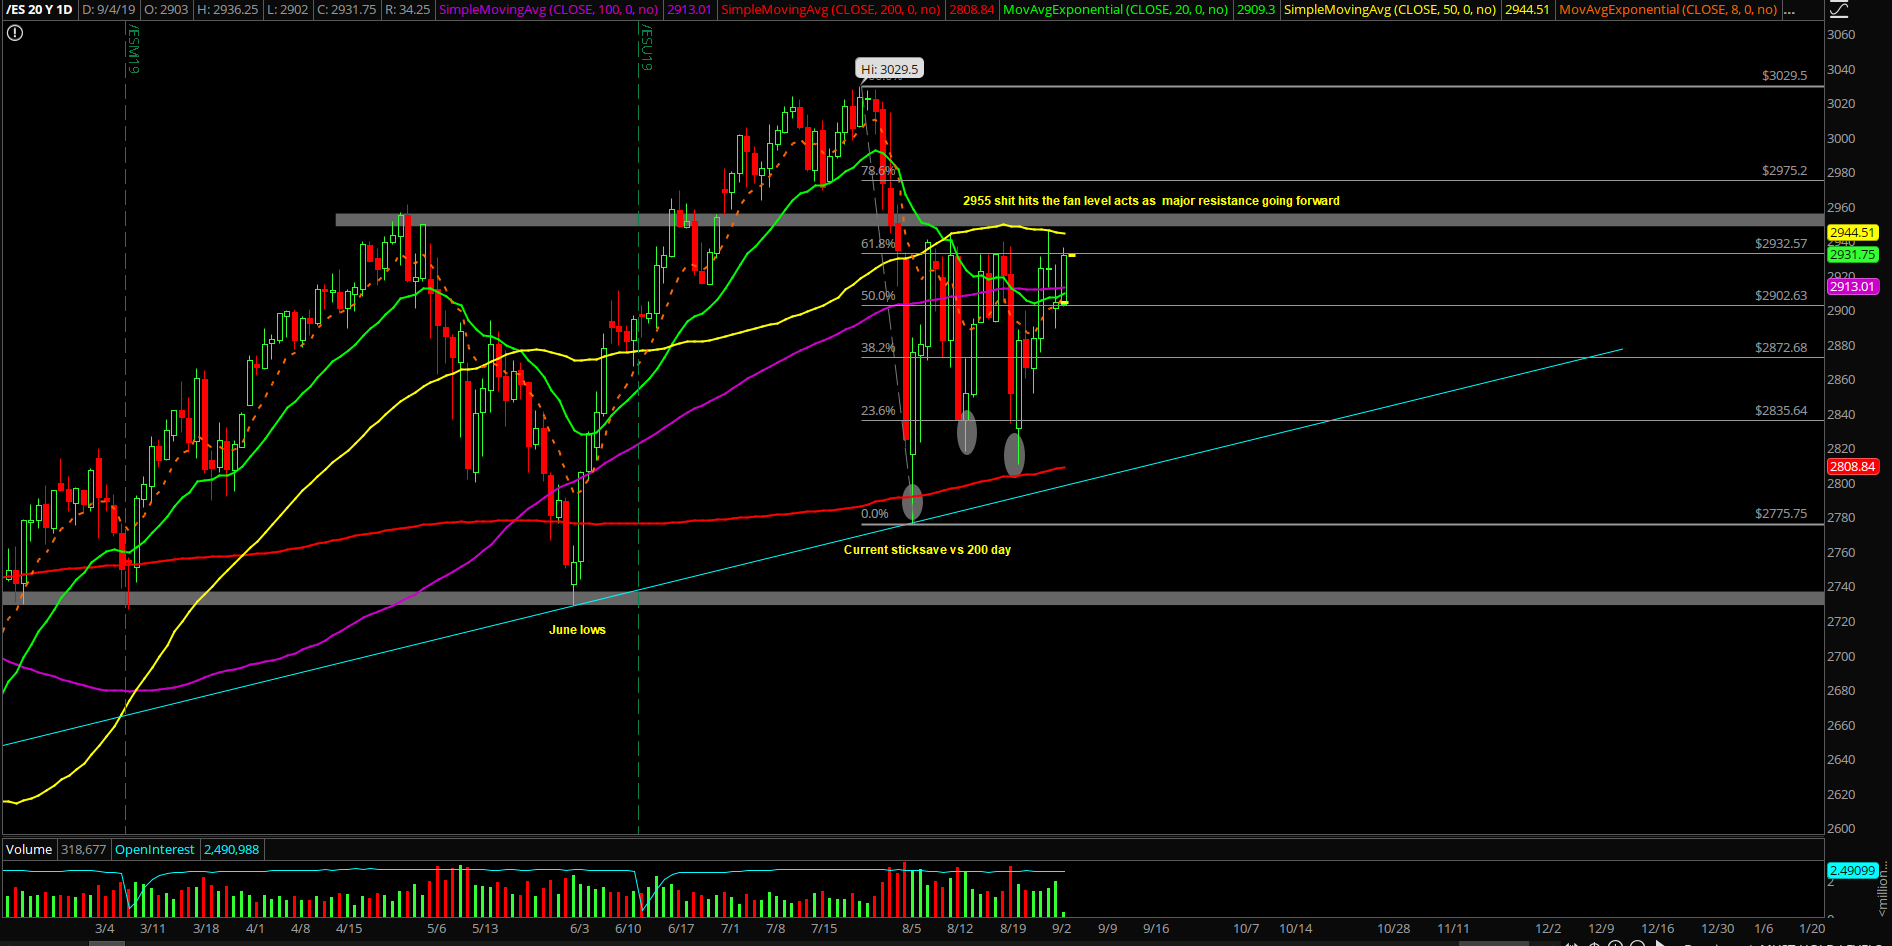
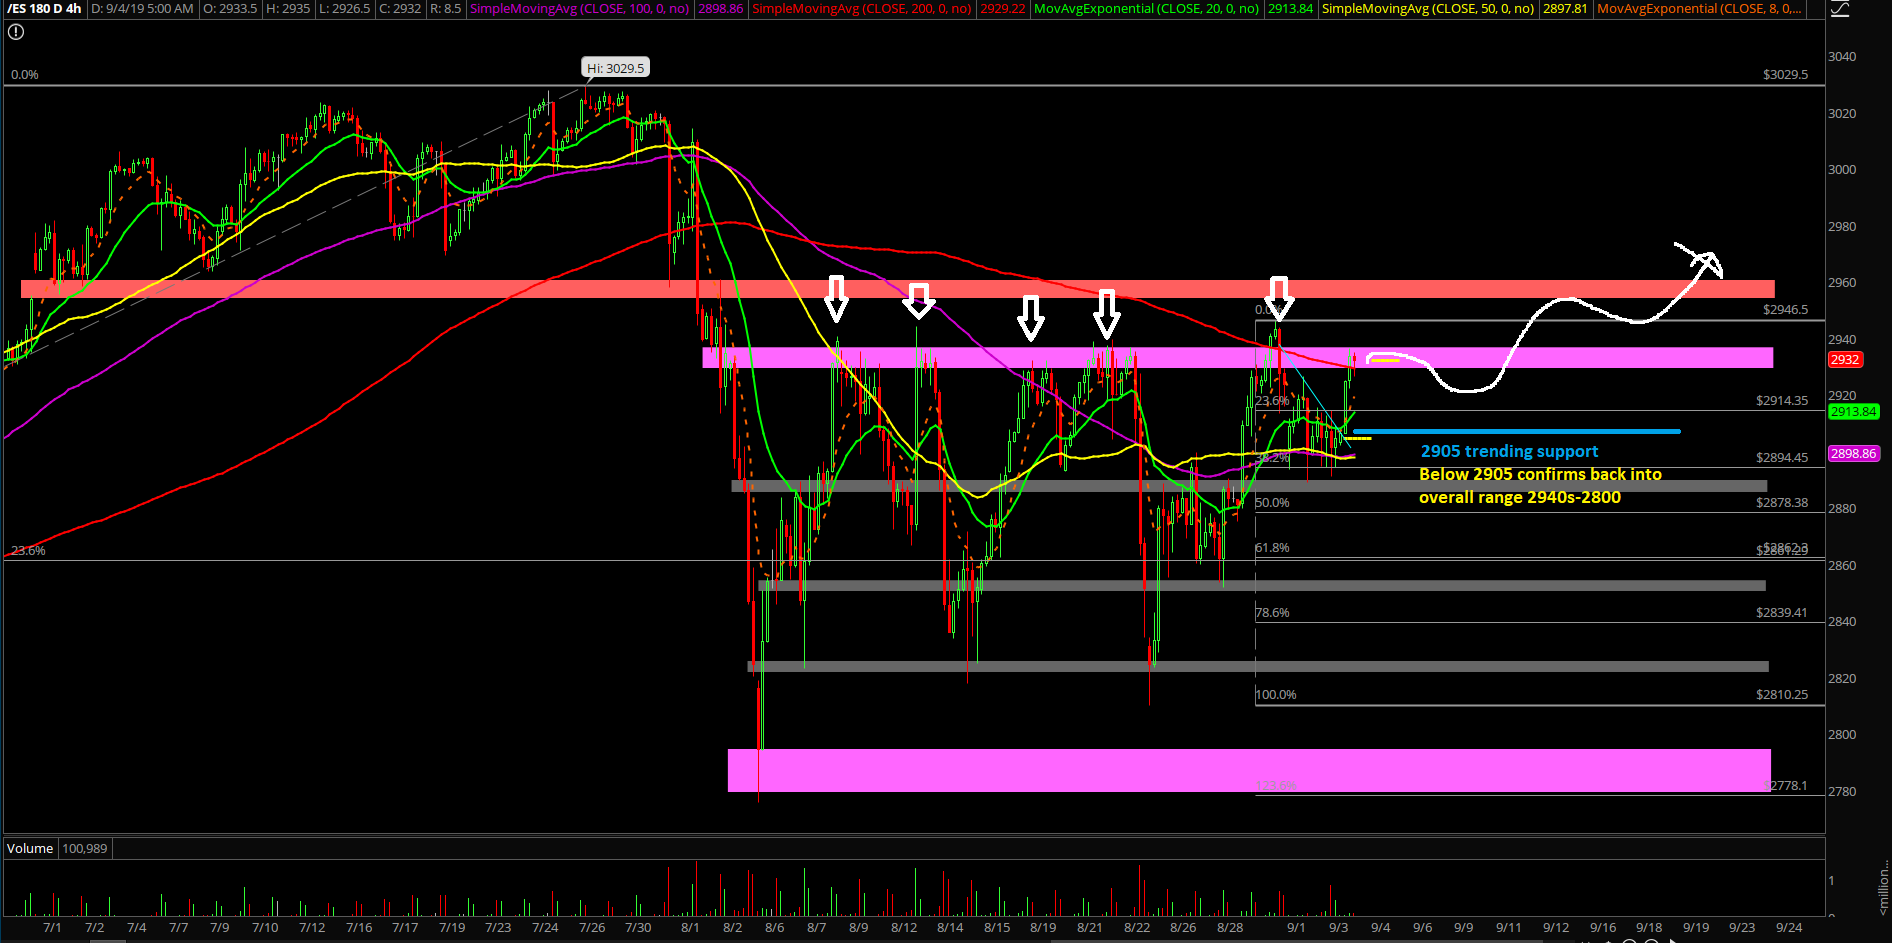
Technically Bullish As Long As Above 2905
 By
Ricky Wen
By
Ricky Wen
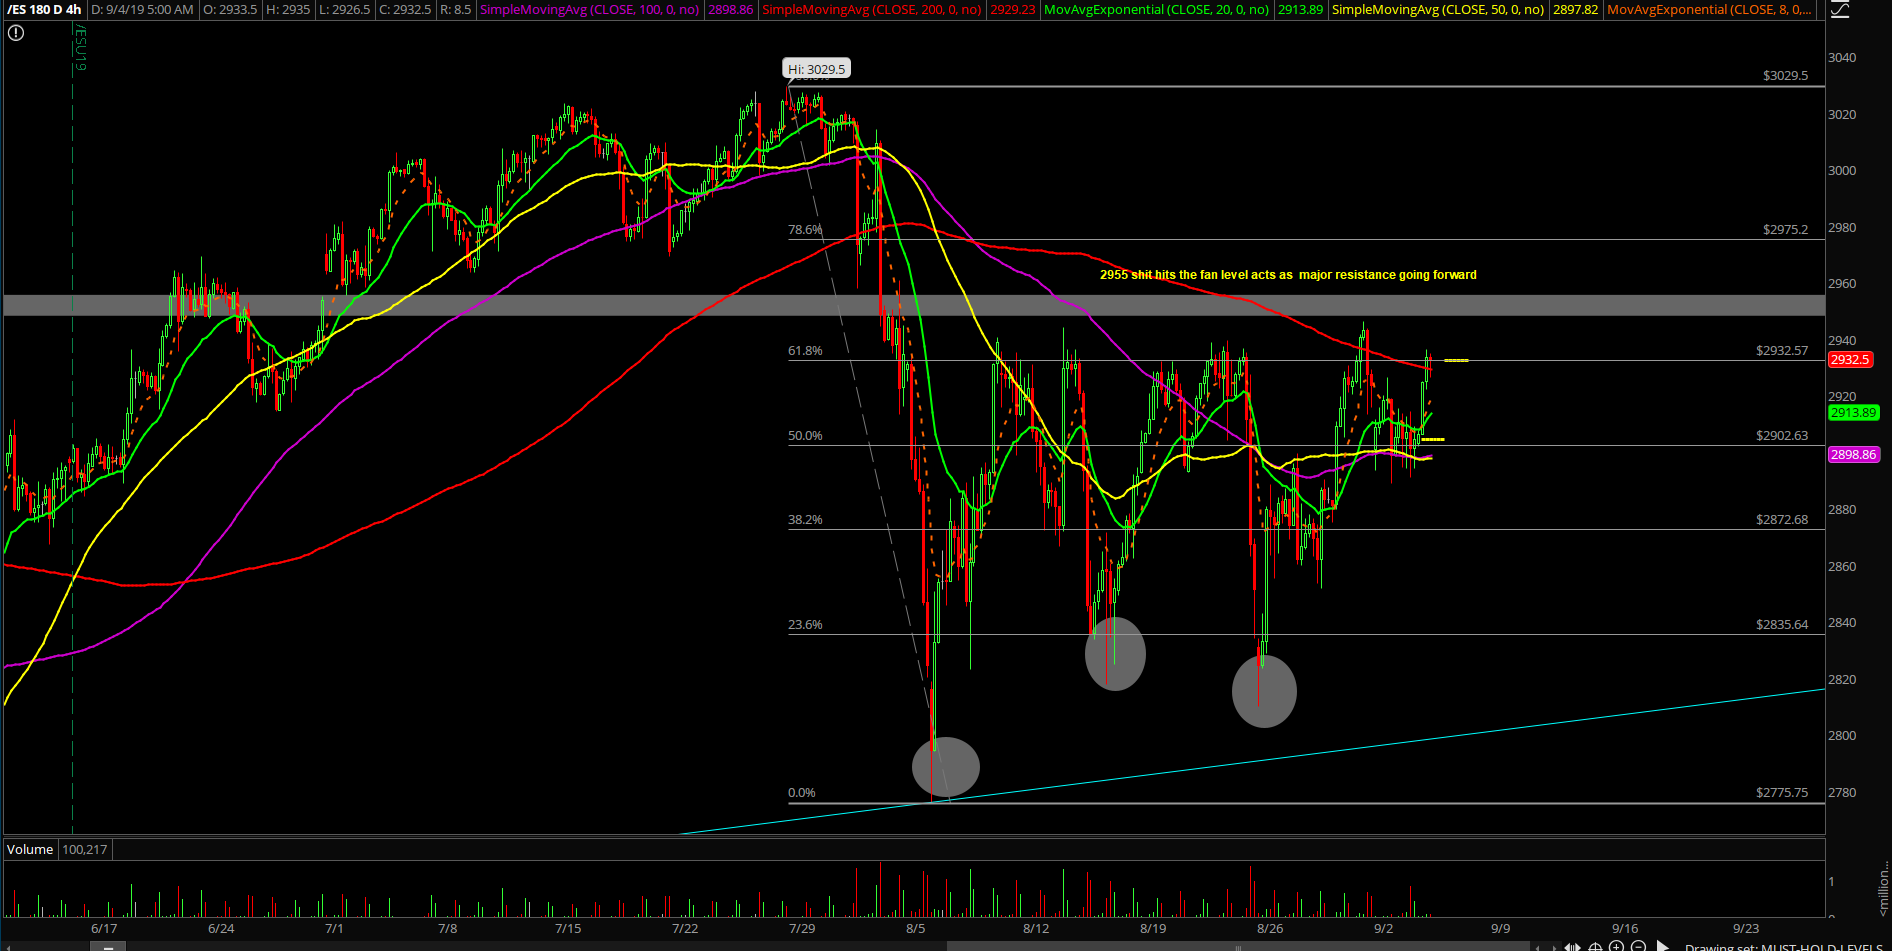
Tuesday’s session was a fairly tight range day as we warned about just trapping both sides of the market participants within the 2889-2926 weekend range. Nothing of significance occurred during RTH because it was just a good old "shake fest" with weak identifiable intraday setups based on probabilities.
The main takeaway is that the overnight globex session has made a stance by breaking above the tight 2889-2926 range on the Emini S&P 500 (ES) and now attempting its 6th time breakout vs. 2930-2940s zone of the past 3-4 weeks. Basically, the bulls held the 38.2% retracement yesterday and they are attempting the weekly timeframe’s ‘hold half and go’ continuation setup.
What’s next?
Tuesday closed at 2904.5 on the ES and it was pretty much just a doji rangebound shake fest that we warned ahead of time. Heading into today’s session/rest of week, we are technically bullish towards 2955/2970 as long as bulls remain above 2905 at all times. Wait and see for a higher lows setup.
If bulls flop, then price action is merely just stuck 2940s-2800 like the past 3-4 weeks and this becomes another failed breakout setup.
Extra Context:
- Daily chart – everything is considered range bias when trading inside the August 29th 2930.75-2875.25 range, with the tighter range being 2889-2926 since the Sunday night "stuckfest"
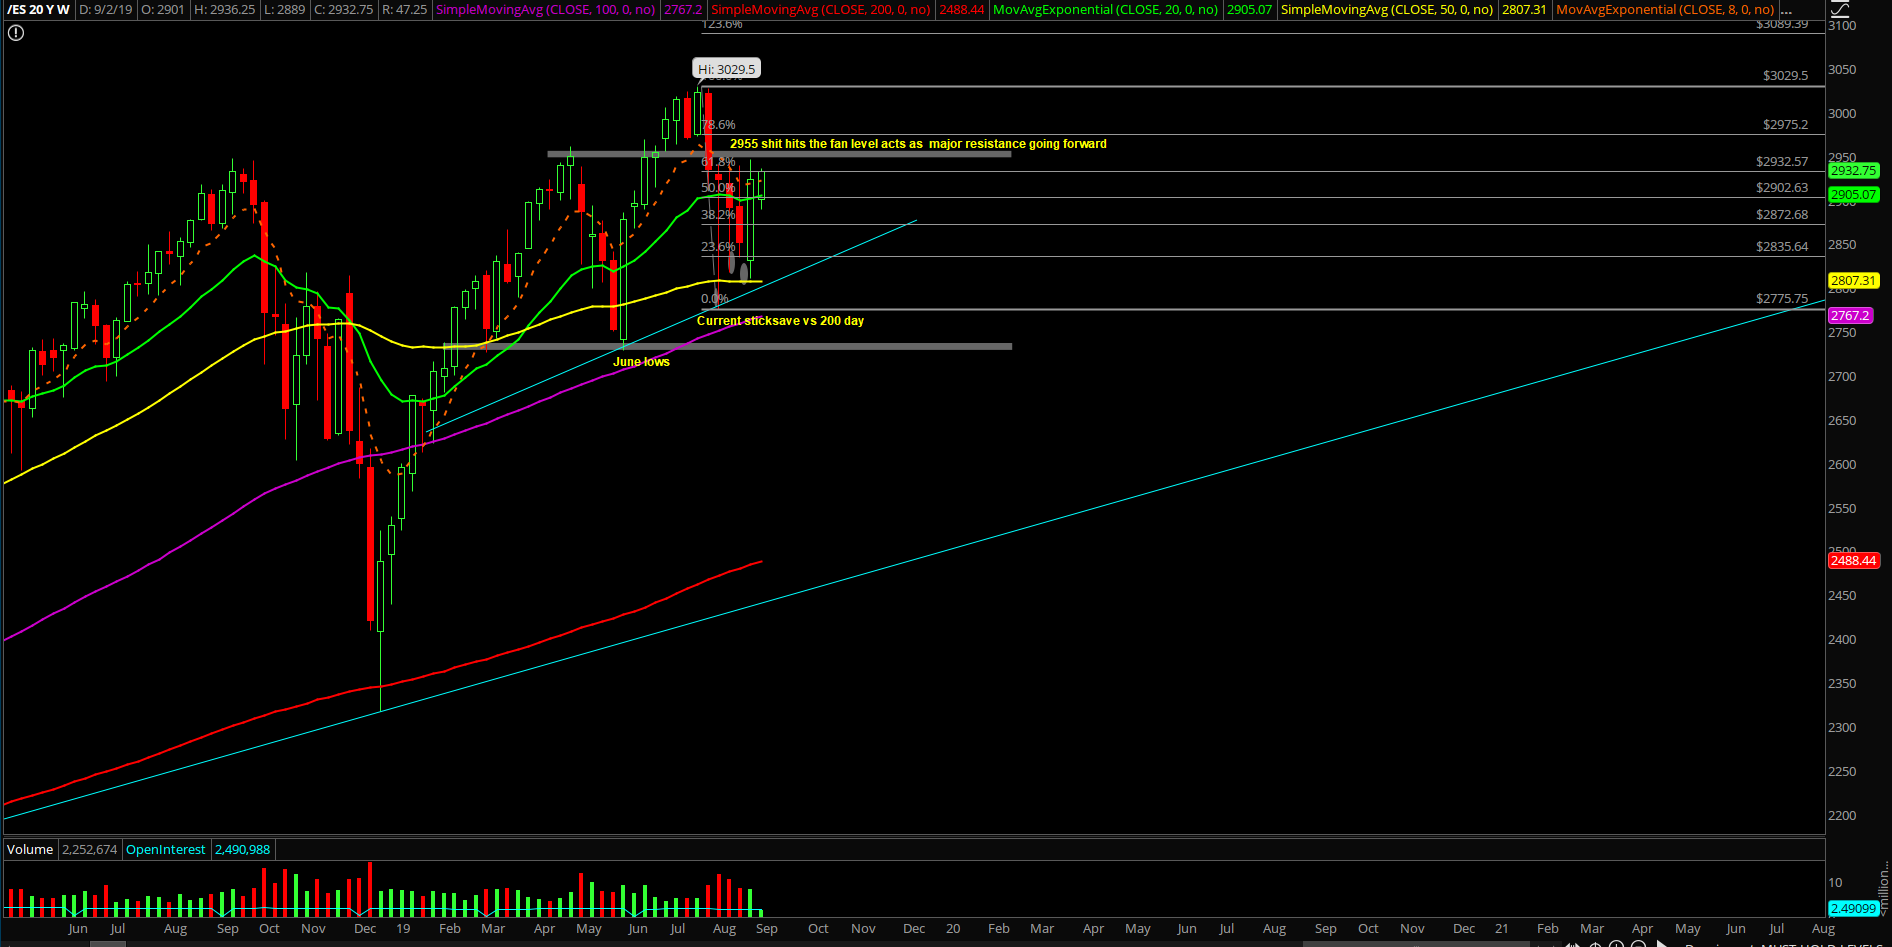
- Weekly chart – bulls will be trying to complete their ‘hold half and go’ setup, meaning holding last week’s midpoint range to continue their attempt of the breakout and the 3 weeks worth of potentially trapped bears from the massive weekly bull engulf candlestick. 50% fib retracement = 2878 for reference which matches the August 29th low area.
- As discussed in trading room, we shall remain neutral in this range and will be utilizing a tweaked buystop/sellstop strategy in order to trade September and escape the chopfest that we had experienced in August
Overall September Bias
Monthly chart – the bulls stick-saved 2775.75 vs. the monthly 20EMA, which also aligned with the macro 200 daily moving average area, so bulls did a fantastic job stopped the crash setup from the opposing side.
As discussed, our September thesis is the likely inside month range of 3014.25-2775.75 overall. The market needs to digest and form another basing setup as we head into year-end closing print. We are also treating the March, June and August 2019 lows as a standard higher lows structure, so that means the August lows is obviously the must hold on any pullback if going for the macro timeframe into year end and year 2020.