Tariffs? "What Tariffs?”, Says Crowdstrike
 By
Levi
By
Levi
By Levi at Elliott Wave Trader; Produced with Avi Gilburt
There are so many headlines flying around to and fro that it is difficult to keep up. Some investors have simply decided to “do nothing”. Do you find yourself whipsawed by the roller coaster of emotions in the roiled oceans of the markets? Many will seek a narrative to place a reason on the movements or at least assign blame. But is that really what’s behind price movements that we see?
What’s more, will there be some individual names that may yet rise above the fray? We believe so. In fact, in StockWaves, Zac Mannes and Garrett Patten have recently released some 22 names that give solid projections to higher highs on their respective charts, and the potential for many to make all-time highs even in the face of the current uncertainty. We will look at one of those, CRWD. First though, let’s set the scene.
Beware The Narrative
As human beings, we love narratives. Tell me a tale, captivate my mind, or at least entertain me while time passes by. However, these are narratives that are meant to evoke emotions. This is one of their main purposes. Emotions are sentiment and vice versa.
But, here’s the danger as an investor, particularly in a moment like we currently find ourselves. While emotions are certainly present in the investing environment, rather than be adversely affected by them, why not use this to your advantage? Per contra, if the individual becomes caught up in the sentiment of their surroundings, then, rather than benefitting from emotions, their own feelings and decisions will be skewed.
So, if we are not going to be guided via stories and narratives, what do we use? Well, I’m glad you asked that question. And, here’s the reply with specific parameters in CRWD stock. Give this next portion a moment of your time to set the table for this scenario.
The Power Of Pinball In The Palm Of Your Hand
Here is a brief excerpt from an article that Avi Gilburt wrote regarding sentiment (crowd behavior) and what Ralph Nelson Elliott observed some 90+ years ago:
"Elliott theorized that public sentiment and mass psychology move in 5 waves within a primary trend, and 3 waves within a counter-trend. Once a 5 wave move in public sentiment has completed, then it is time for the subconscious sentiment of the public to shift in the opposite direction, which is simply the natural cycle within the human psyche, and not the operative effect of some form of ‘news’.
And, in 1940, Elliott publicly tied the movements of human behavior to the natural law represented through Fibonacci mathematics. Therefore, these primary trend and counter-trend movements in the market generally adhere to standard Fibonacci extensions and retracements.” - Avi Gilburt
Now before you throw shade at the light, just let this marinate for a minute. It was these very movements that helped in the development of what we lovingly call ‘Fibonacci Pinball’. Basically, this is the seemingly orderly movement of a stock or market as its structure unfolds before us.
And, we see this ‘Pinball’ displayed day after day in our trading room. In fact, we will track the Elliott Wave structure live and show our members key turning points, resistance and support levels throughout the day. It is not a one-off. This has become our preferred way of tracking and trading the markets. Why? Because it works!
Not all paths will play out as illustrated. We view the markets from a probabilistic standpoint. But at the same time, we have specific levels to indicate when it's time to step aside or even change our stance and shift our weight.
Let’s Apply Theory To A Real-World Example: The CRWD Chart
The larger context first, please.
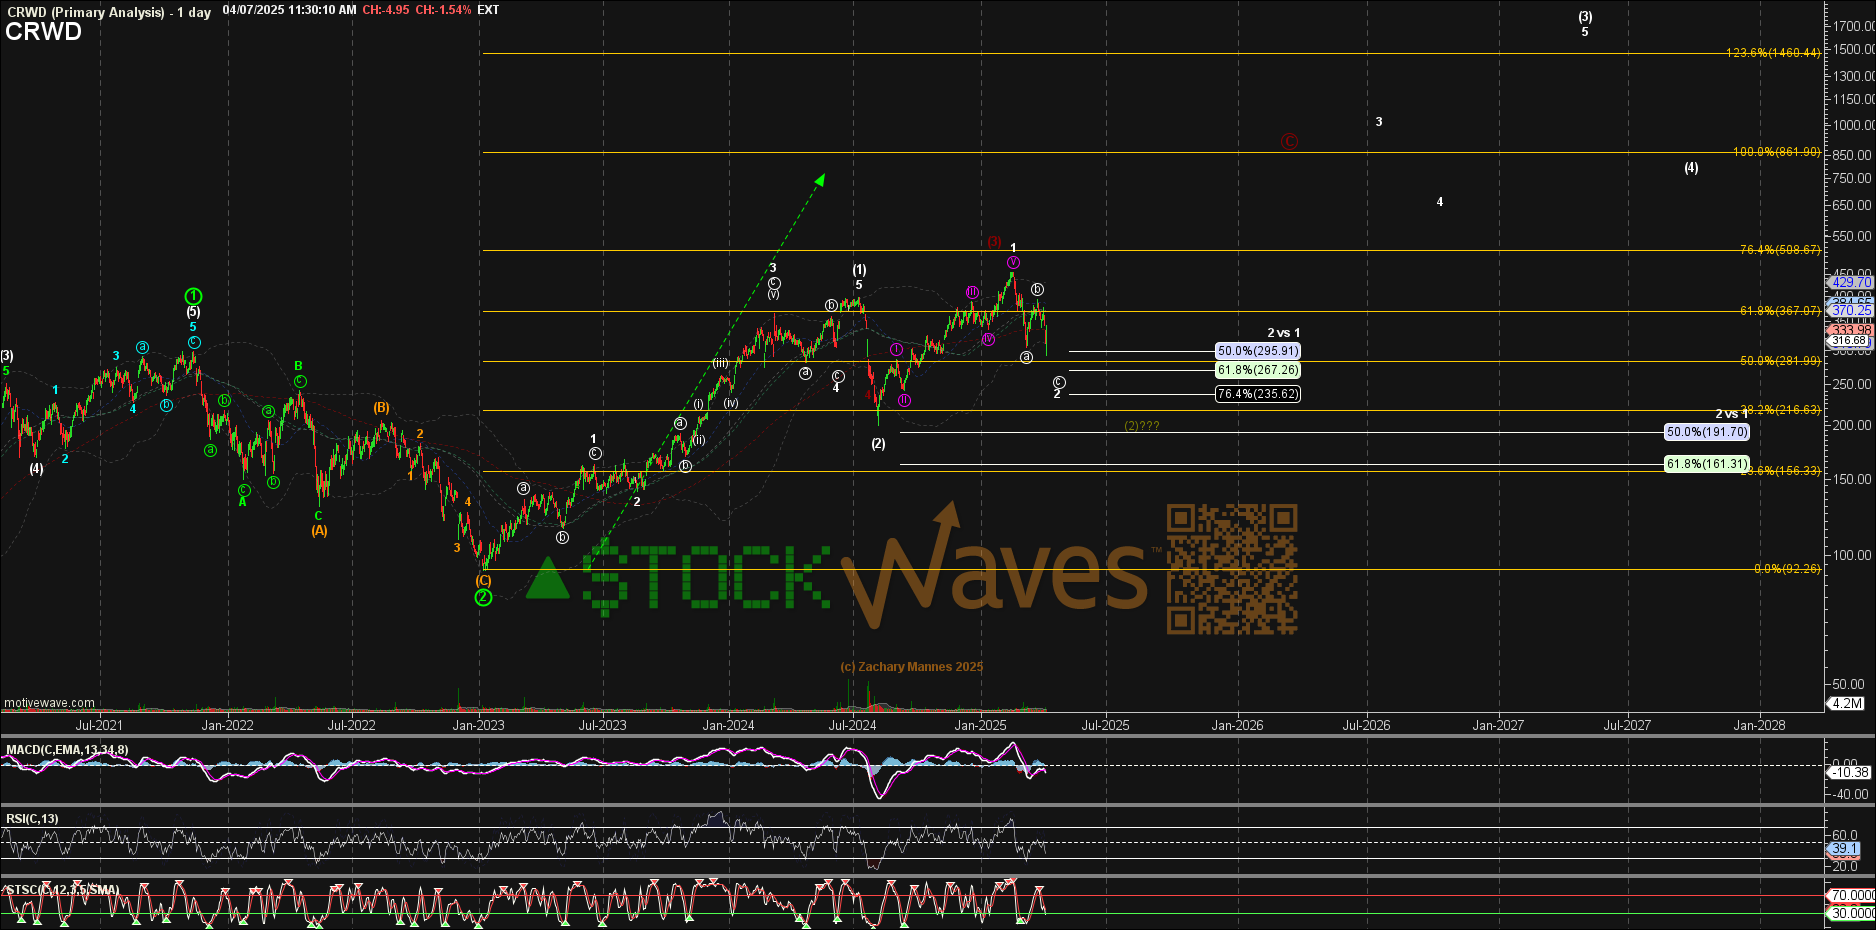
CRWD has had some excellent advances and a few setbacks along the way. This is in fact quite typical for a rally structure. You can readily see on this time frame that Zac is counting the rally up into late summer 2021 as Primary Wave 1. And then the subsequent pullback that completed in January 2023 as Primary Wave 2. From this setup, a standard move would be as we have already seen take shape for the next lesser degree wave (1)-(2)that appears complete.
Why do we say that it seems complete? Note the 5 waves up from the wave (2) low for wave 1 of (3). That would strongly suggest that price is now in a wave 2 of the larger wave (3) rally structure. Now, let’s zoom into the nearer time frame interval for more granularity.
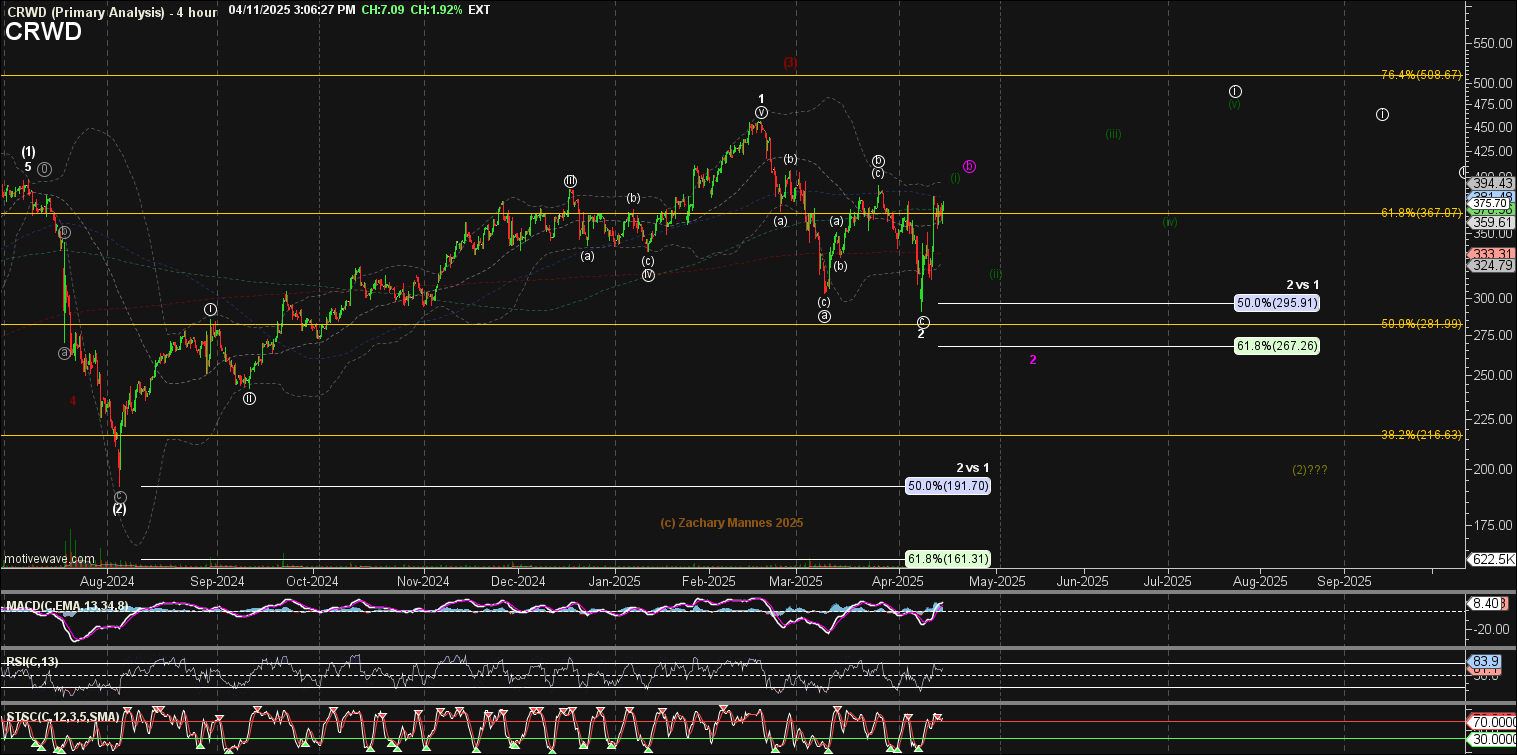
Zac has provided two likely near term paths, one in green and the other in purple. This is not to assume multiple counts so that one will be right and we would declare victory. The point is that markets are dynamic and fluid in nature, rather than linear. Therefore, we must adapt to the structure of these subwaves to better discern probabilities.
If price forms 5 waves down from this region, then the purple path becomes more likely and the wave 2 pullback would be slightly more protracted in time and price. If instead price pulls back correctively and in an overlapping manner then the green subwave path is probable and the rally likely kicks into gear sooner.
However, should price move below $267 with sustained follow through, then these paths may need revision and another scenario may be taking shape. For now, the primary path looking ahead is for a rally back toward the recent highs into the latter half of this year.
Does This Really Work? See The Results For Yourself
We will be the first to tell you the answer to that question: “Not always”. However, we have yet to find another analysis methodology that can provide context at any moment in time for the observed market/stock. Nor have we found another tool that can dynamically adapt in real-time to the markets as this does.
Over time with a large sample size of setups, you will come to appreciate the utility of this analysis method for your trading and investing. Of course not all setups are going to play out as illustrated. That is simply the nature of dynamic markets in action. This methodology will tell you when to shift your weight and when the scenario invalidates.
So, a setup can be wrong. The opinion of the analysts may need revision. It’s OK to be wrong - just don’t stay wrong. Does your current method tell you when to adjust your view? We should be students and observers of the emotions ever present in the markets. But we don’t benefit from becoming participants in this sentiment.
There is much more education available in the articles shared with the readership as well us a plethora of resources at your disposal in our Help Section. Yes, there are nuances to the analysis. Once familiar with our methodology, our members discover a powerful ally on their side to provide guidance and risk management in their trading/investing.
