TSLA: Moments Of Clarity Followed By Bewilderment
 By
Levi
By
Levi
By Levi at StockWaves; Produced with Avi Gilburt
Don’t be fooled by the title of this piece. Many of our members arrive at our site having experienced the apparent baffling nature of the markets. However, what’s more interesting is that once they discover the true mover of price on stock charts, it’s almost as if someone has burned the fog away and they can see much farther ahead than they ever could before.
We’re going to discuss the mover of markets a bit more in this article. The main reason being this - (TSLA) and the bonus ticker here (RIVN) are principally driven, not by their respective company fundamentals, but rather by sentiment. This fact is recognized by one of the preeminent fundamental analysts that we have found, our own Lyn Alden.
If Fundamentals Can’t Measure The Stock Price, What Can?
Lyn is one of the lead analysts on our team. She provides us with deep dive insights into the fundamentals of the macro economic scene, as well as specific companies that make up the market. When she speaks, we listen carefully. Lyn has commented on several occasions that TSLA trades predominantly “on sentiment and technicals”.
Now, if you were to speak with TSLA bulls or bears, you would likely get quite the narrative. As human beings we love narratives. Tell me a story, captivate my mind, or at least entertain me while time passes by. However, narratives are meant to stir emotions. That is one of their main purposes. Emotions are sentiment and vice versa.
Sentiment is simply human behavior, which is not logical or reasoned, in motion via the price of the stock or the index being analyzed. If TSLA trades mainly on sentiment, then how would it be possible to track in any reliable fashion something that irrational?
This is precisely why Elliott Wave Theory, when correctly applied, can help bring some structure to an illogical, emotional environment. There are some important and, for lack of a better word, fundamental guidelines that we must employ to understand the structure of price.
Would You Like To Understand The ‘Why’?
Avi Gilburt has written extensively about these guidelines. Are you tired of being whipsawed by movements that are seemingly without reason? Please take just a few moments to understand the ‘why’. The what, how, where and when are interesting. But, not nearly so cardinal in importance as the ‘why’. Start here with Part 1 of the 6-part series entitled, “This Analysis Will Change The Way You Invest Forever”.
How We Apply Our Methodology To TSLA (and RIVN)
We continue with an overall ‘hold’ rating on TSLA. This is for the simple fact that there is not a specific setup via the structure of price that will project with high probability what is likely to happen next. So, what are we even doing here? Don’t despair. There have been several opportunities along the way where we have had moments of clarity and could take swift advantage of the light whilst it shone.
But just as every day comes to a conclusion, darkness falls for a bit and we wait for the dawn once again. That’s when we literally sit on our hands observe the pause in the action. Sometimes, doing nothing is the best play.
It was at the end of October that we were able to identify a specific buy setup with defined risk vs reward. In fact, Avi Gilburt commented specifically on this setup even posting his buy and a sell of TSLA shares. Note the date/time stamps that show the buy at 192 and the sell at the 250 area.
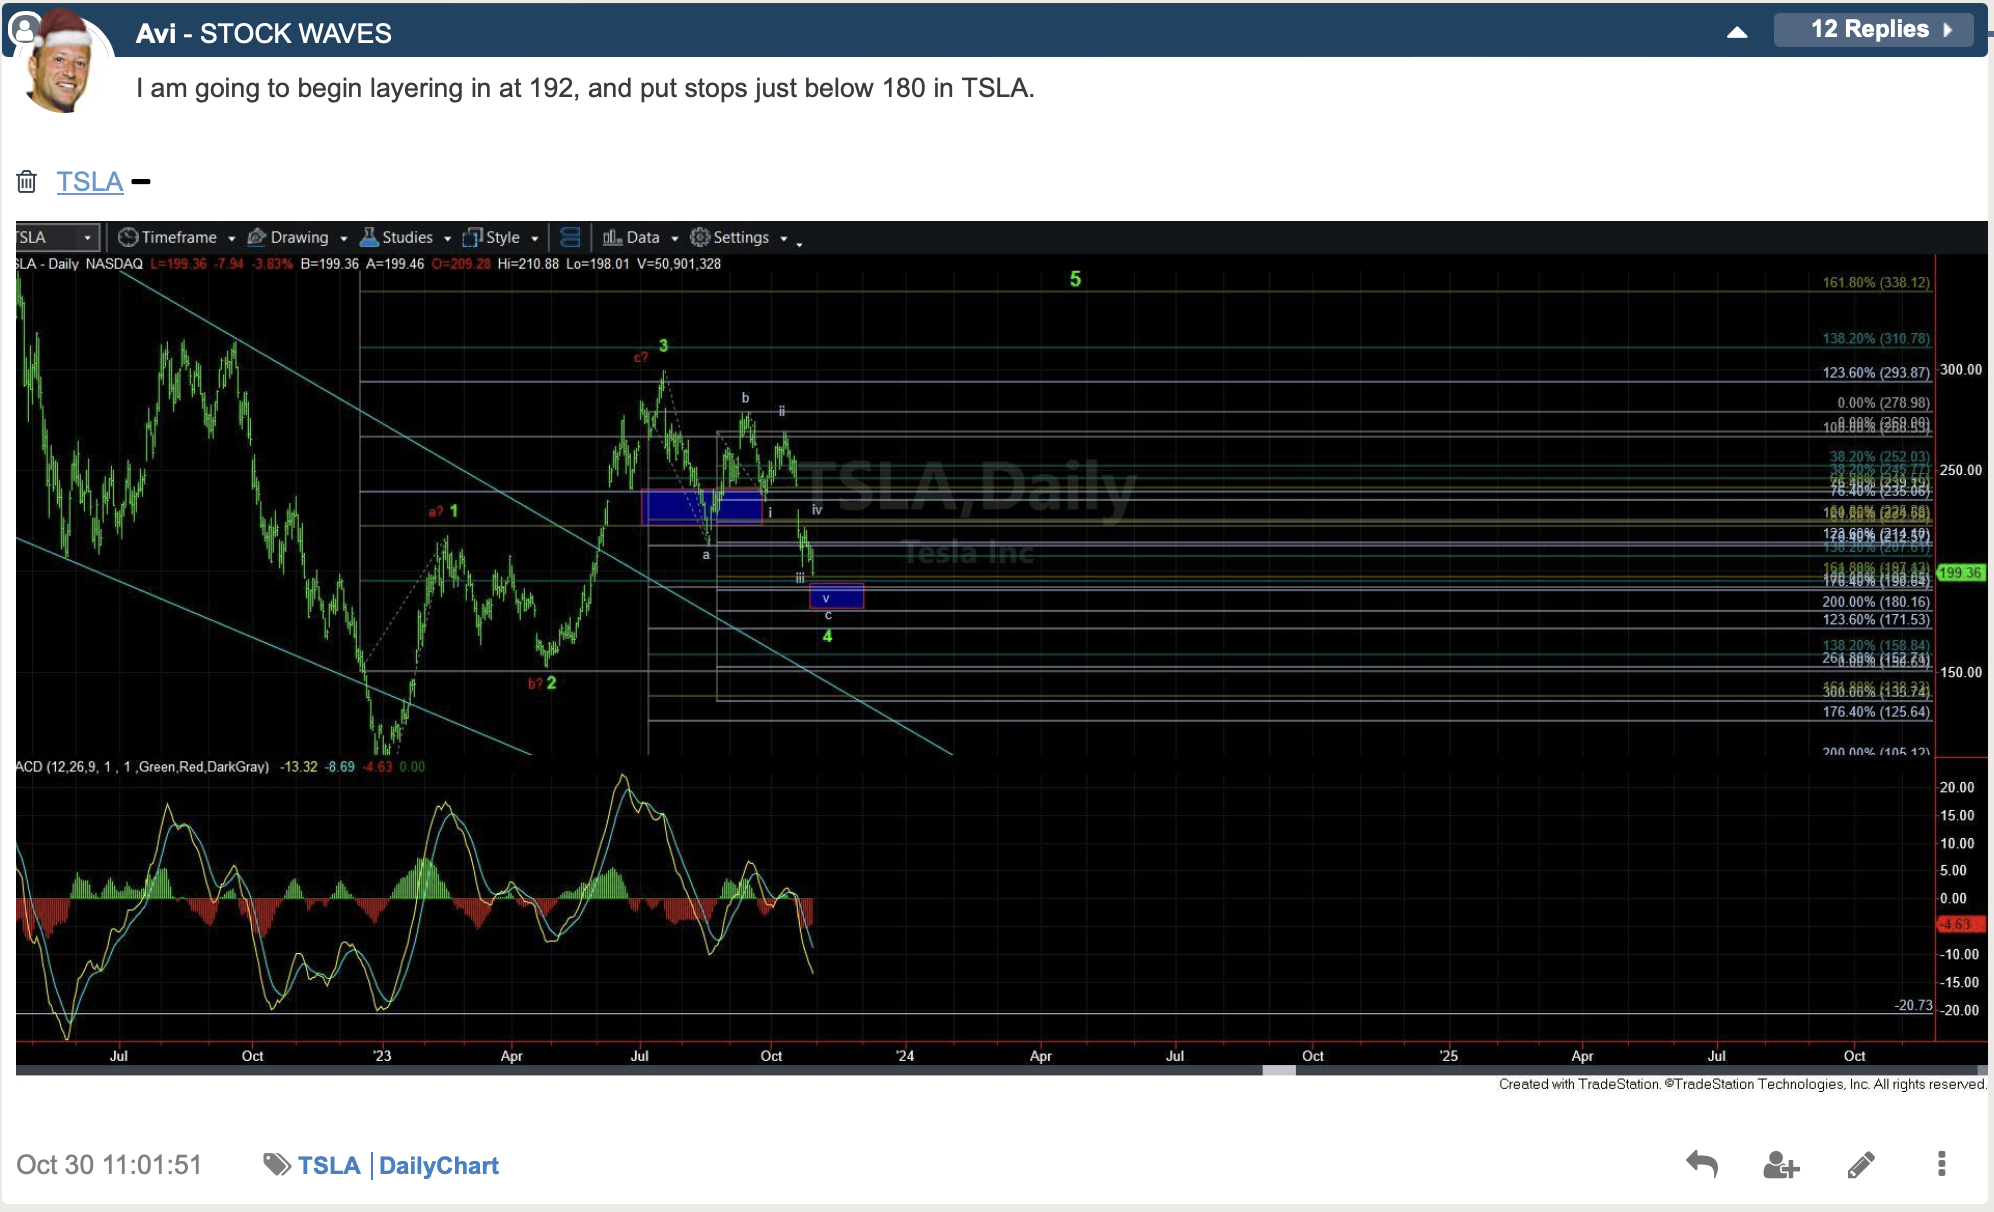
 That is not guesswork, nor is it a simple shot in the dark. This is Elliott Wave Theory hard at work, guiding the way. Well, what about now? Is there light to be had?
Most recently we identified the 228 area as a high probability turning point with key support at 225 - 226. From there, price would have the 260 area as important resistance. The chart did indeed fill in as anticipated and resistance has held so far. What’s next?
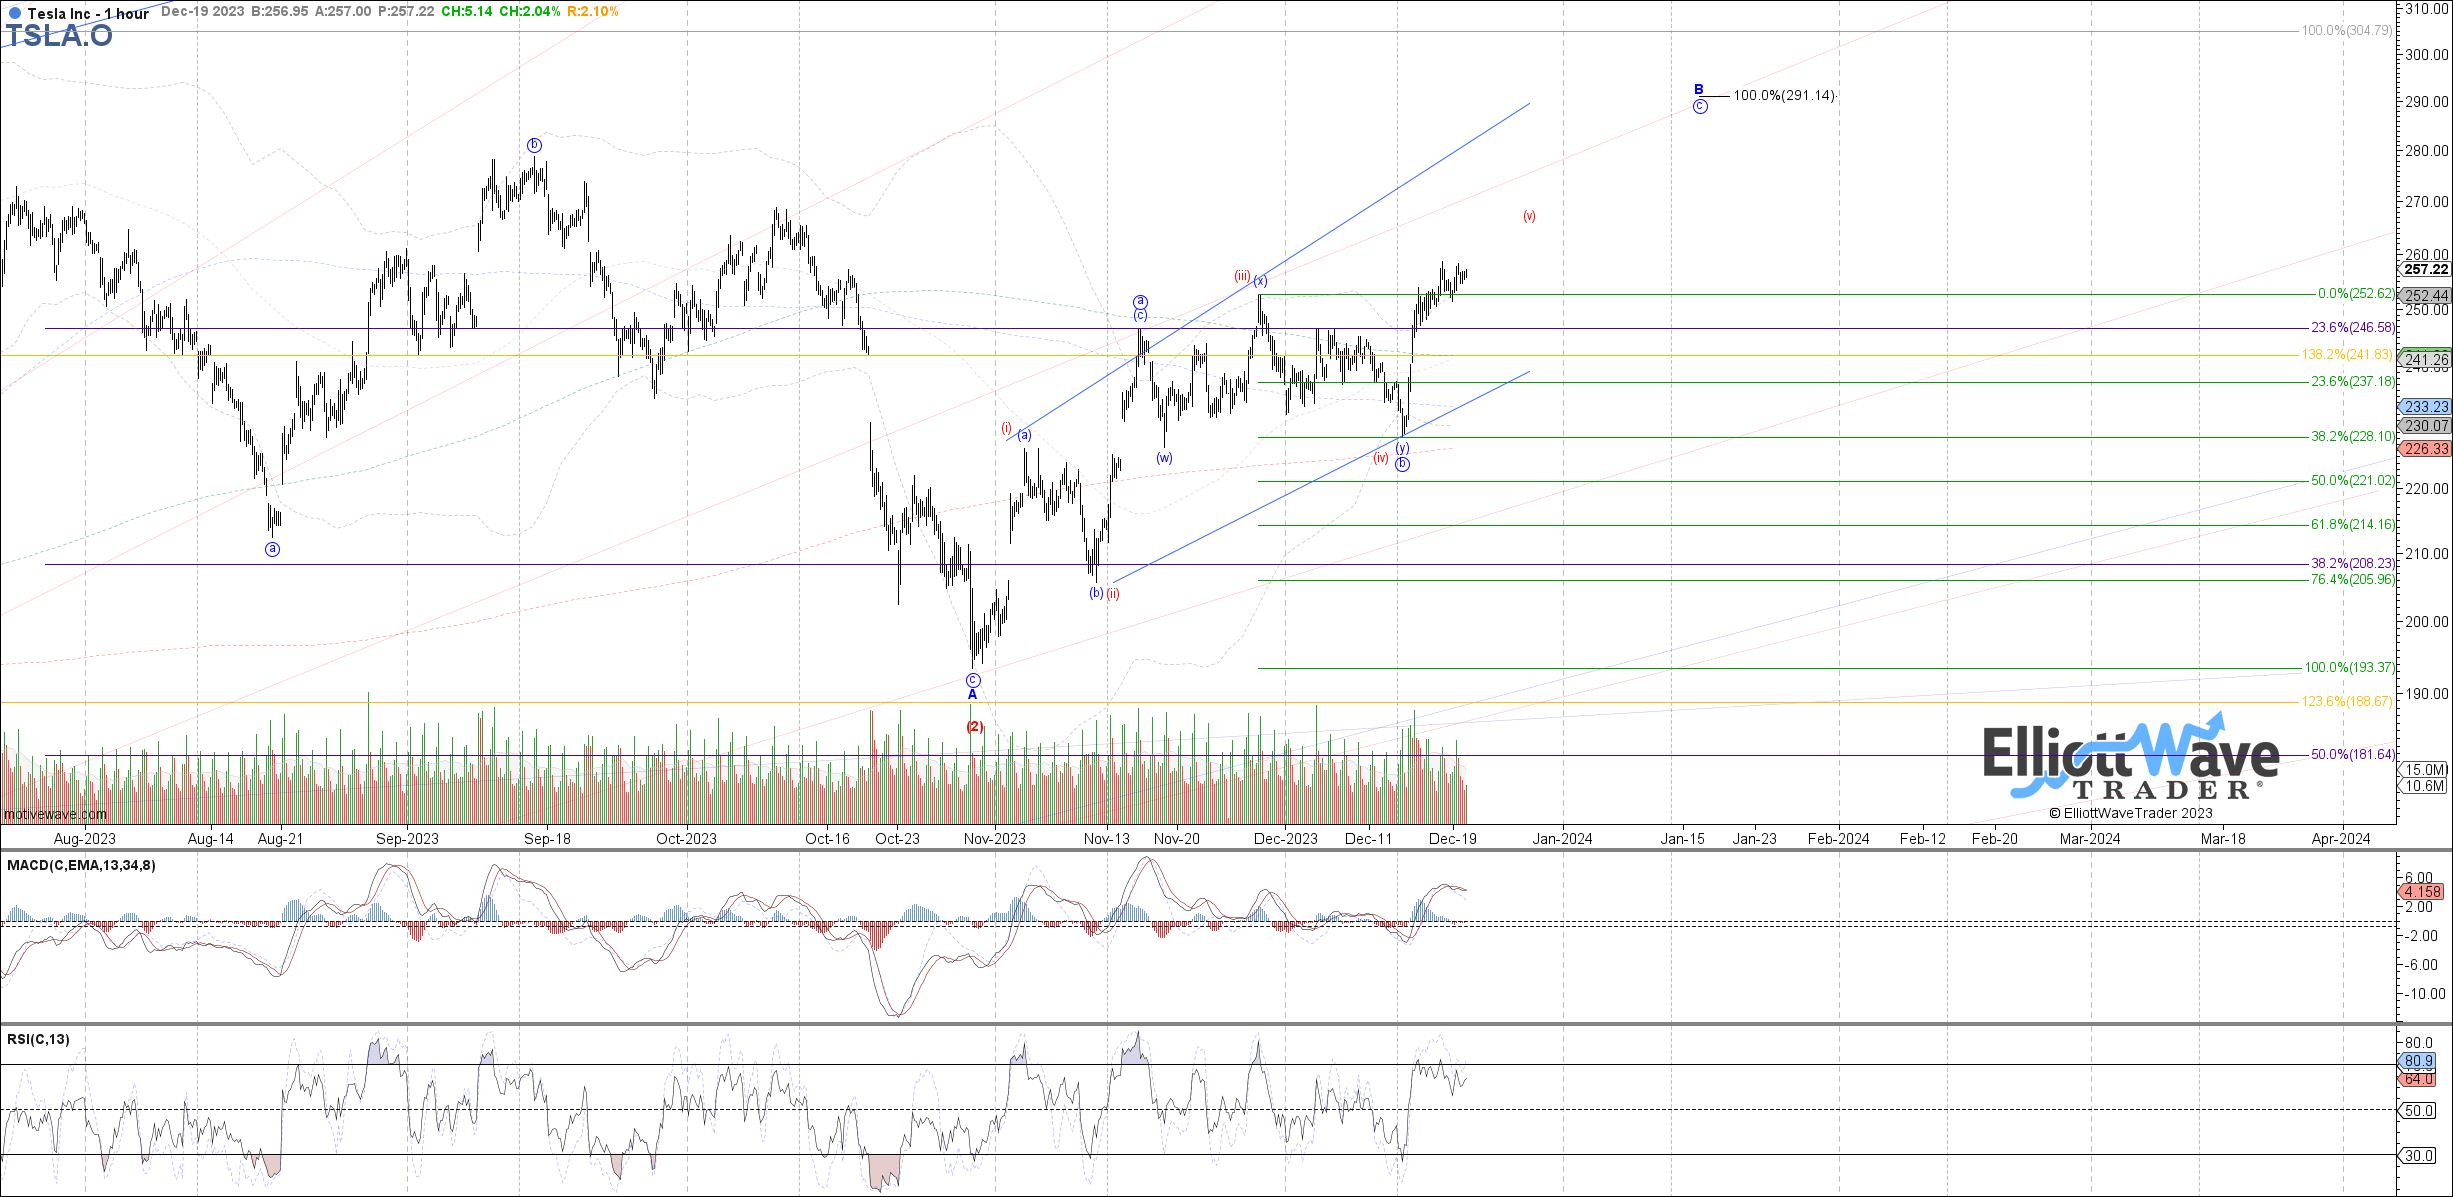
As you can see on Garrett’s chart, there are a few paths that he is currently tracking. Should price take out 260 in the near term, then 270 is up next as the target. Support is 240. If price takes out 226 then a deeper correction is in the offing.
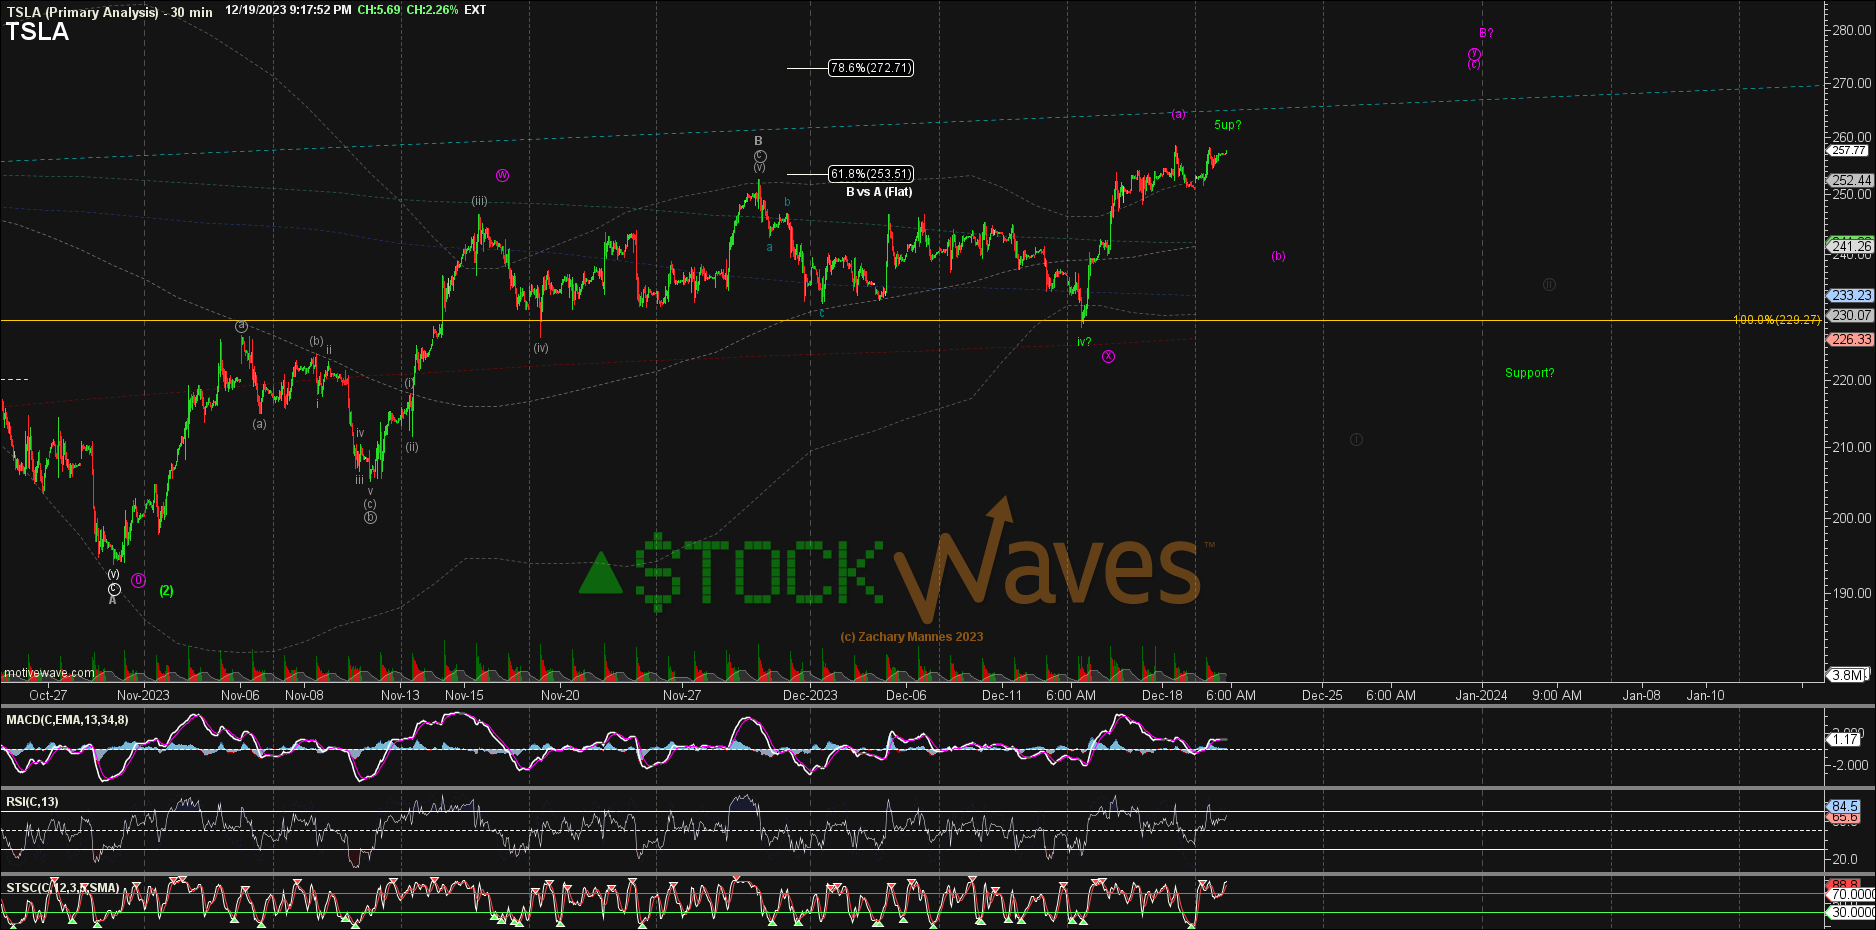
Zac Mannes shows a similar path but also proffers the possibility of a bigger ‘B’ wave bounce that could take price to as high as 280 - 290 next.
You know what? Right now is a great moment to do nothing until clarity once again manifests itself. Ergo, the ‘hold’.
(RIVN) is in a similar position.
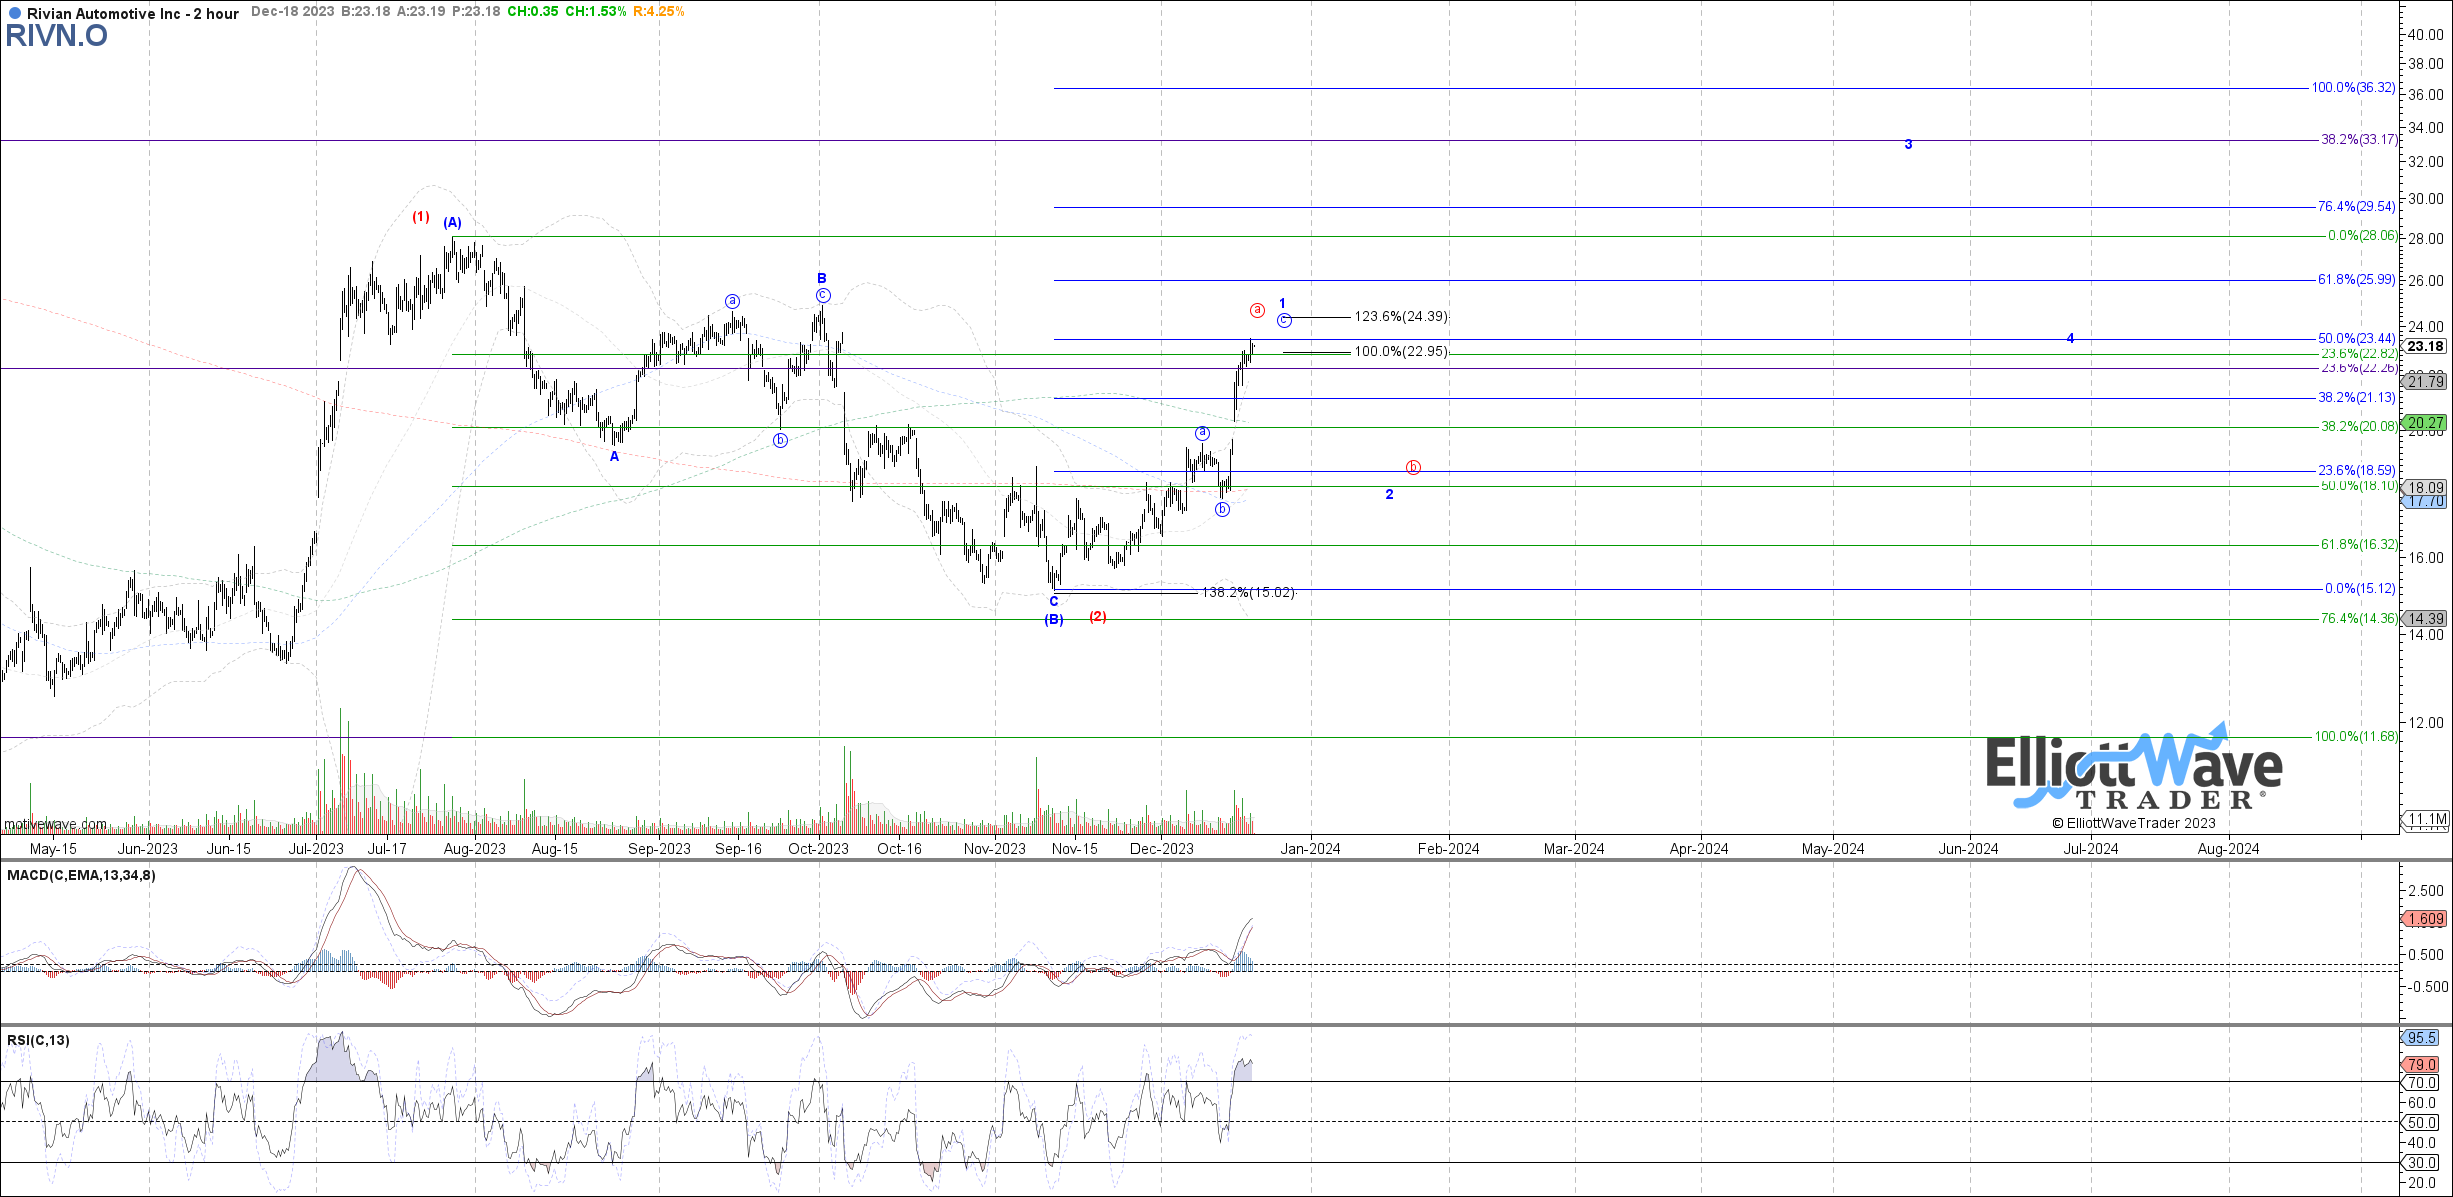
Note Garrett shows this is likely a diagonal. Price may fill out higher levels but must hold the 18 level and take out resistance at 25 next.
When ‘Hold’ Is Not Enough
The ‘Buy’, ‘Hold’, ‘Sell’ characterization is necessary. We understand this. However, it does not allow for the nuances of sentiment. Markets are non-linear, fluid and dynamic in nature. This means that much like humans, they can at times appear unpredictable. ‘Hold’ does not mean we are actually doing ‘nothing’. It does tell the reader though that this stock really can go either way at the moment.
We have been taking advantage of short term opportunities with success and defined risk. But the bigger picture being painted now is fraught with fogginess. This comes as no surprise to our followers and members.
Zac Mannes has explained the ‘why’. “I have it in a Primary Wave 5 of Cycle III up off the January 2023 low. Since wave [1] was only an ABC up, that P.5 is an ending diagonal.”
OK, Zac - please break that down into something I can easily chew on. Remember that markets are fractal in nature and that these patterns repeat at all degrees. Zac is simply discussing the degrees and context of where we currently find ourselves. To boil it down, this last leg of a much larger rally structure is likely a diagonal. The price action will be choppy and less straightforward than a standard impulse rally.
Context Is Key
Just knowing that we are likely inside of a larger diagonal for this portion of the entire rally structure tells us to expect chop and uncertainty to a degree. This was not the case in the prior rally phase which was a standard and straightforward structure.
Remember too that TSLA, and RIVN for that matter, is a highly emotional issue. Sentiment will push and pull them in apparently irrational fashion. Accept this and simply recognize that there will be moments of uncertainty.
For those that are long-time holders of TSLA and are absolutely convinced that they will conquer the world, then this information can be highly useful to hedge at key points or even get more aggressive when opportunities come to bear.
An Extra Bonus From The Fibonacci Queen - Carolyn Boroden
Carolyn is a world-renowned technical analyst and author of “Fibonacci Trading - How To Master The Time And Price Advantage”, published by McGraw-Hill in early 2008. She has been involved in the trading industry since 1978, starting on the floor of the Chicago Mercantile Exchange. She is often featured on the "Off The Charts" segment of CNBC's Mad Money with Jim Cramer.
As one of our analysts, she shared this chart and commentary in our trading room a few days ago:
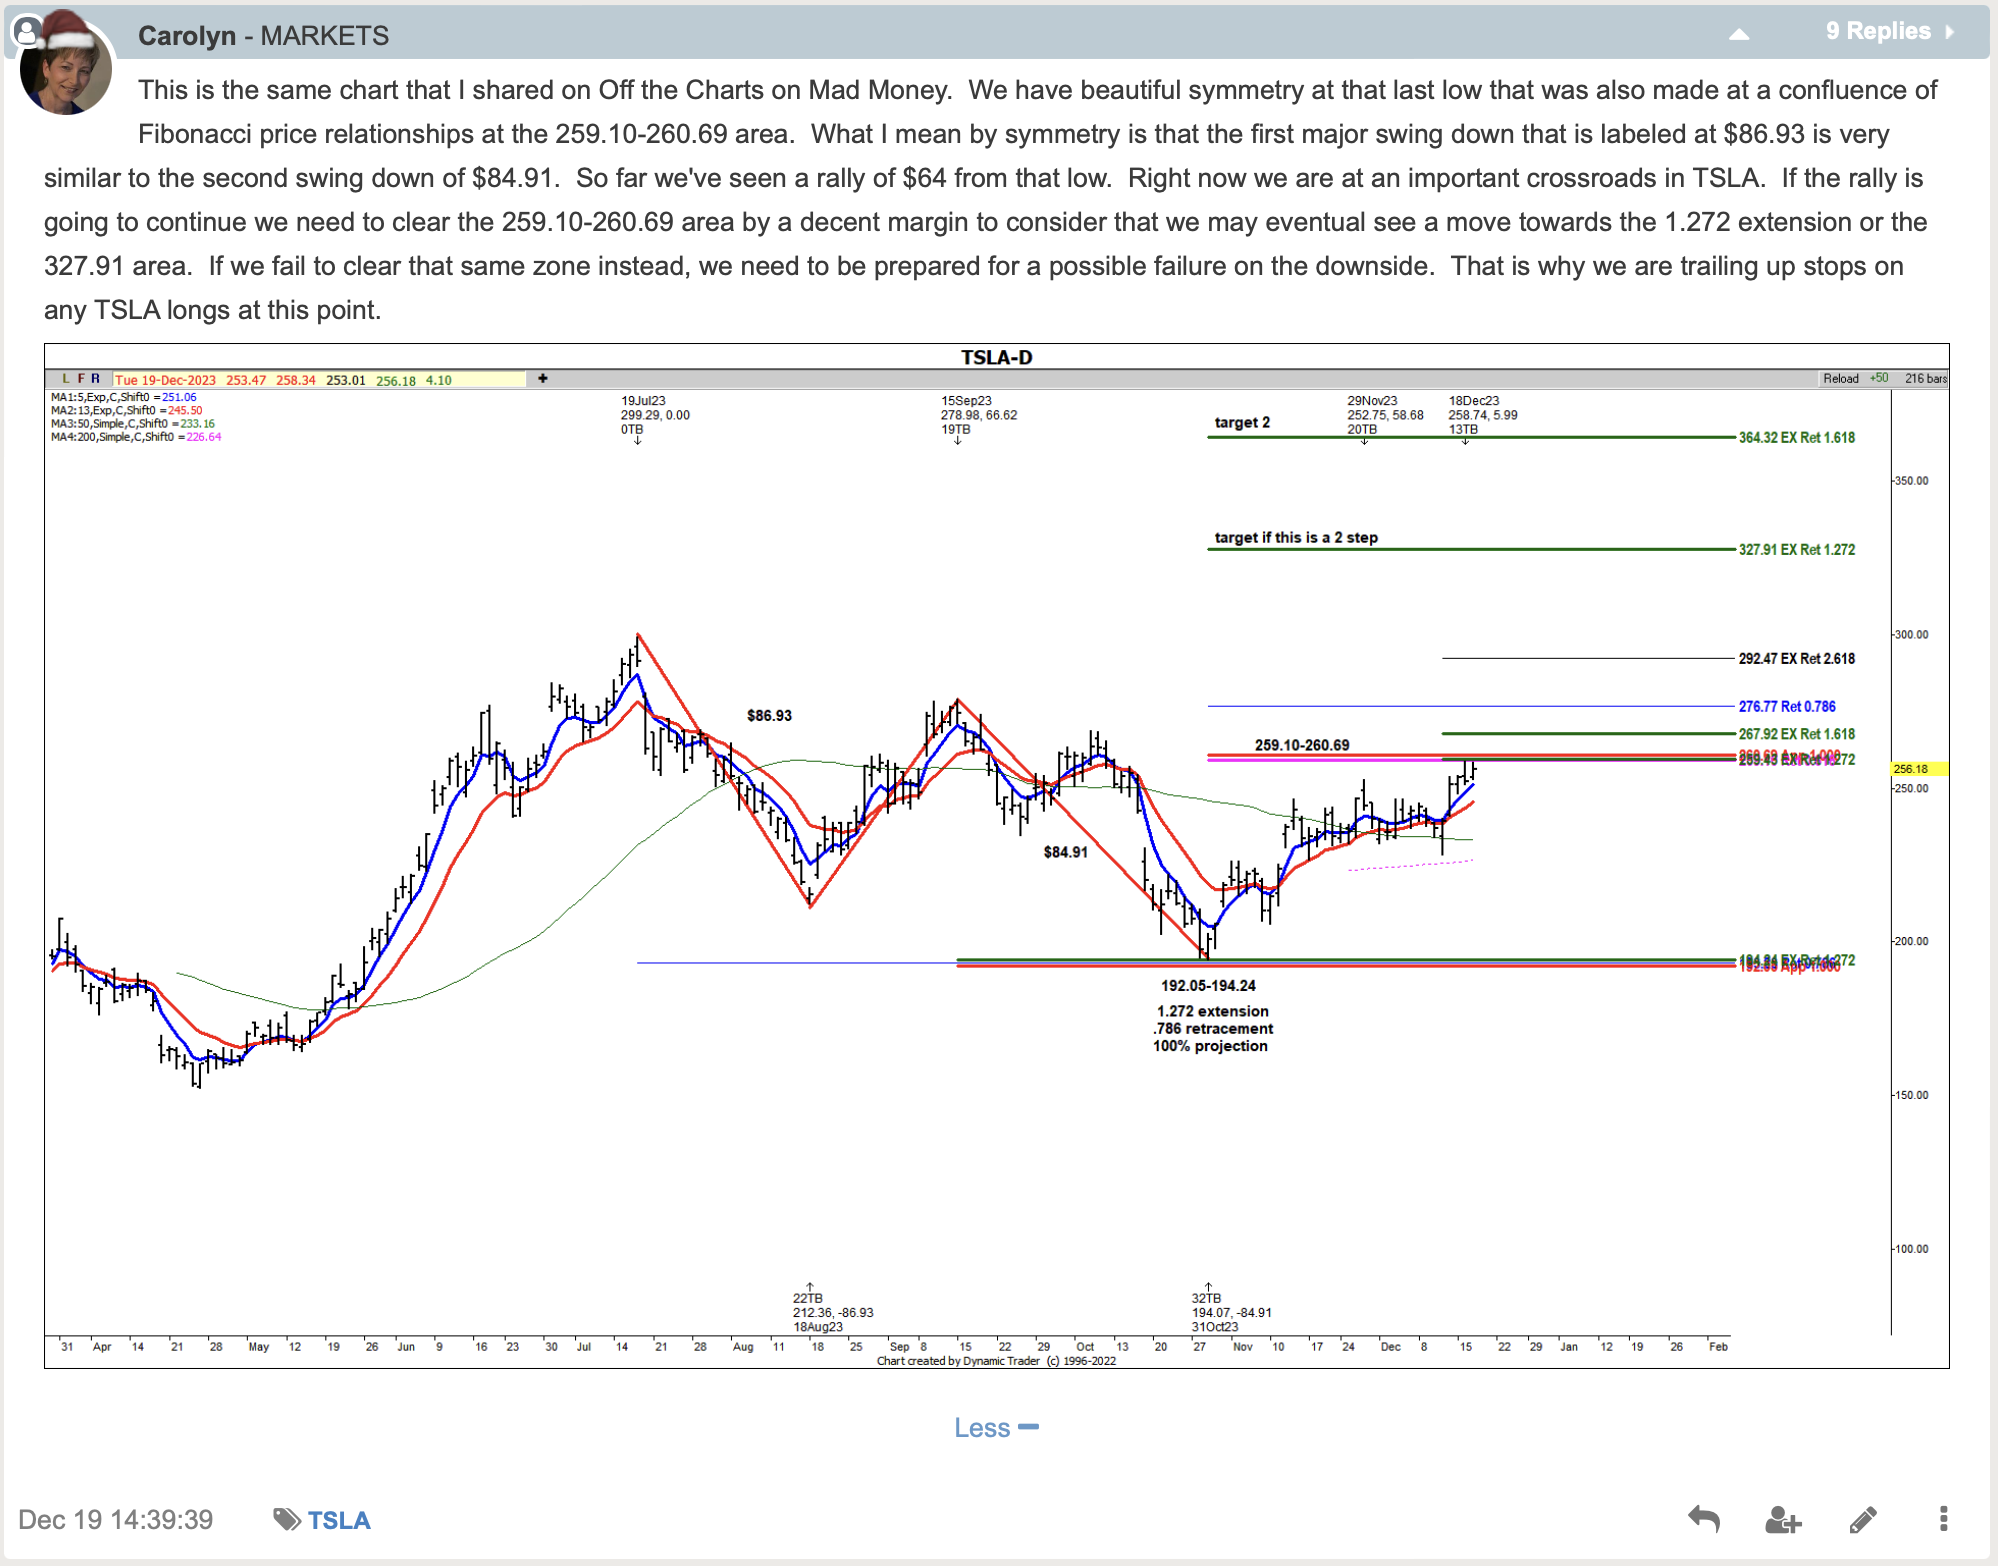
Note that her work will often overlap and complement our own methodology that uses Elliott Wave Theory. As you can surmise from her post, TSLA is indeed at a key juncture in the near term. Where will it go next? Price is the ultimate arbiter of that question. We have our specific levels to determine likelihood.
Conclusion
Yes, there are nuances to the analysis. Once familiar with our methodology, our members discover a powerful ally on their side to provide guidance and risk management in their trading/investing.
There are many ways to analyze and track stocks and the market they form. Some are more consistent than others. For us, this method has proved the most reliable and keeps us on the right side of the trade much more often than not. Nothing is perfect in this world, but for those looking to open their eyes to a new universe of trading and investing, why not consider studying this further? It may just be one of the most illuminating projects you undertake.
