TJX/ROST/BURL: Bargain Shoppers Best Look Elsewhere For Now
 By
Levi
By
Levi
By Levi at Elliott Wave Trader; Produced with Avi Gilburt
How do we apparently just make a blanket statement like that? I assure you this is not some ephemeral emotion or blind bias driven by feelings. The conclusion is grounded in company-specific fundamentals and crowd behavior as reflected in the charts. Would you like to know more? Let’s walk through the evidence.
Lyn Alden Discusses The Fundamental Snapshot For Retailers
“I have a neutral stance on the three of them and would defer to technicals.
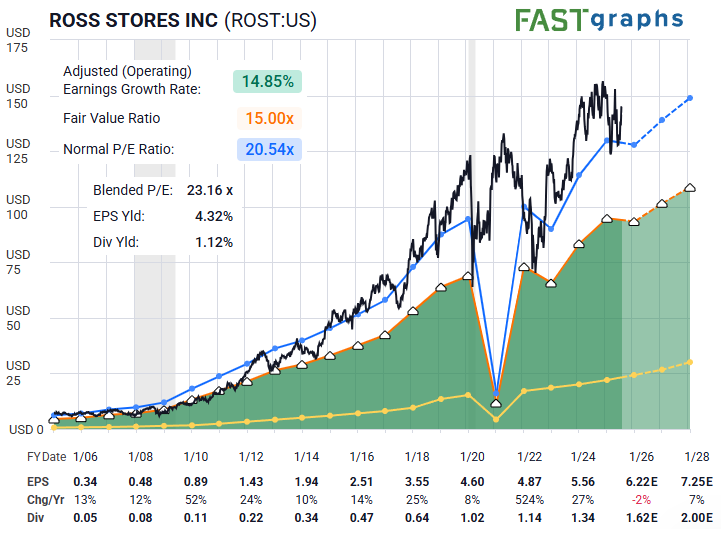
Out of the budget retailers I track, ROST is potentially the most investable at current levels. It has a decent balance sheet and solid operations, but its valuation gives investors no margin for error. It could comfortably fall 20% and not be undervalued per se.
Tariff uncertainty adds another layer of complexity, which would be more interesting to track if the price was at a cheaper starting point.
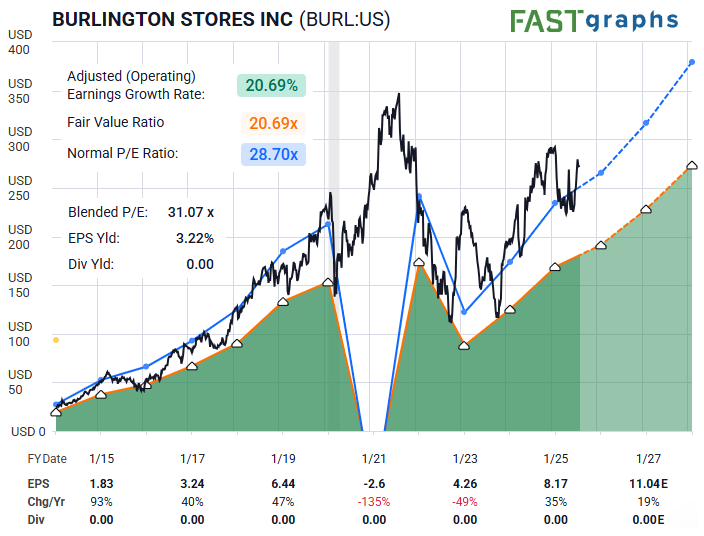
BURL doesn't have the balance sheet strength of TJX or ROST, and yet isn't trading at a discount that would make it interesting to me as a value play, and so I watch it from the sidelines. The bull argument is that it's the smallest and fastest growing of the three big off-price retailers, but an investor better be sure about its growth potential, since a margin of safety isn't present.
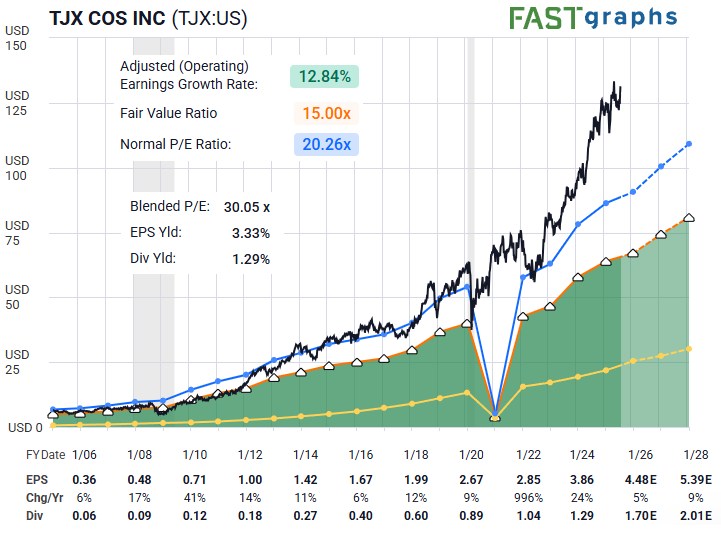
TJX has surged to a valuation that I find somewhat hard to justify, especially with tariff uncertainty and other complications. Good company, good balance sheet, but best to wait for corrections.”
Lyn’s expertise gives us a clear snapshot of the current fundamental backdrop. But what about the market’s collective psychology? Yes, crowd behavior speaks through the structure of price on the charts. We can use this structure to look at the selected tickers from a probabilistic point of view. What’s the purpose of such an exercise? Read on and we’ll discuss it together.
Listening To The Structure Of Price
So how does that exactly work? Avi Gilburt has studied this field in depth and frequently shares his findings with members and the public via presentations and articles. Here is a brief excerpt from an introductory article regarding why he chooses to use Elliott Wave in his own analysis and investing decisions. This piece discussed how Elliott Wave can actually provide forward-looking predictive value. Wait - say that again? Let’s look at his comment and then discern what it means for us.
“This is exactly why I use Elliott Wave in my analysis. In theory, it understands that public sentiment and mass psychology moves in 5 waves within a primary trend, and 3 waves in a counter-trend. Once a 5 wave move in public sentiment is completed, then it is time for the subconscious sentiment of the public to shift in the opposite direction, which is simply a natural cause of events in the human psyche, and not the operative effect from some form of ‘news’.
This mass form of progression and regression seems to be hard wired deep within the psyche of all living creatures, and that is what we have come to know today as the ‘herding principle’.” - Avi Gilburt
Boiled down: Wave C follows Wave B, just as Wave 3 follows Wave 2. Recognizing these patterns—repeating fractally across all timeframes—gives us a probabilistic edge.
Easy enough, right? But the mastery of the theory is how to identify these waves via their structure. These waves will repeat and show self-similarity at all degrees of the structure - and therein lies the power of Elliott Wave Theory in action. Let’s do this with real world examples.
Theory In Action
We will take each of the three tickers mentioned and see what the structure of price on each respective chart is telling us right now. Ready? Here we go.
Lyn mentioned that ROST is “potentially the most investable at current levels”. However, there is the issue of valuation risk. What does sentiment have to say about that?
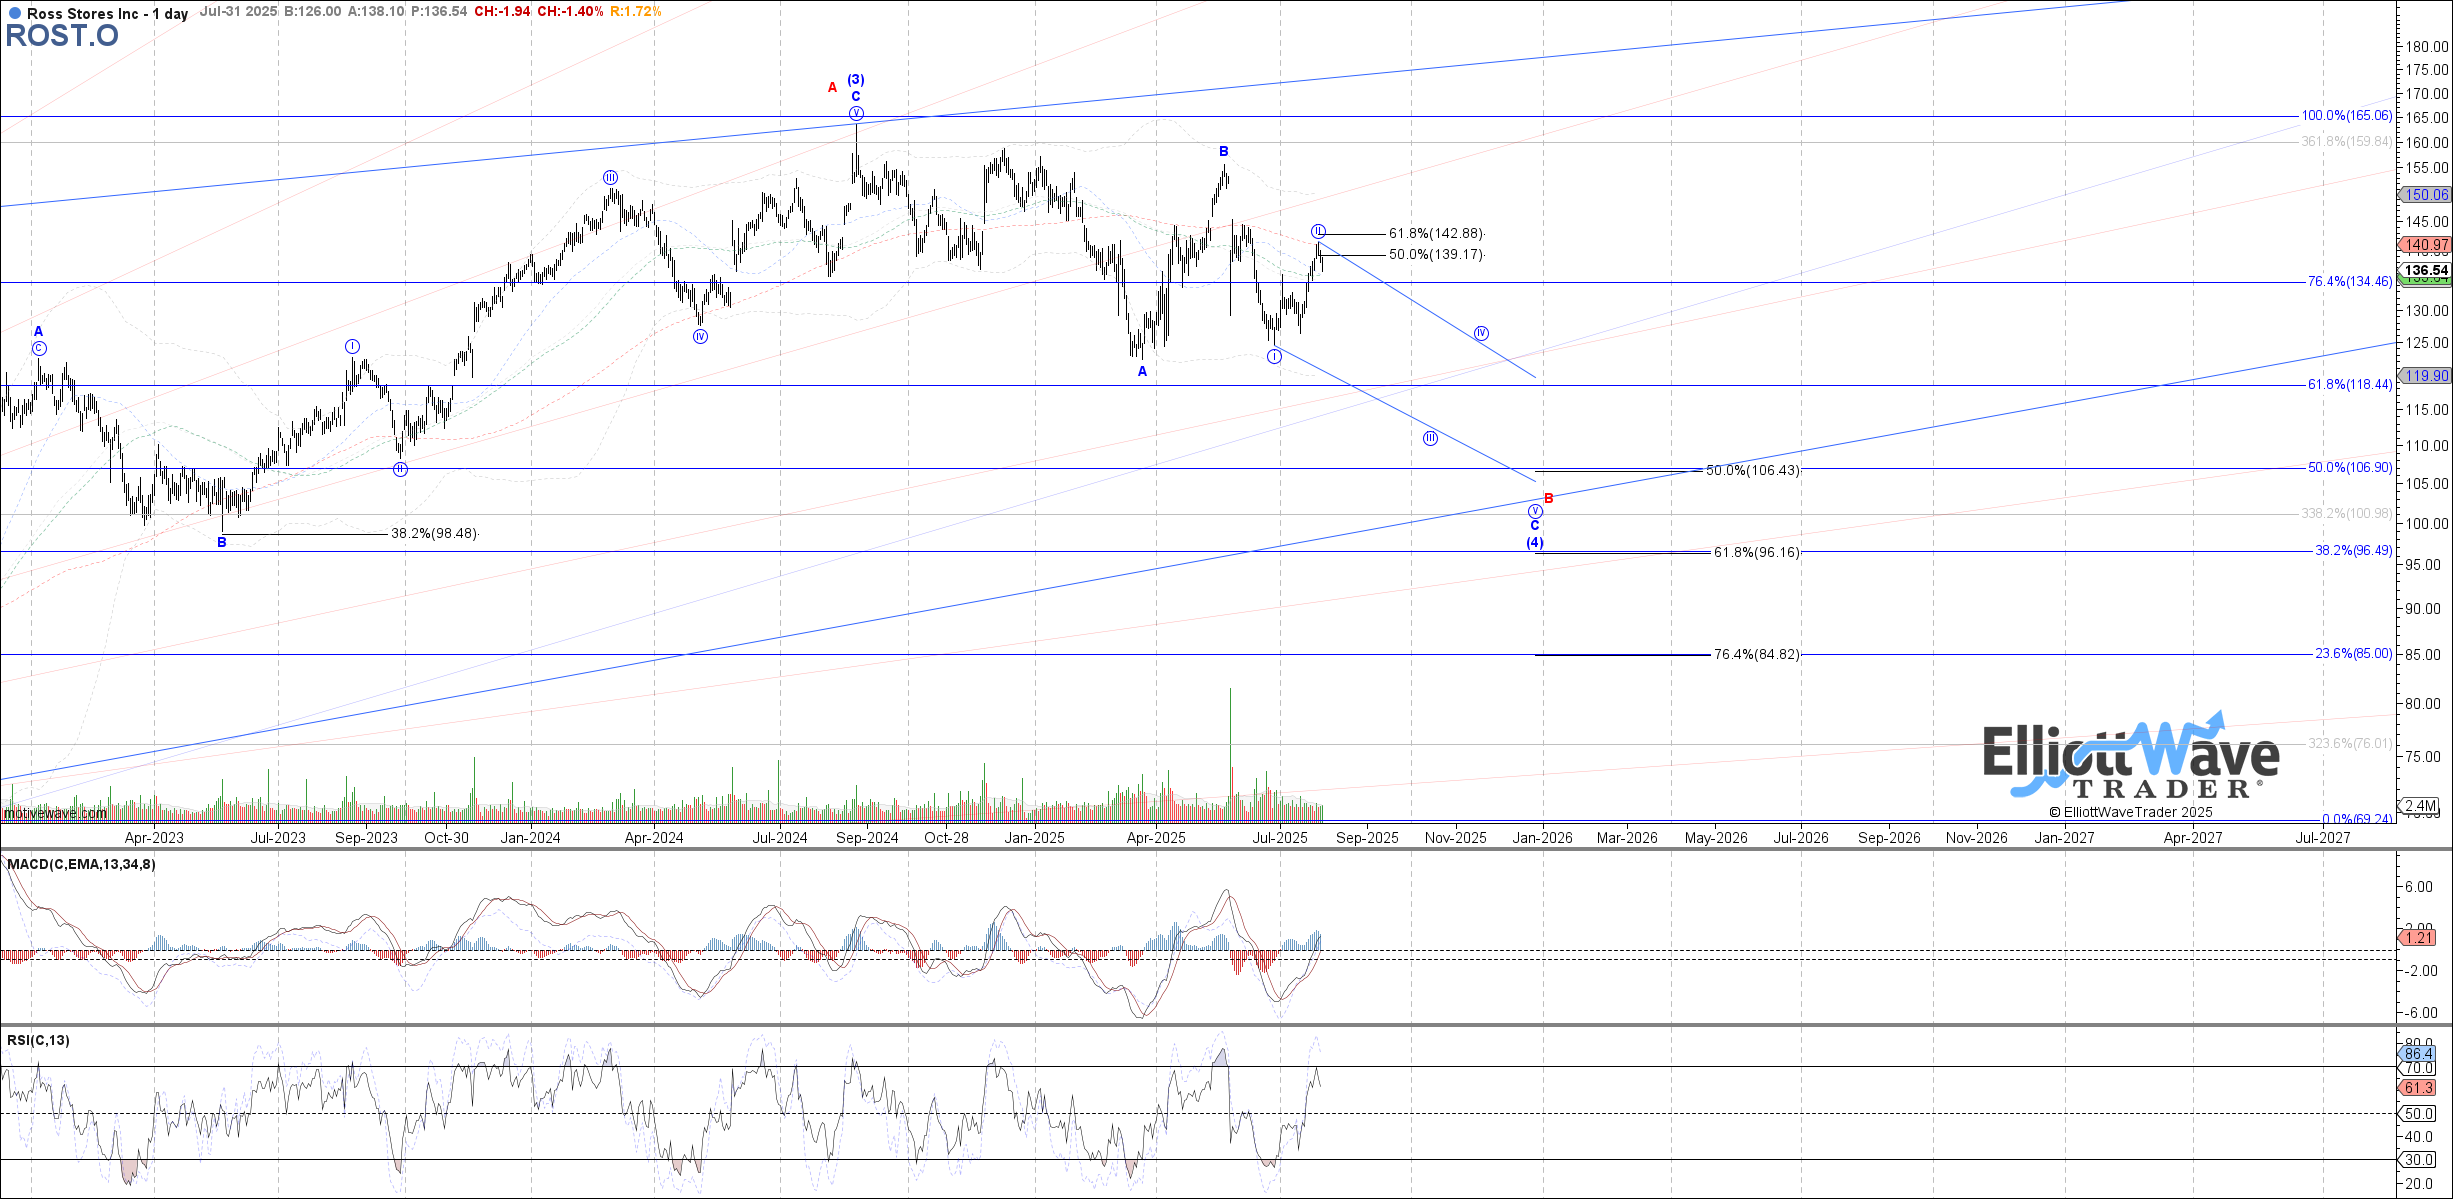
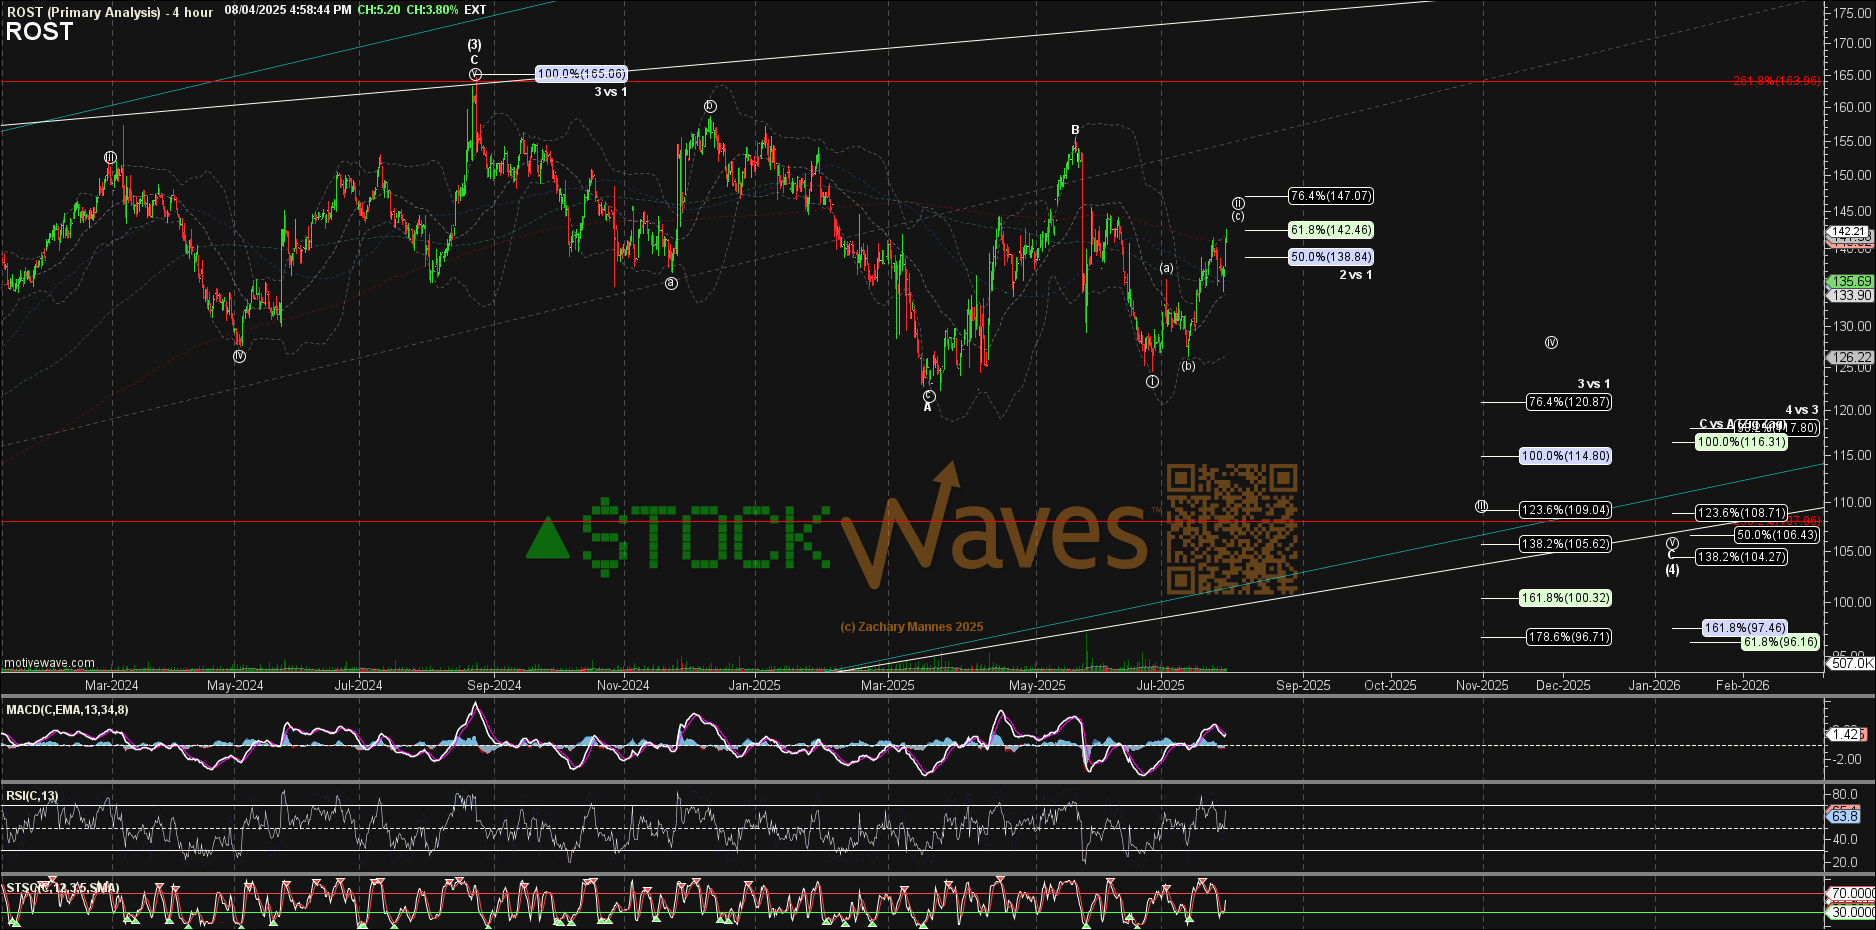 Note that Garrett has this as a wave (4) correction at the moment. What about Zac? Check. They are in alignment in their respective assessments. While a trader may not outright short the stock or try a bearish options play, it is enough of a warning that we would not be looking at a bullish setup for now.
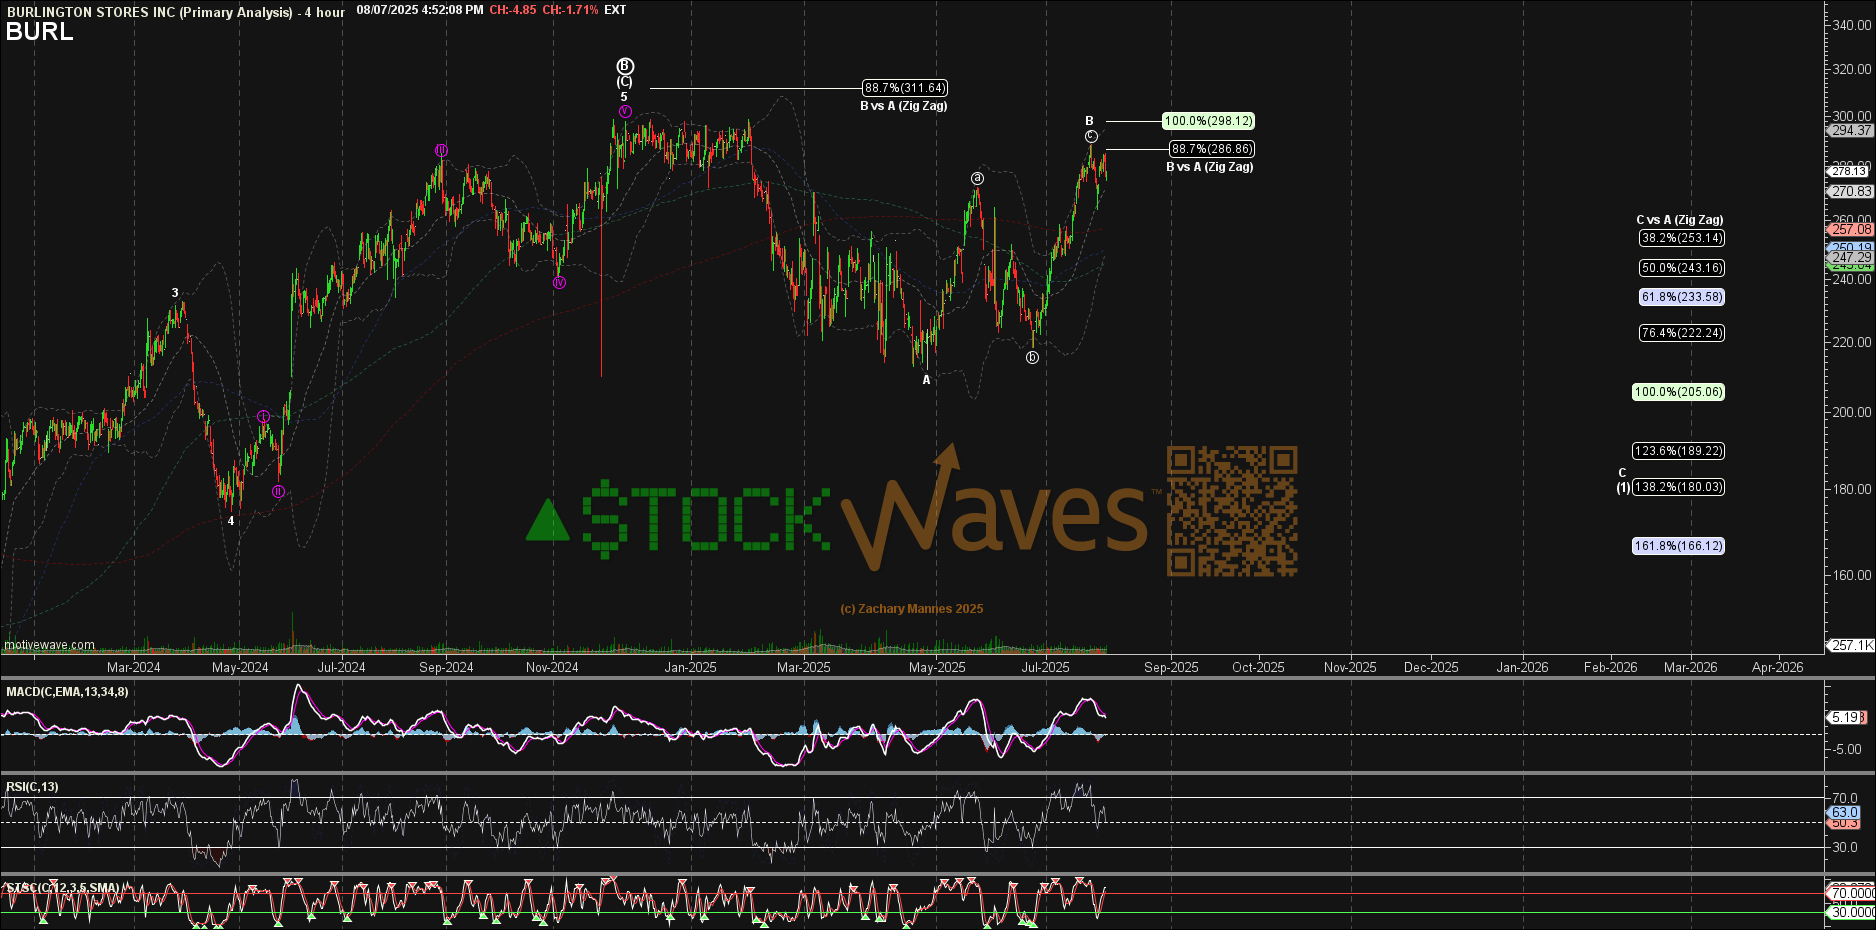
This one is in a similar stance as ROST but may even have a deeper pullback or longer corrective phase ahead of it. Note that Zac is showing the last high as a Primary Wave ‘B’. And just as 3 follows 2 in the numerical sequence, ‘C’ follows ‘B’ and we would anticipate a five wave structure for that ‘C’. You can see Zac projecting a wave (1) down of that Primary ‘C’.
Again, the takeaway for us is that BURL is not likely a bullish setup at this juncture.
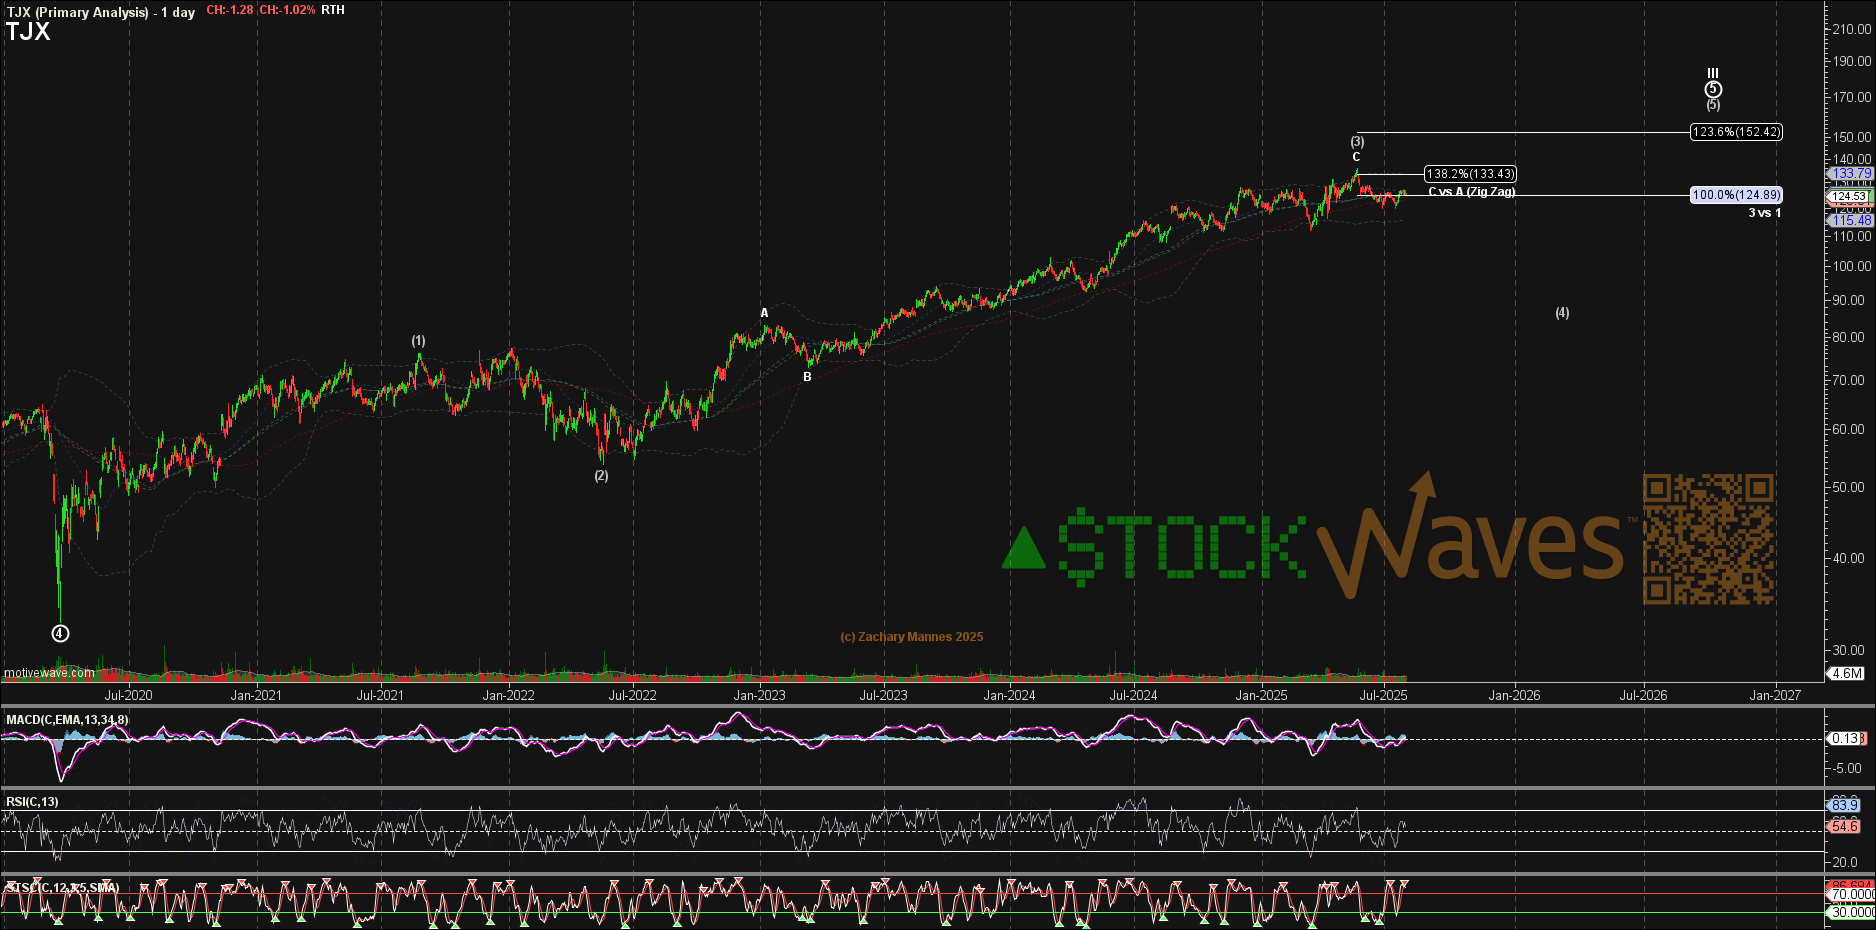
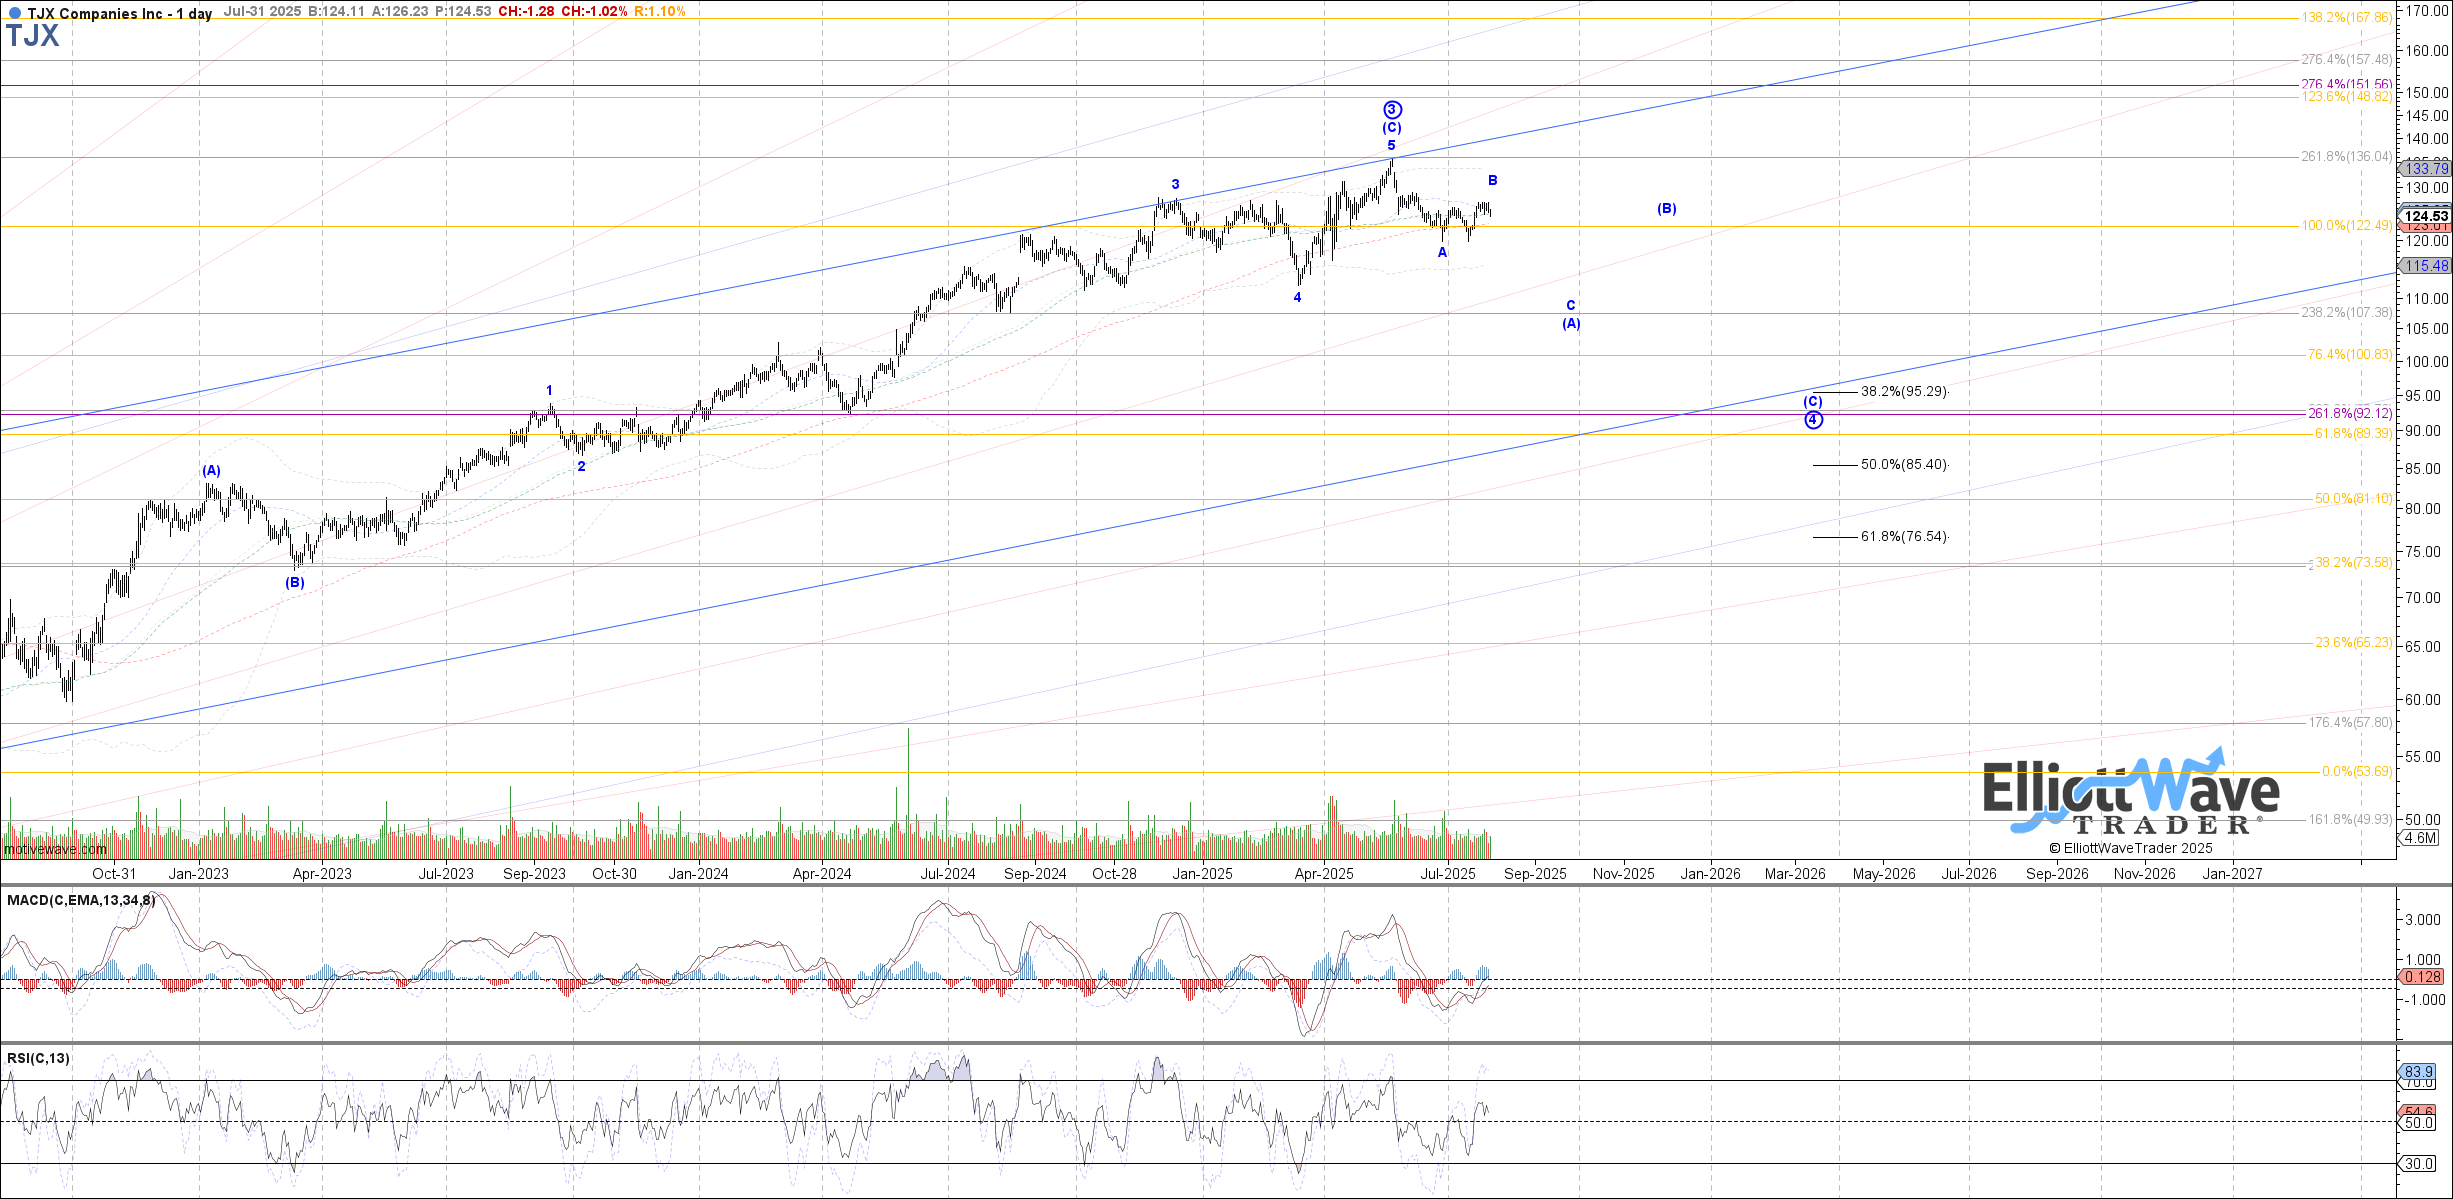
To round out our trio, TJX may just be commencing a more protracted pullback after an absolutely torrid run up from the 2020 lows. Also not a bullish setup here.
How To Use This Information
One of the main advantages of Elliott Wave, when properly applied, is that it can provide market context at any moment. By studying the larger price structure, we can project the most likely future moves. Remember, this is because of the fractal nature of markets and that these wave structures repeat from the small to the large degree.
For this retail triumvirate we are showing that more consolidation/correction is needed before the next probable bullish setup.
Don't Be Turned Off By Misapplication Of This Methodology
Obtaining a true understanding of this methodology takes time and effort. For those willing to invest in said effort, it pays off immensely. Those who are turned off by the words "Elliott Wave" typically have come across those who misapply the theory or are not willing to devote the requisite energies needed to fully harness its power. When applied correctly, Elliott Wave gives traders a repeatable framework for navigating markets with confidence.
Not all paths will play out as illustrated. As mentioned, we view the markets from a probabilistic vantage point. But at the same time, we have specific levels to indicate when it's time to step aside or even change our stance and shift our weight. Over years of usage we have found that this way of analysis will keep us on the right side of the markets more often than not. Come join us and see how we do this every day.
