Still Bearish, but Glimmer of Bottom in Ether
 By
Ryan Wilday
By
Ryan Wilday
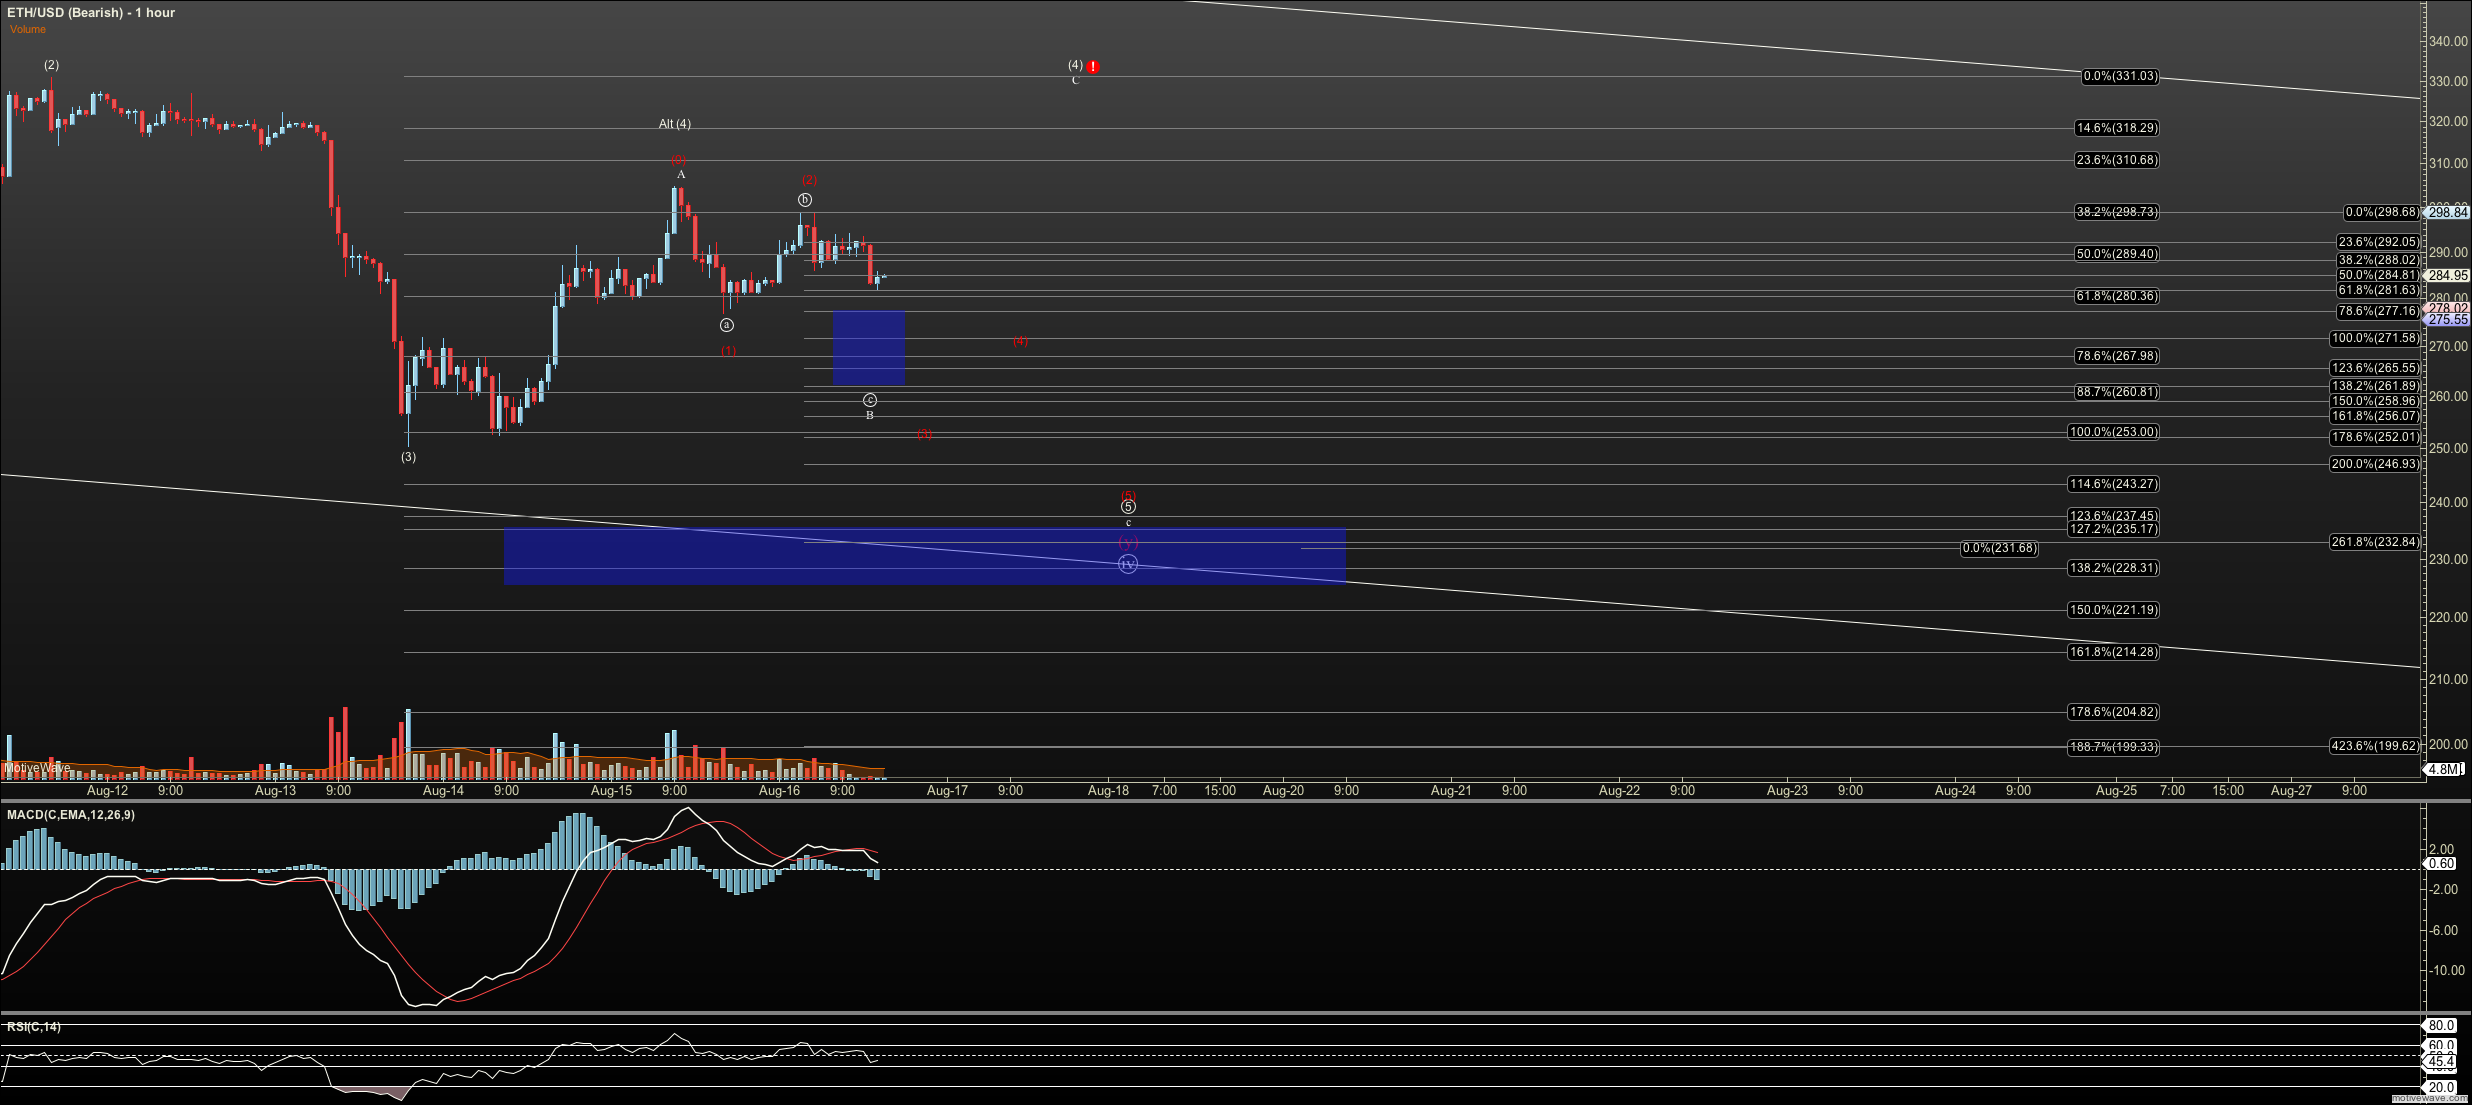
We had a very slow day in the crypto market today, and slow is never fun when you are looking for clarity, particularly when you are looking for a tradable bottom. We're still hovering in a White B or Red 4 of (C) (latter not labeled) in Bitcoin and a suspected wave 4 in Ether. While I'm still bearish primarily, there is a glimmer of a bottom structure in Ether. This is not my primary view, but I've added this alt in today.
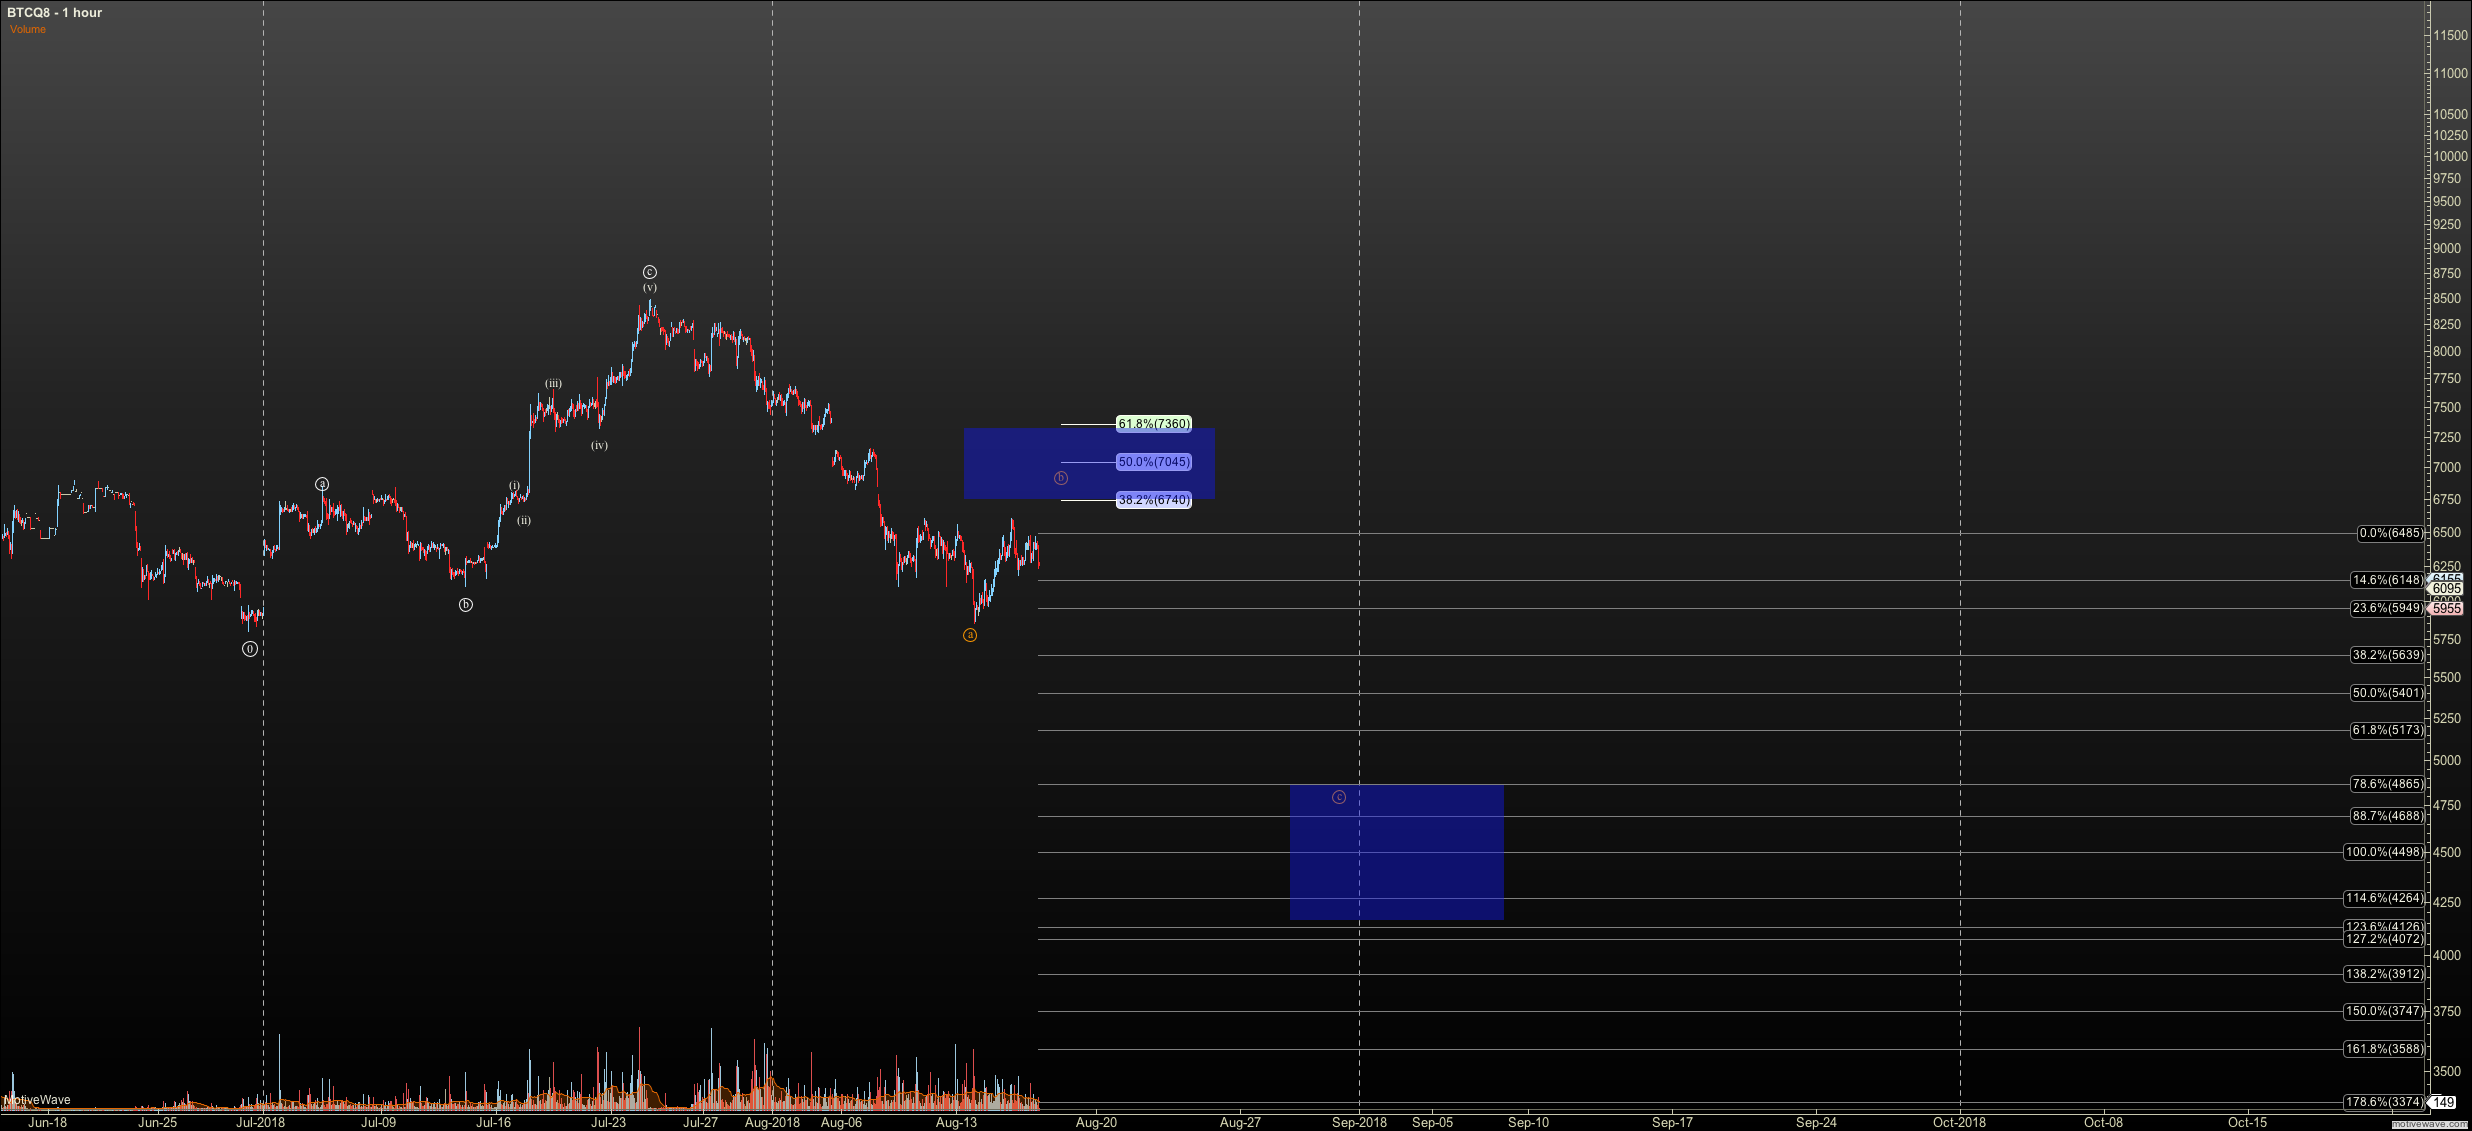
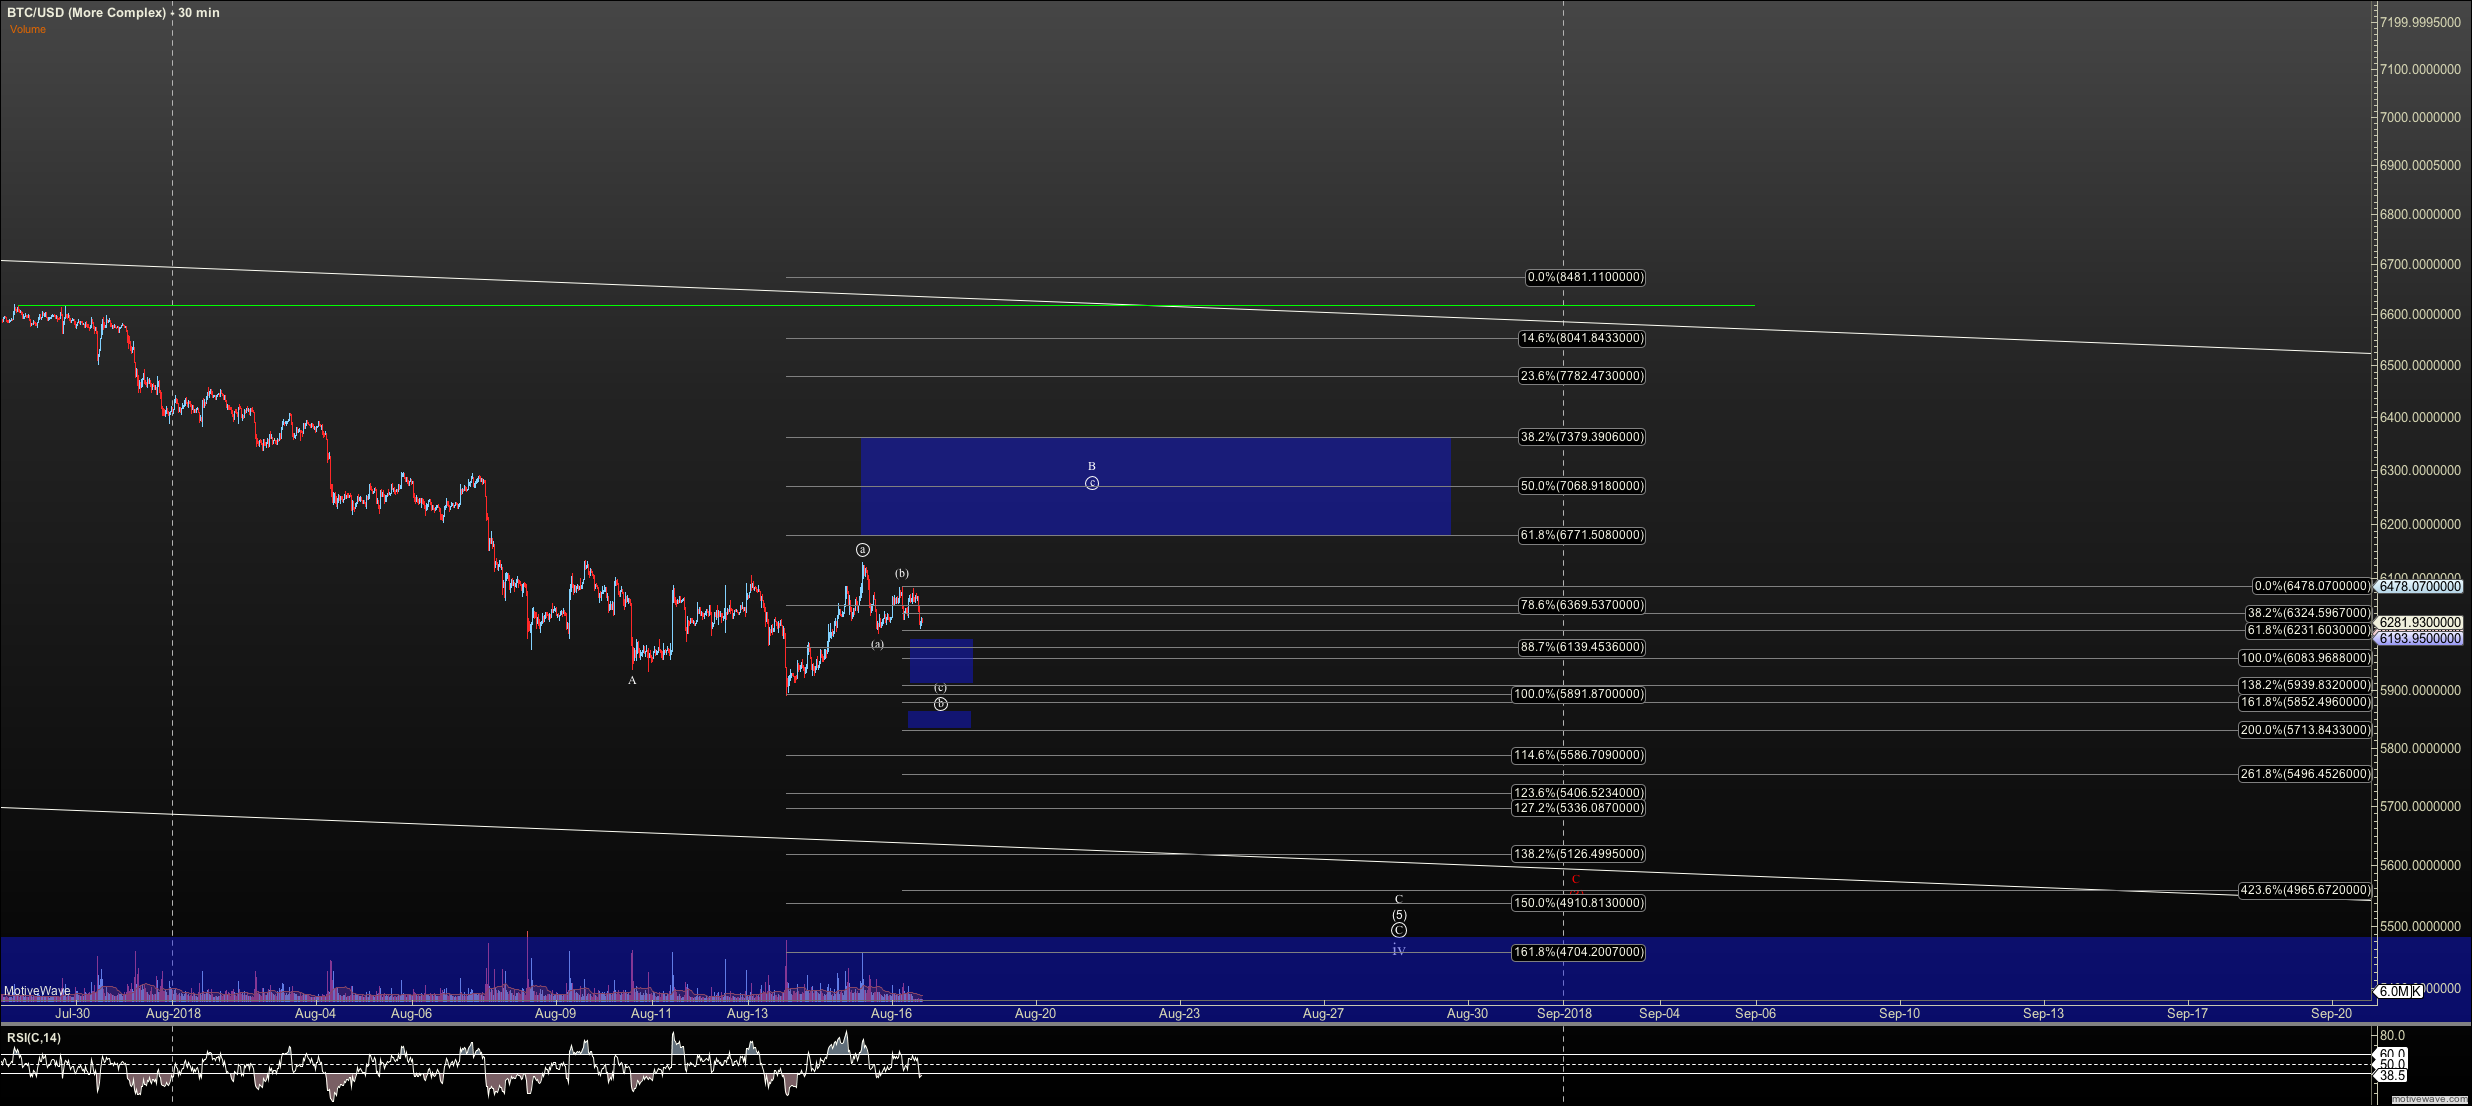
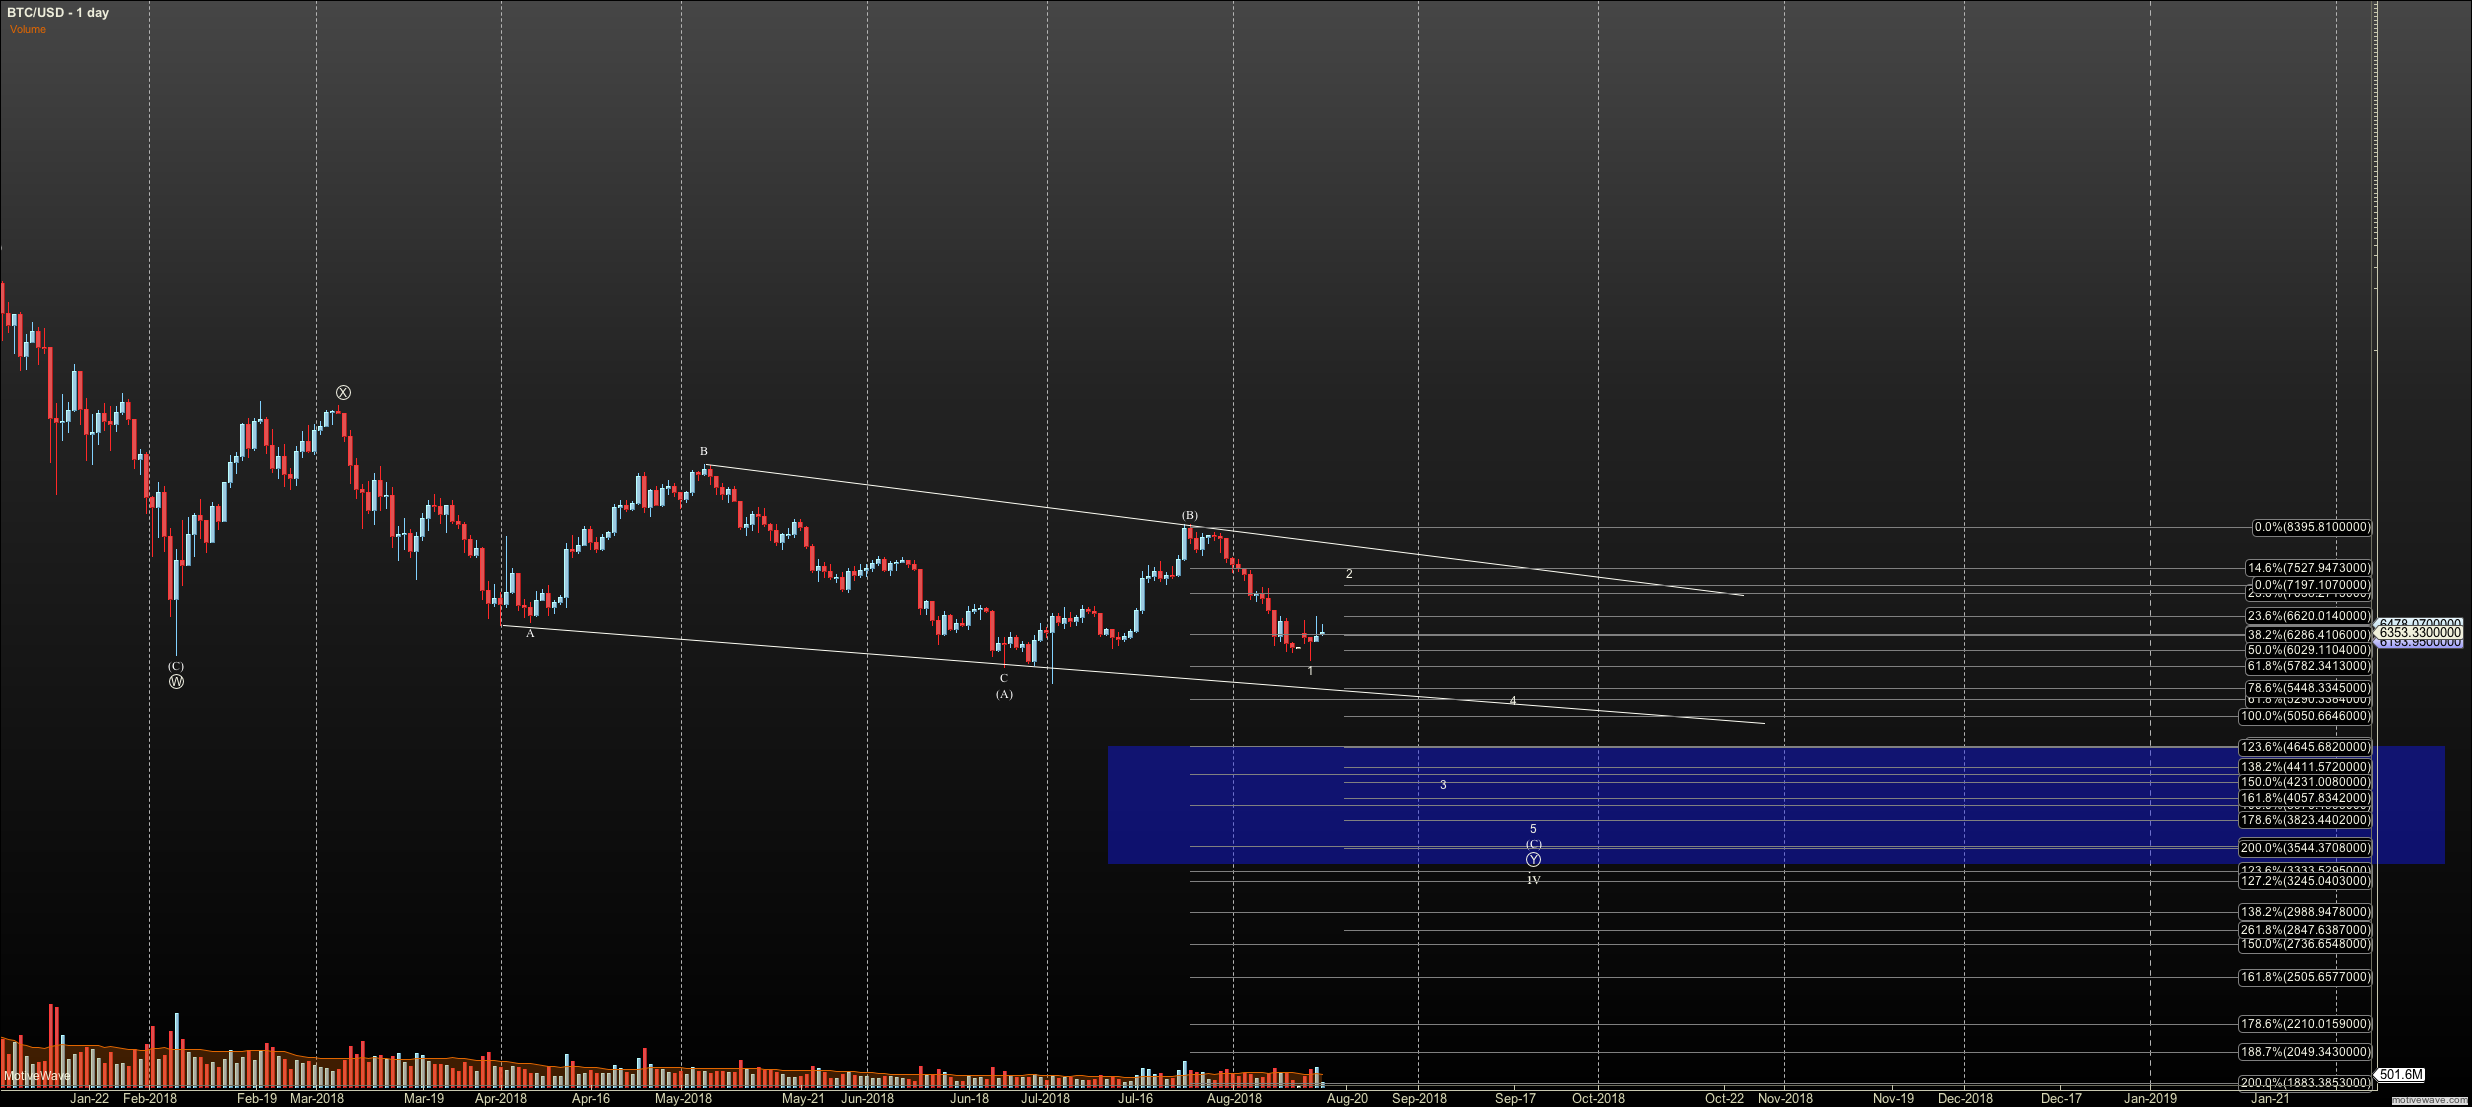
BTCUSD: I see no material change from the structure I saw yesterday, just a sideways job. In micro it appears to be primarily constructed as a 5 down, 3 up within the micro structure, so I still lean bullish. But I may be mistaken with this amount of chop. I have looked at resistance if this is a B wave a little closer today and have it up to $7379. However, for red I have $6889 and not seeing over $6713 is preferred.
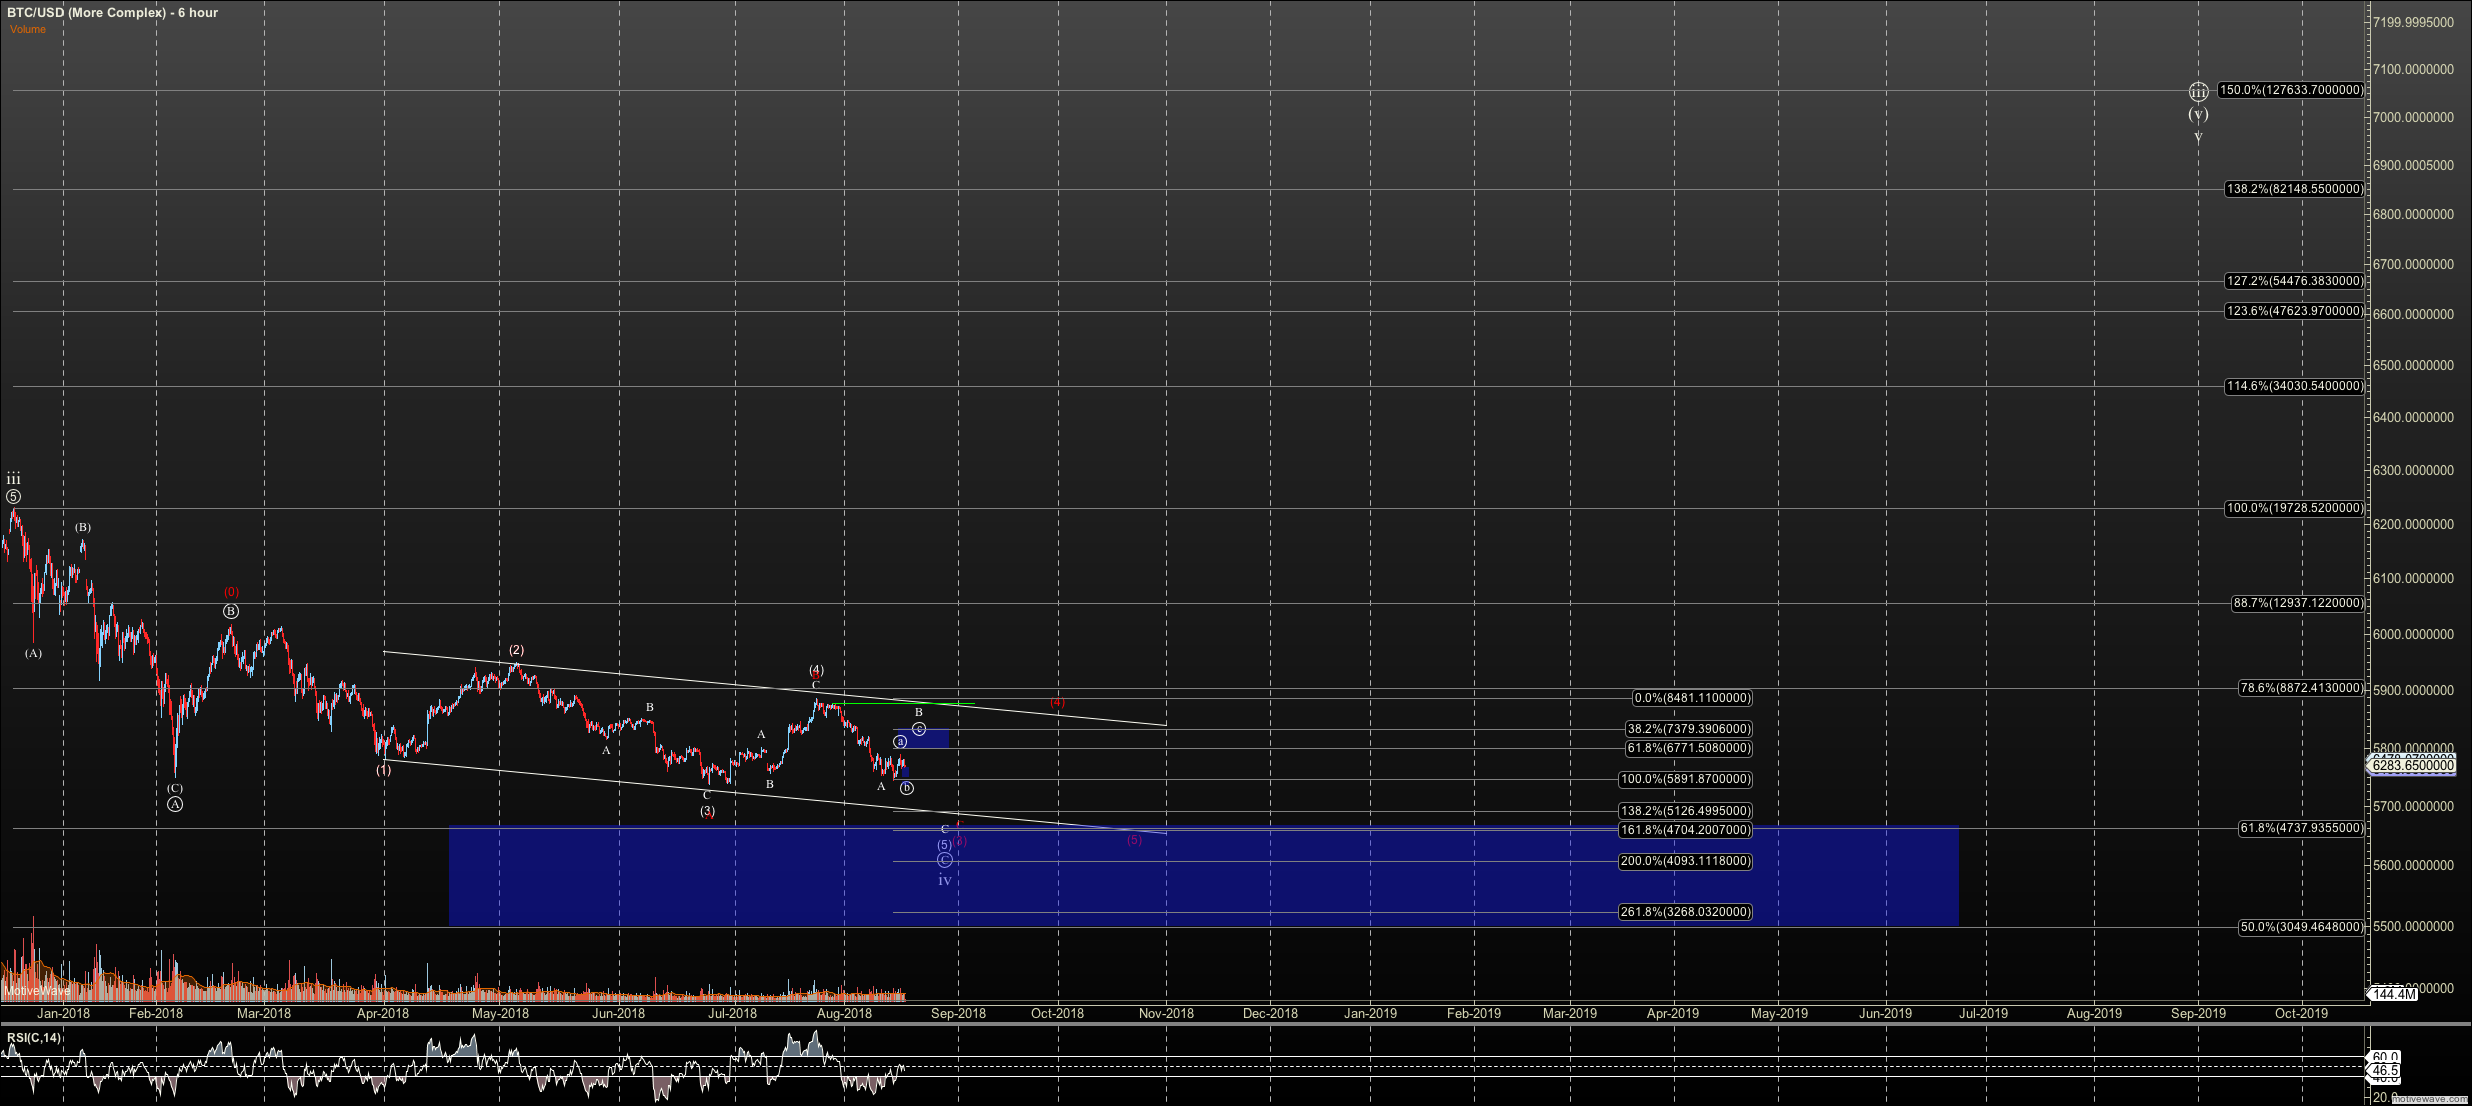
Finally, if you caught the discussion about the weaknesses in my white count in the replies to my article last night, there is a questionable proportion in wave 3 to 1. On close review, that count must stick save $4900 or will be invalid. But upon review, I also played with a WXY count where we really waterfall. This is valid with where we are structurally. And, this can bring an extreme drop to $3500. I have the file labeled waterfall. We can watch that $4900 level for warning. Red should hold that within the channel. Below that by a few hundred and we can see a waterfall. But right now we're just flat.
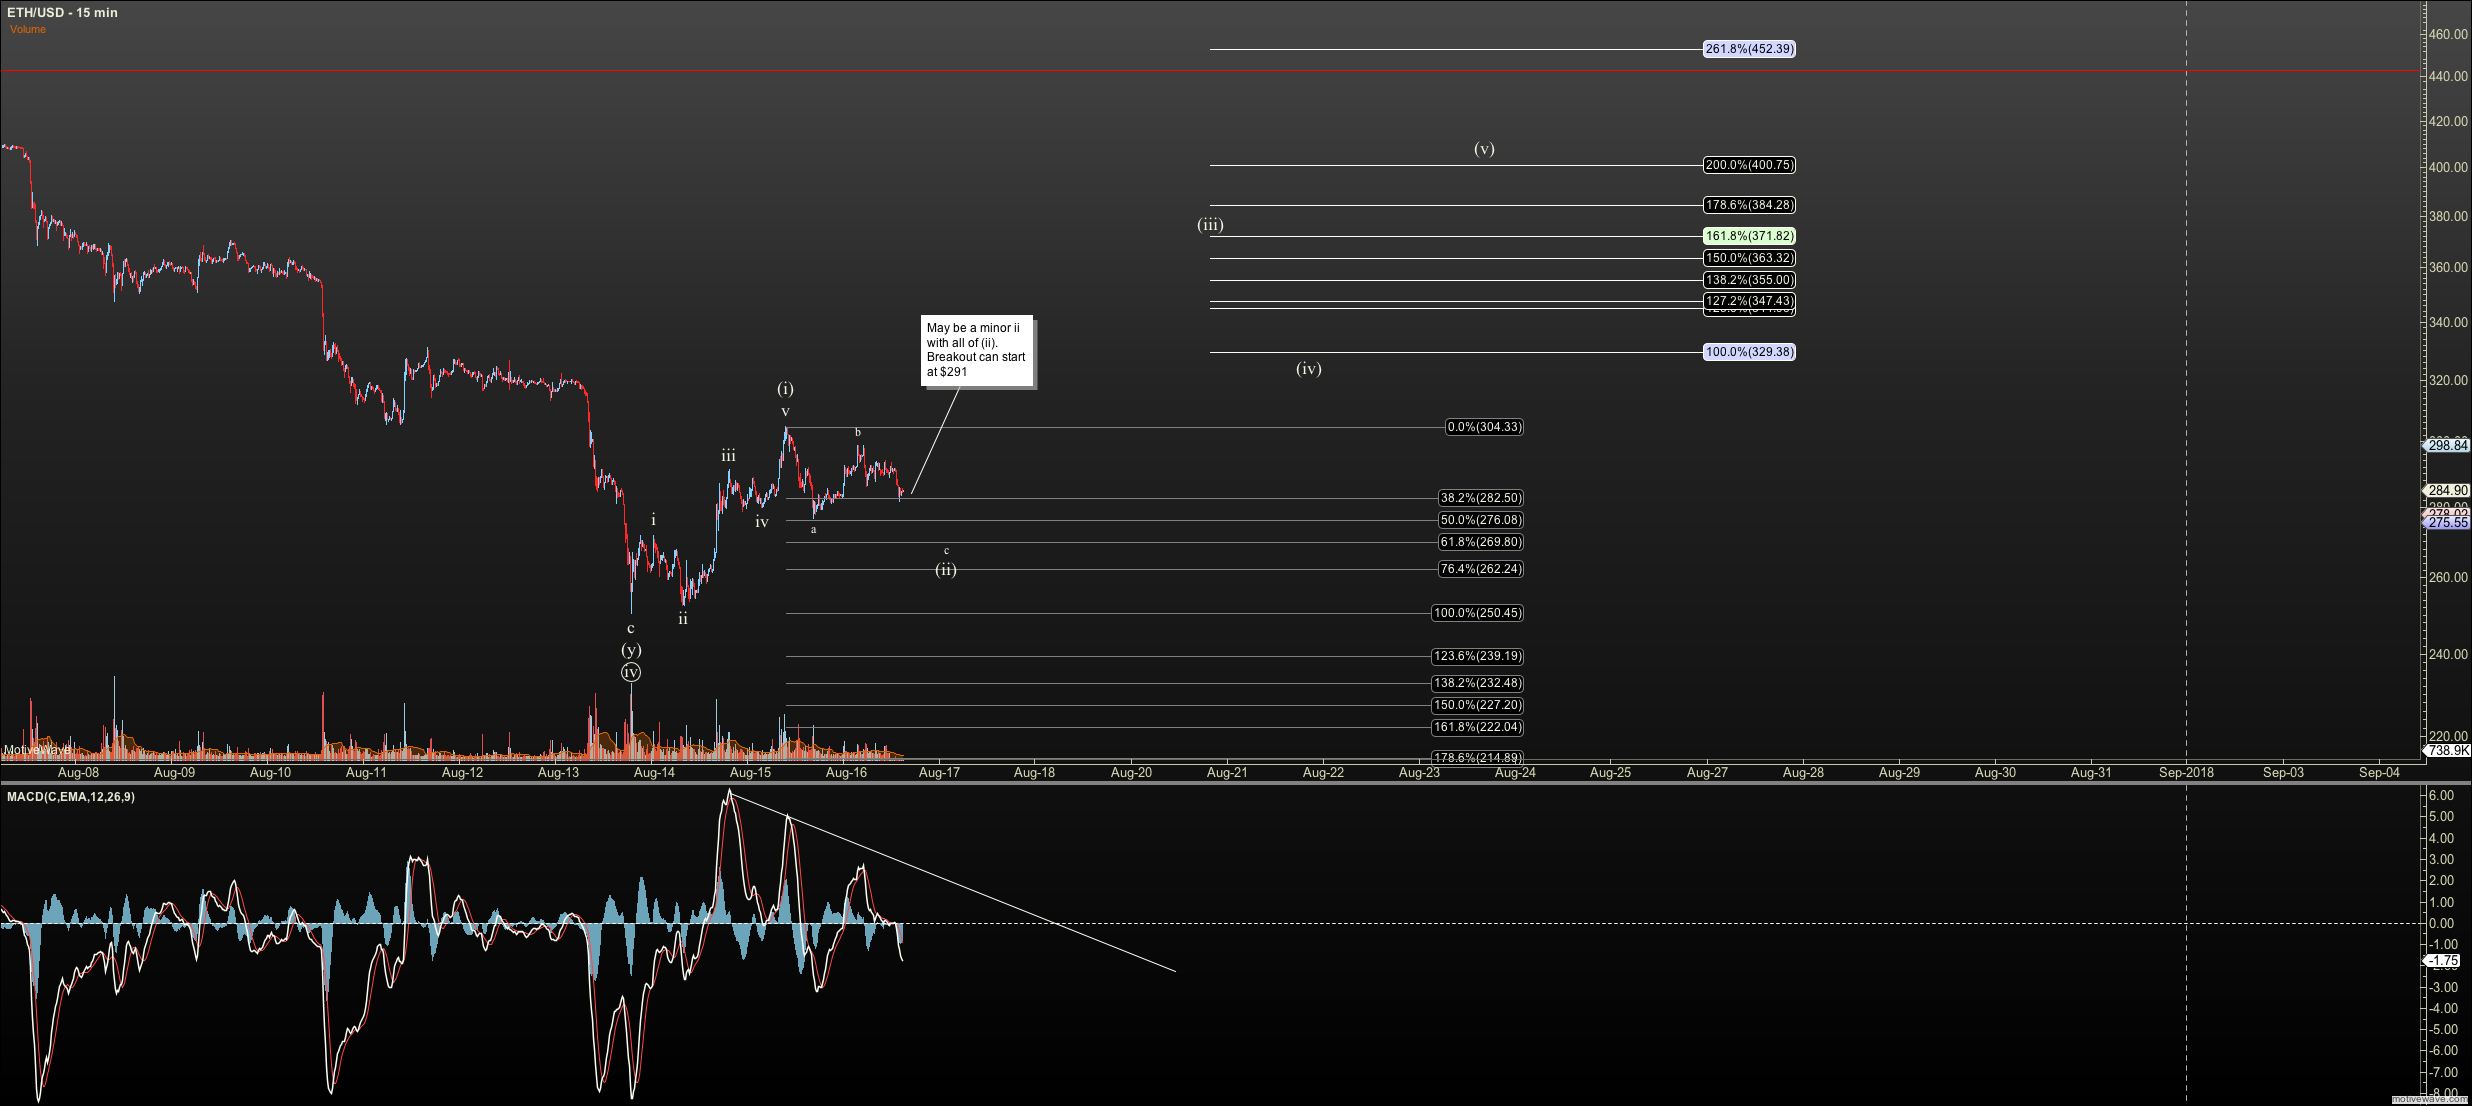
ETHUSD: I still see Ether in a wave 4. However, I see a glimmer of 5-up as a 'non-overlapping diagonal'. If this is to be believed, then $262 must hold below that and we should be headed to sub $230, perhaps 100 handle. There is also potential we already have a 1-2,i-ii in place. But an immediate break over $291 is needed to make this scenario likely. I've included a bullish count for that resolution and 5 up over $400 makes a bottom in scenario very likely. But we're still flat for the last 48 hours. Otherwise primary charts are the same.
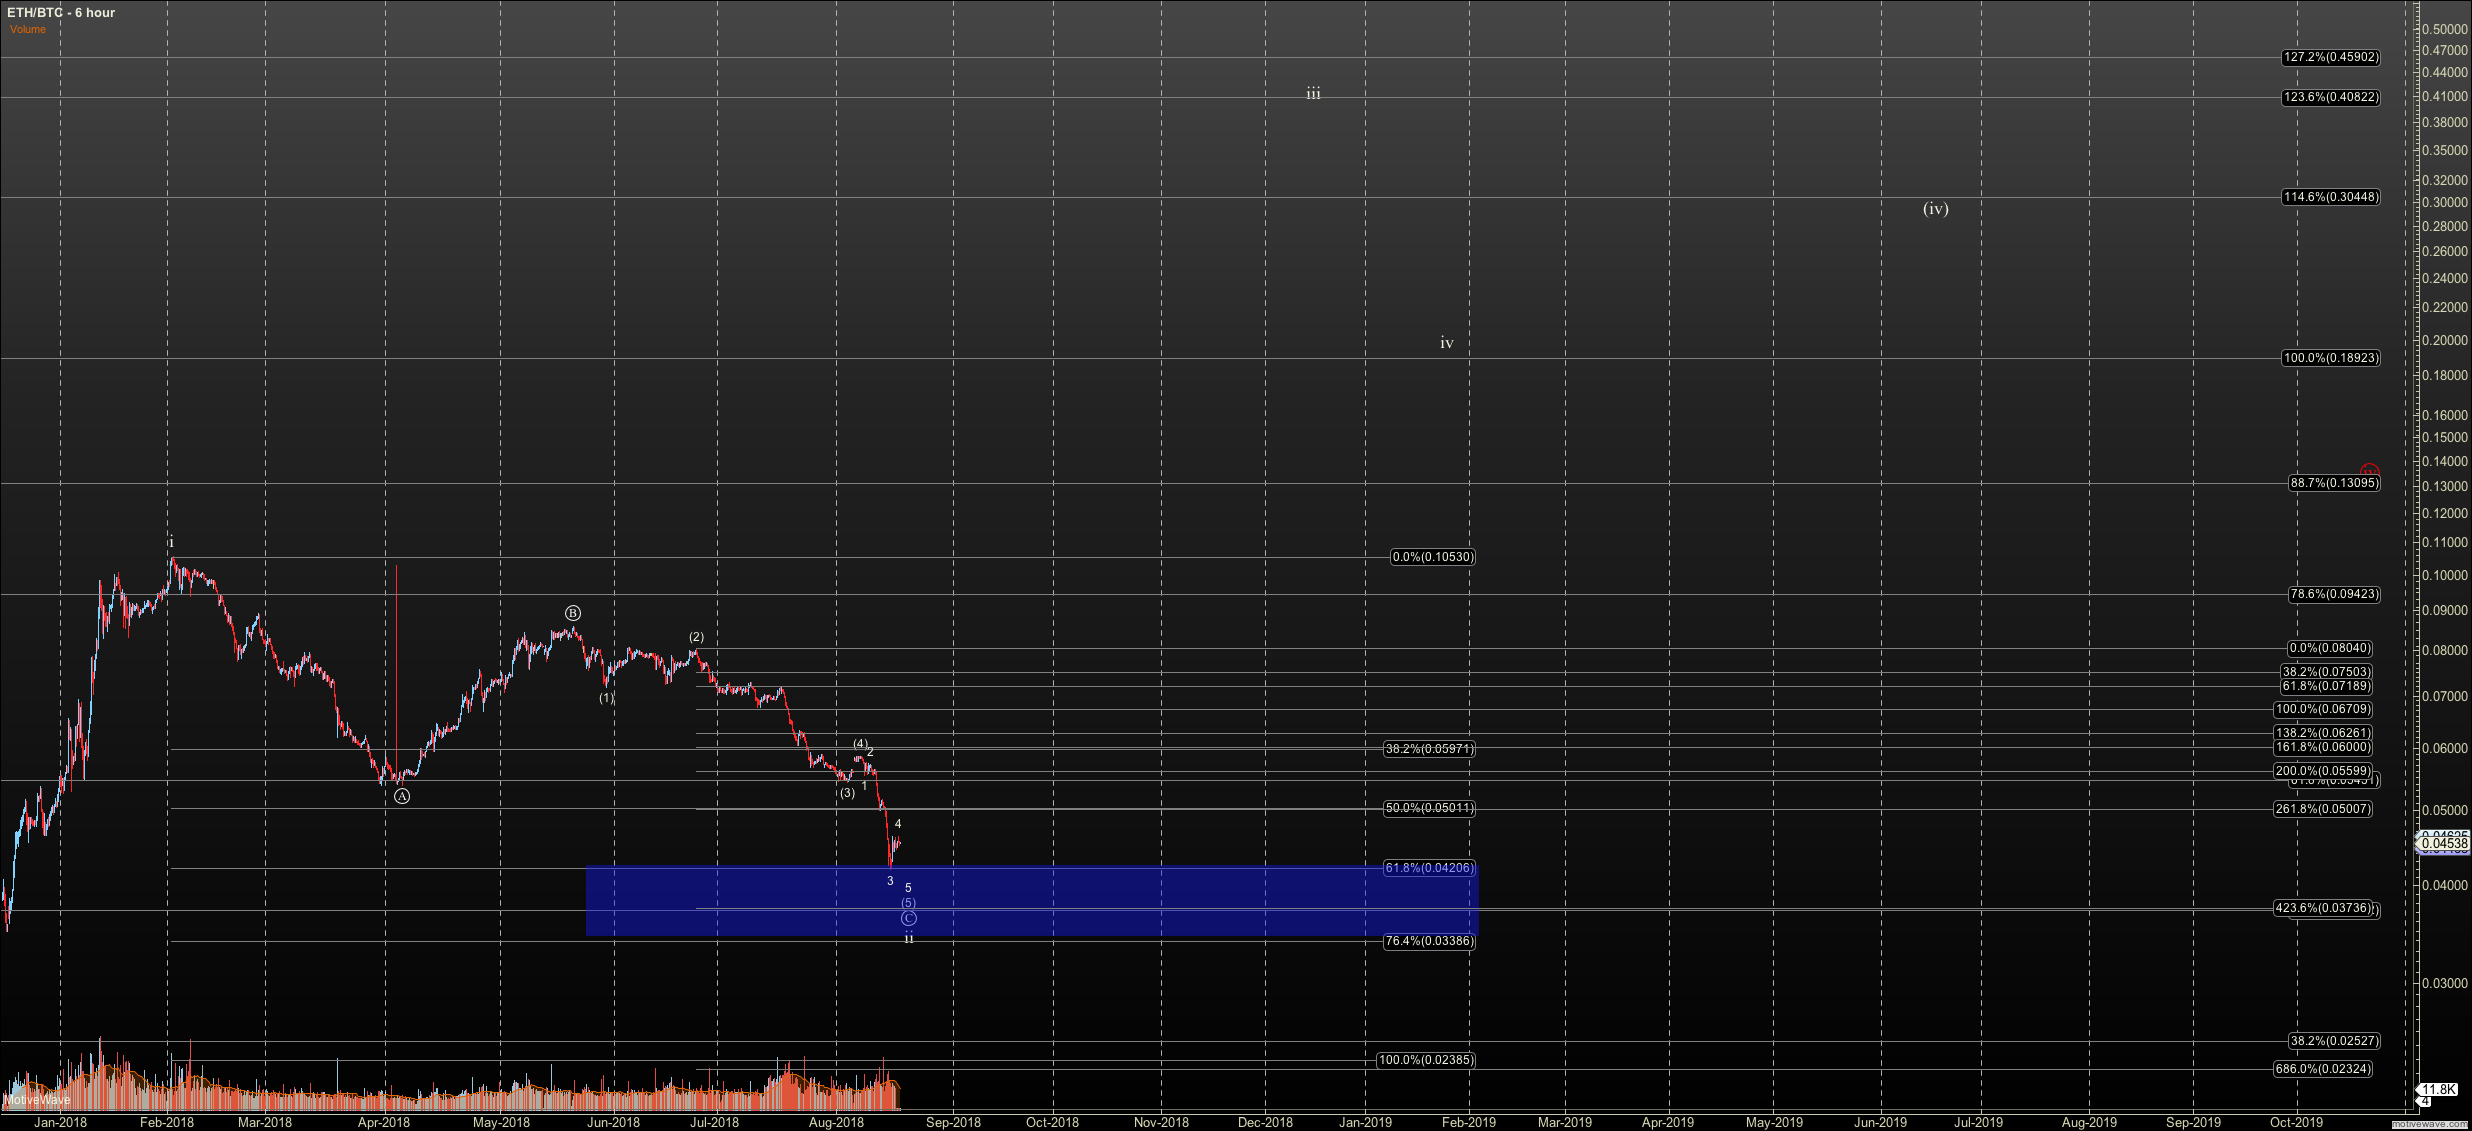
ETHBTC: Like Ether in USD this chart appears to be in wave 4 still.