Sprouts Farmers Market: No Room For Error Here
 By
Levi
By
Levi
By Levi at Elliott Wave Trader; Produced with Avi Gilburt
In an ideal environment with perfect conditions, the sailing is rather simple. It’s when the gusts blow and the waves surge that you will find out what type of sailor you really are. It would seem that a squall of sorts may be incoming and we’re going to find out just how much upward momentum (SFM) can maintain. The setup is ripe for a pullback. Let’s take a look at the fundamental snapshot with Lyn Alden and then how the structure of price is showing agreement with that picture.
Rich Valuation Even In An Ideal Environment
Lyn astutely points out some key data points in her most recent update to our members:

With a blended p/e of 41+ in a grocery store chain stock and the possibility of slowing growth, it would only take one hiccup to likely shift sentiment to bearish. Is it plausible that sentiment is actually already sniffing this out?
Likely we have all seen stocks stretch to valuations that would be considered “unreasonable” at any metric. And that is always possible even in an issue such as (SFM). However, let’s look at what crowd behavior is telling us via the structure of price on the charts. Zac Mannes and Garrett Patten share their studies below.
The Structure Of Price Speaks
Why do we say this? Ask yourself, “What truly leads the markets? We follow the fundamentals with Lyn Alden. Fundamentals are important. However, what is the driving force of important turning points in the markets? Sentiment. Simply put, fear and greed that battle against one another until the force of one overpowers the other.
Sellers will exhaust themselves at bottoms, and buyers famously flame out at tops. All have observed fundamentals that get strenuously stretched to what appear to be absurd valuations to both extremes. Markets seem to be what we deem 'irrational' at these points. This is because markets are not logical, thinking entities. They are fluid, dynamic and non-linear in nature. Markets are emotions in action before our very eyes.
Note this brief excerpt from an article that Avi Gilburt wrote regarding what truly moves markets. The piece was entitled, 'This Analysis Will Change The Way You Invest Forever'. In Part-2 (you can read it here) of the six-part series, Avi shared this point regarding Ralph Nelson Elliott's market research and findings:
In 1941, Elliott stated, regarding the financial markets, that "[t]hese [Fibonacci] ratios and series have been controlling and limited the extent and duration of price trends, irrespective of wars, politics, production indices, the supply of money, general purchasing power, and other generally accepted methods of determining stock values." As you can see, the more research conducted into this subject, the more support we find to Elliott's theories set out almost 100 years ago. - Avi Gilburt
So, Where Do We Find Ourselves Now?
This is one of the particular places that Elliott Wave Theory, when correctly applied with Fibonacci Pinball, shines so bright. And, do you know specifically what this is? We have come to appreciate that this is one of the only methodologies that we know of that can provide context to the picture at any moment in time. What does this mean and how can it help us?
Context Is Key
What are we talking about when we use the term ‘context’? Spoken plainly, this is the entire structure of price on the chart. Over many decades of study and observation, it has become apparent that the markets are fractal in nature. They display self-similarity at all degrees, or time intervals. These very patterns, or forms, repeat themselves and create larger versions of the same type of structure, just like a fractal does. It is this feature of human behavioral patterns that gives Elliott Wave Theory its power and utility.
In practical terms, it means that we are able to zoom out and identify the larger structure. Then we can zoom in and project how that structure is more likely to fill out. It is in this way that the structure of price speaks.
Theory In Action
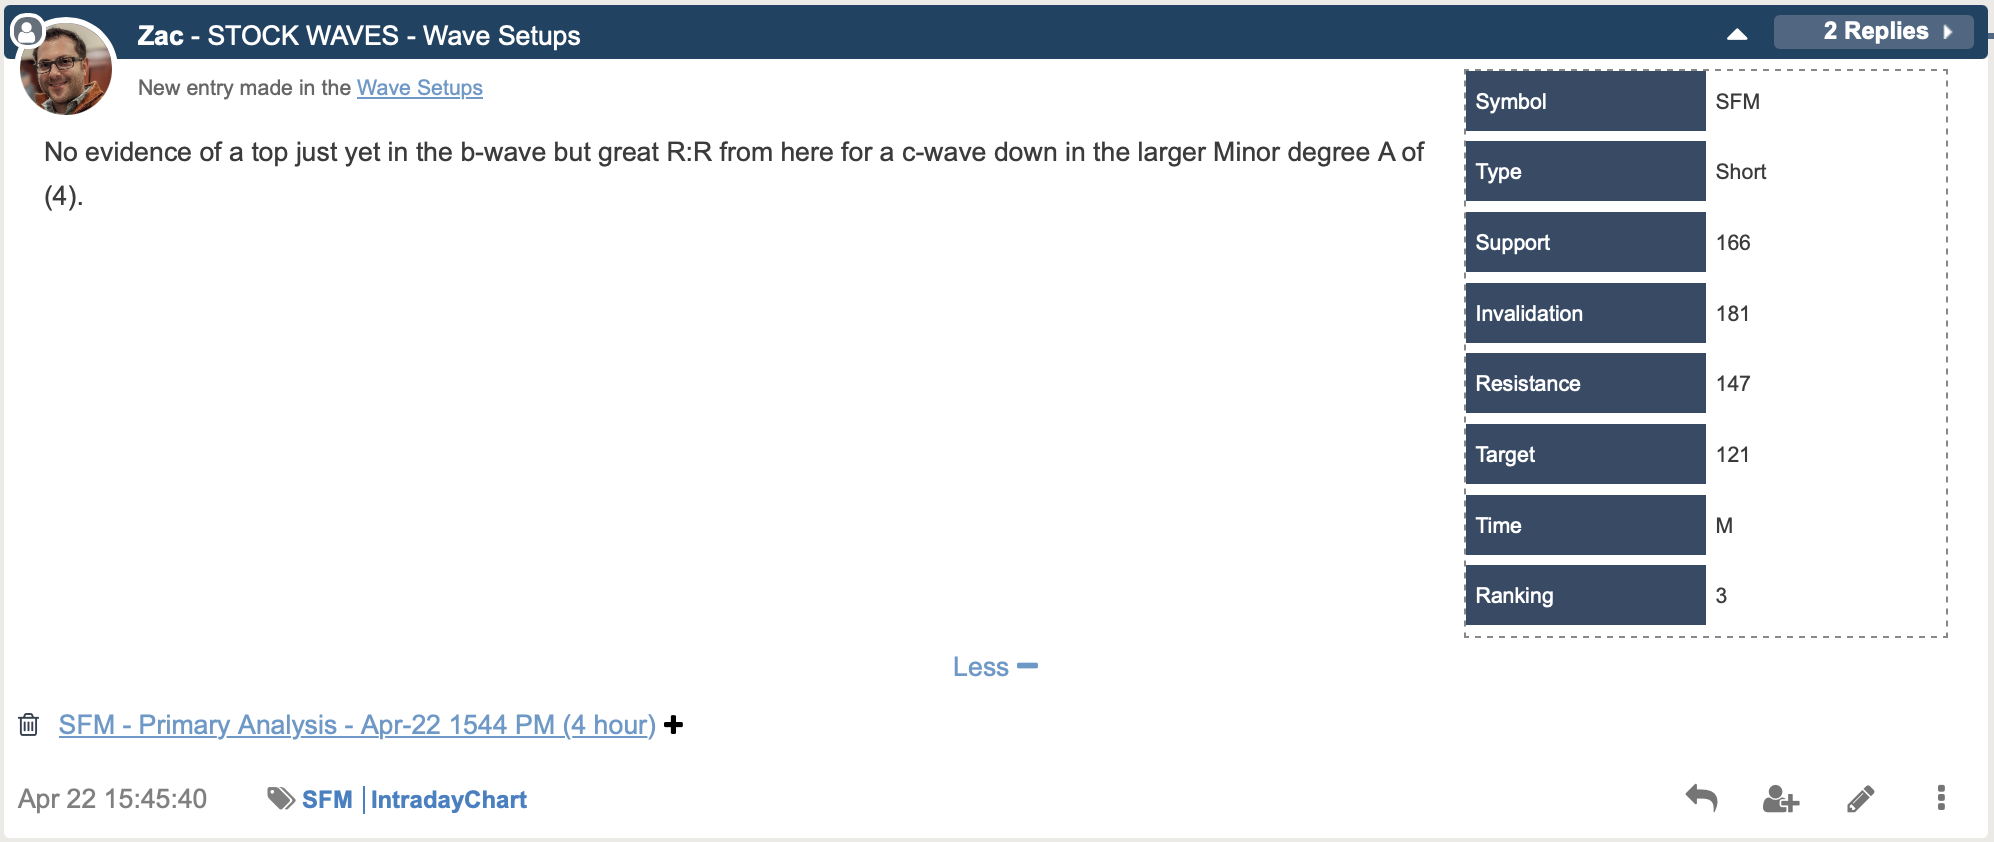
Here you can see the table as provided by Zac in a recent new entry under our Wave Setups feature in StockWaves. When any of the key levels are reached, an update will be posted with new levels calculated accordingly. Note the latest charts from both Zac and Garrett below and then we will discuss the probable path a bit more in depth.
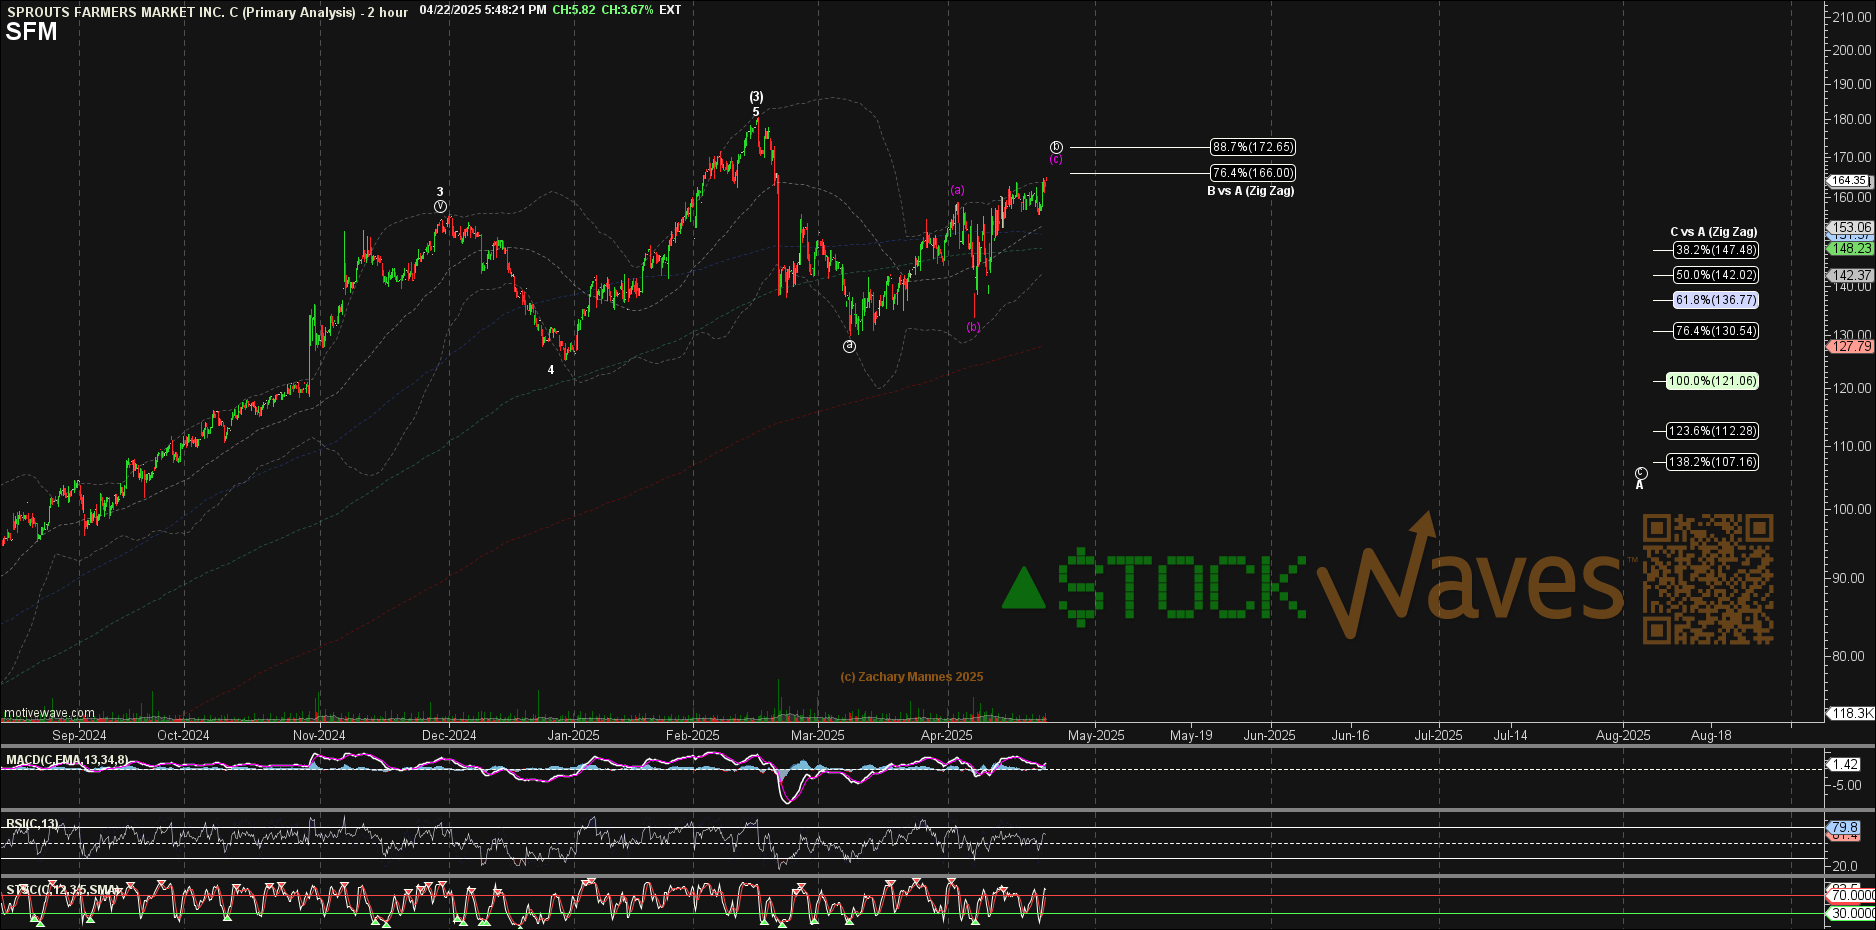
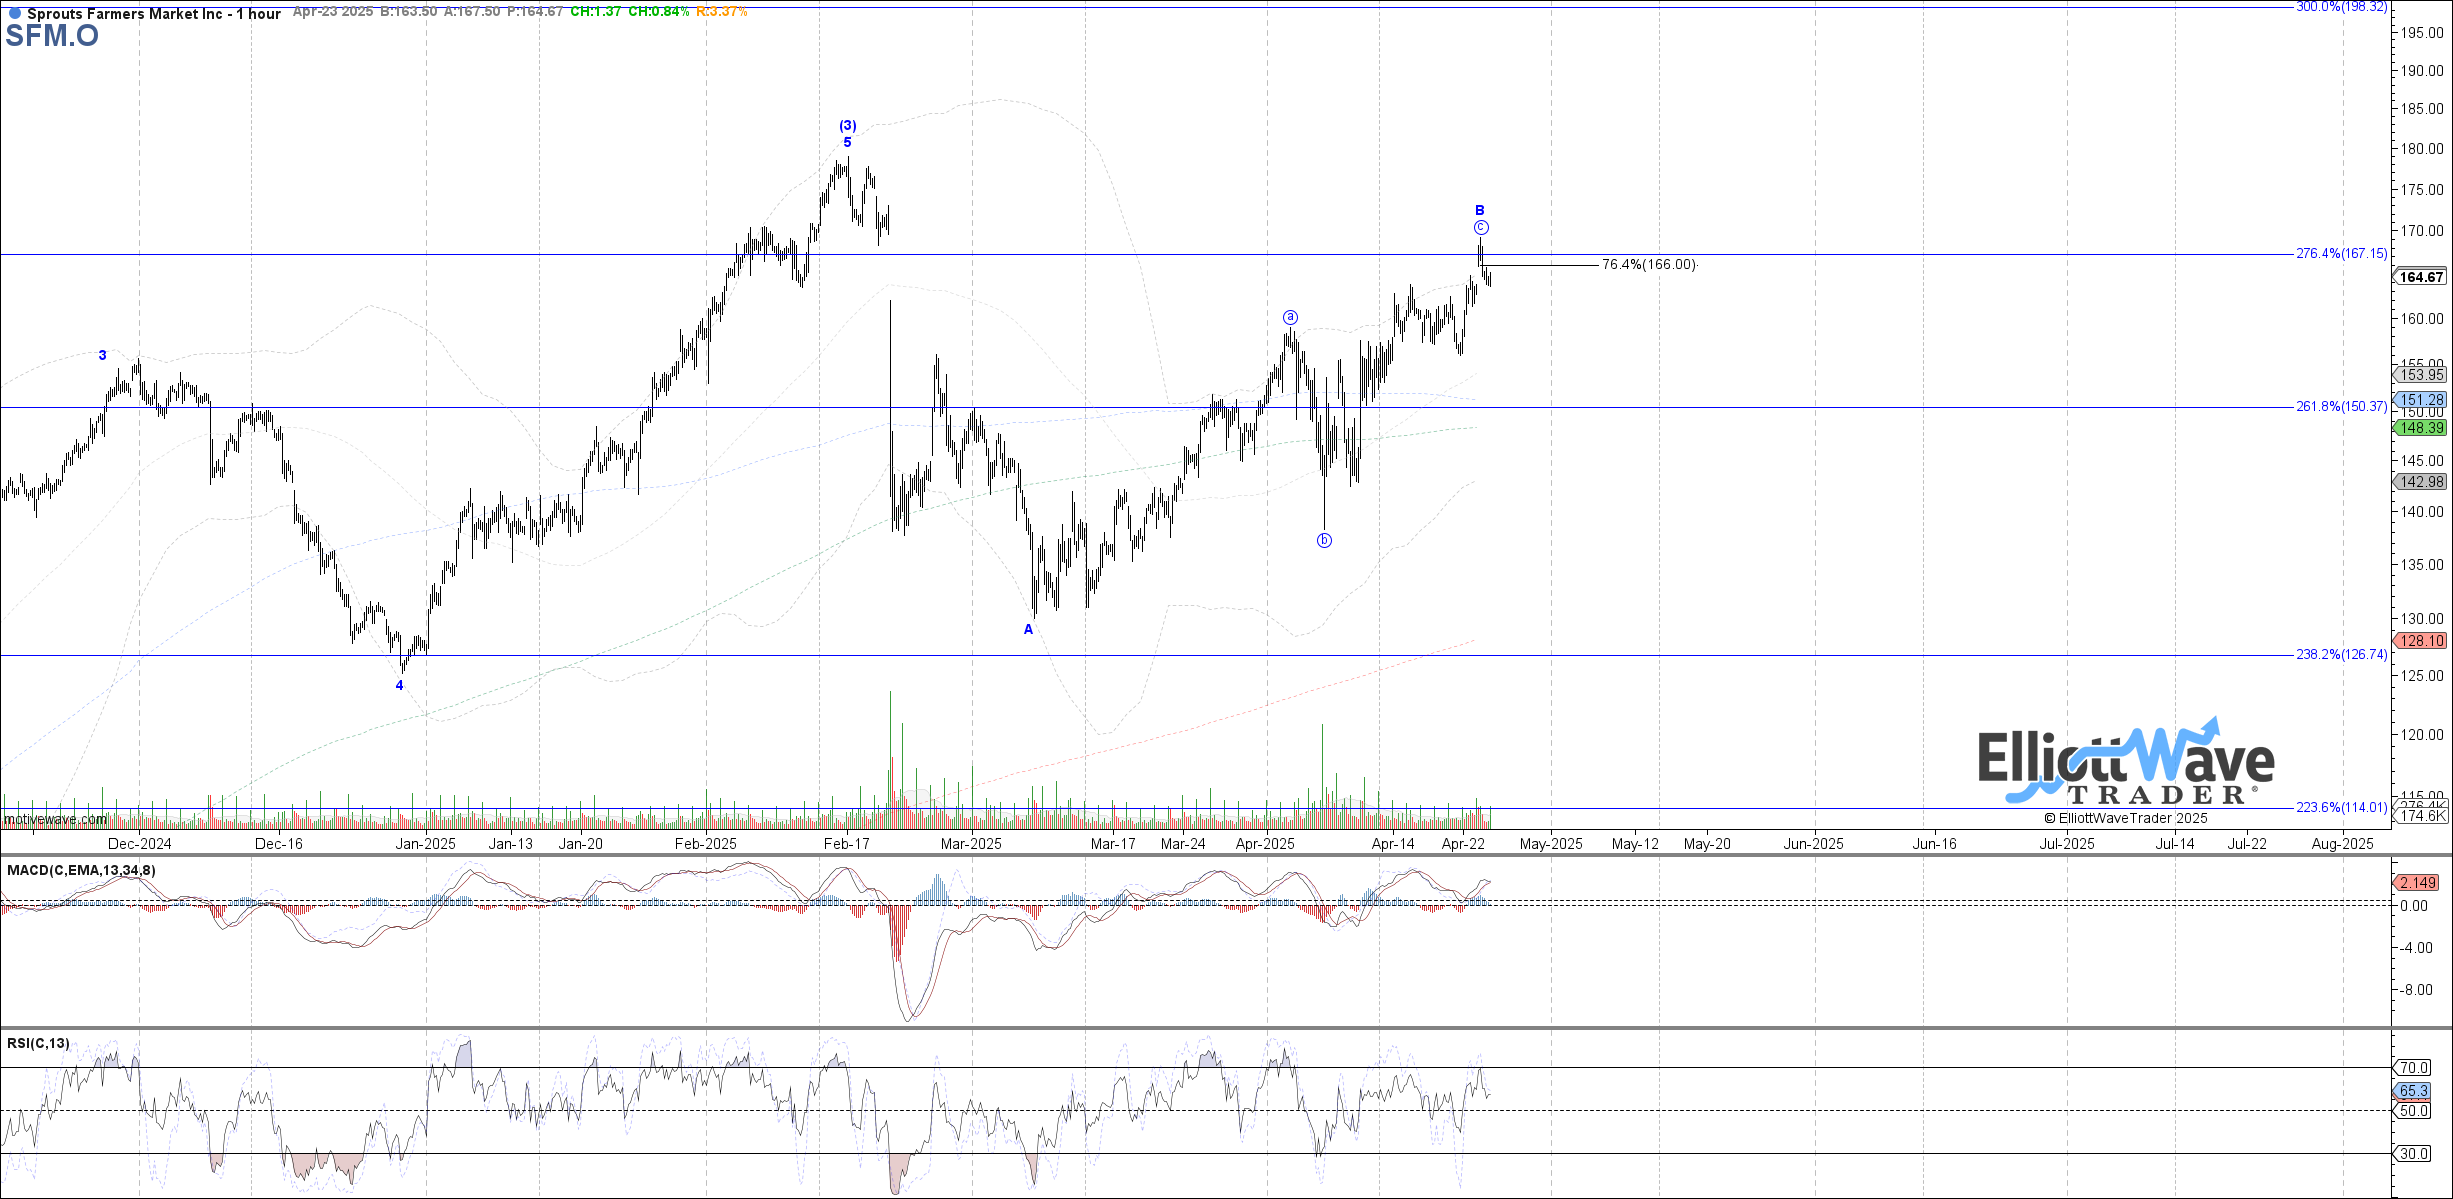
When we have both of our lead analysts in agreement and Lyn Alden weighing in with a read on high valuation and future growth prospects, it would stand to reason that we have a high-probability setup forming. In this case, caution in the near term for a bullish outlook. And actually, the bearish setup can be better confirmed with a move back below $165.
Should price by chance break higher above $170 then the ‘B’ wave as illustrated here may stretch a bit more. It would seem though that there are enough subwaves in place to consider the ‘c’ of ‘B’ in place. So what are we waiting for next? 5 waves down from the last high and then a corrective bounce that remains below that high struck.
Don't Be Turned Off By Misapplication Of This Methodology
Obtaining a true understanding of this methodology takes time and effort. For those willing to invest in said effort, it pays off immensely. Those who are turned off by the words "Elliott Wave" typically have come across those who misapply the theory or are not willing to devote the requisite energies needed.
Our methodology is pointing to the potential for a low-risk, high-reward bearish setup for (SFM) stock. Not all paths will play out as illustrated. We view the markets from a probabilistic vantage point. But at the same time, we have specific levels to indicate when it's time to step aside or even change our stance and shift our weight.
If you are amenable to seeing the markets from a new point of view, then the proper application of this theory may just be for you. The understanding of the true nature of crowd behavior is within your grasp. Come see how we do this every day!
(Disclosure: I/we may initiate or hold bearish positions in this stock in accord with the parameters shared in this article)
