
SpaceX: The Top Was Mapped Before the First Trade — Now for the Landing
 By
Levi
By
Levi
Before SpaceX traded a single share publicly, I published a target zone of $225 to $240 for where the post-IPO advance would likely end.
The stock topped at $225.61.
I wrote that original piece hedged in every direction I knew how to hedge. I called it a thesis offered as a question, not a verdict. I said the wave analogy was an adaptation rather than a textbook application. I flagged that the projection math was exquisitely sensitive to where you place the launch point — move it one shelf and the answer swings enormously. All of that was true when I wrote it, and it is still true now. The method did not become certain because it worked once.
But it did work. So let me explain how, because the how is the useful part.
None of the framework is mine. It is standard Elliott Wave analysis as we have learned over the years and made even more functional with Avi Gilburt’s overlay of Fibonacci Pinball. It’s the same principles Zac Mannes and Garrett Patten apply every day as well. What was unusual was the data I applied it to.
Private companies do not give you a continuous price chart. They give you funding rounds — discrete valuation marks, negotiated in rooms most of us will never sit in. My question was whether those marks, plotted on a log scale, might trace the progression of institutional belief the way a price chart traces the crowd's.
If they did, then SpaceX had already built waves one through three in private. The step-ups. The repricings. The long shelves where the valuation held while the company grew into it — those, I argued, were the corrective waves, expressed in time rather than price, because private markets rarely print a down round.
Which left an obvious question. If the private institutions built the third wave, who supplies the fifth?
The answer was the public. The retail crowd, locked outside a keyhole for a decade, finally handed a door. That handoff — from the institutional crowd to the unconstrained one — was the whole thesis. And the fifth wave that crowd would supply had a measurable size, because fifth waves relate to first waves in ways we can project.
That projection came to $225 to $240. Price paid $225.61 and turned.
One result does not validate a method, and a different launch point would have produced a different number. What I will say is that the framework asked a question that could have been answered no, and the market answered yes.
Now the stock has come down considerably, and Lyn Alden's read on the company is worth your time here:
"Since then, SpaceX has indeed lost some of its luster in the market and has fallen below its IPO price. The stock is down around 40% from its post-IPO peak euphoria levels.
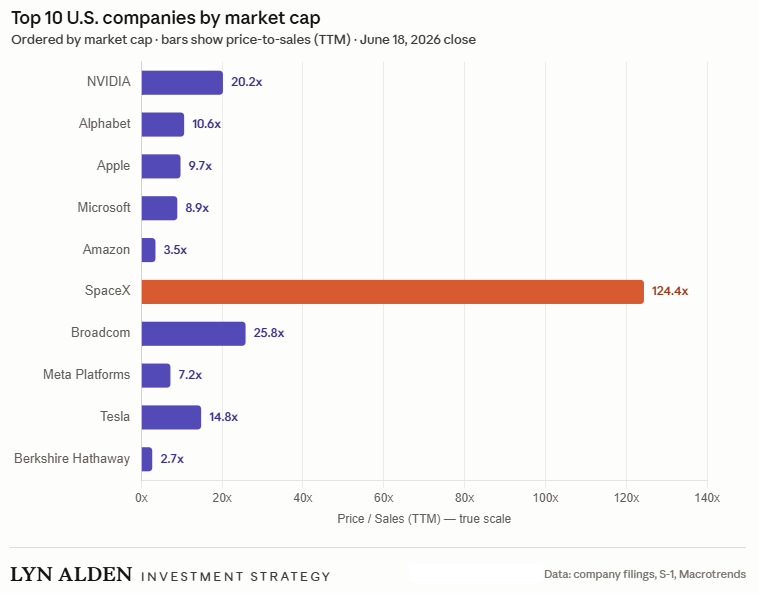
However, the company still has a $1.7 trillion market capitalization. I'm not sure how much it'll fall this year, but I continue to hold the combined view that 1) its IPO valuation was extremely bubbly but that 2) even after the initial hype cools down, it'll maintain a valuation premium as a megacap company for years."
That is a clear-eyed summary of where things stand, and notice what she does not do. She does not call it broken. Bubbly at the top, premium-valued for years — a descent, not a crash.
Which brings me to the rocket, and I promise I am not reaching for it.
SpaceX built its business on boosters that come back. They launch, they separate, they fall, and then they land on purpose and fly again. The descent is not the failure. The descent is part of the flight plan.
The stock is testing the same thing right now.
So the question is no longer where the top was. We have that. The question is where this booster touches down — and it is the same methodology that gives us the answer. Let’s get to it.
Sentiment Speaks
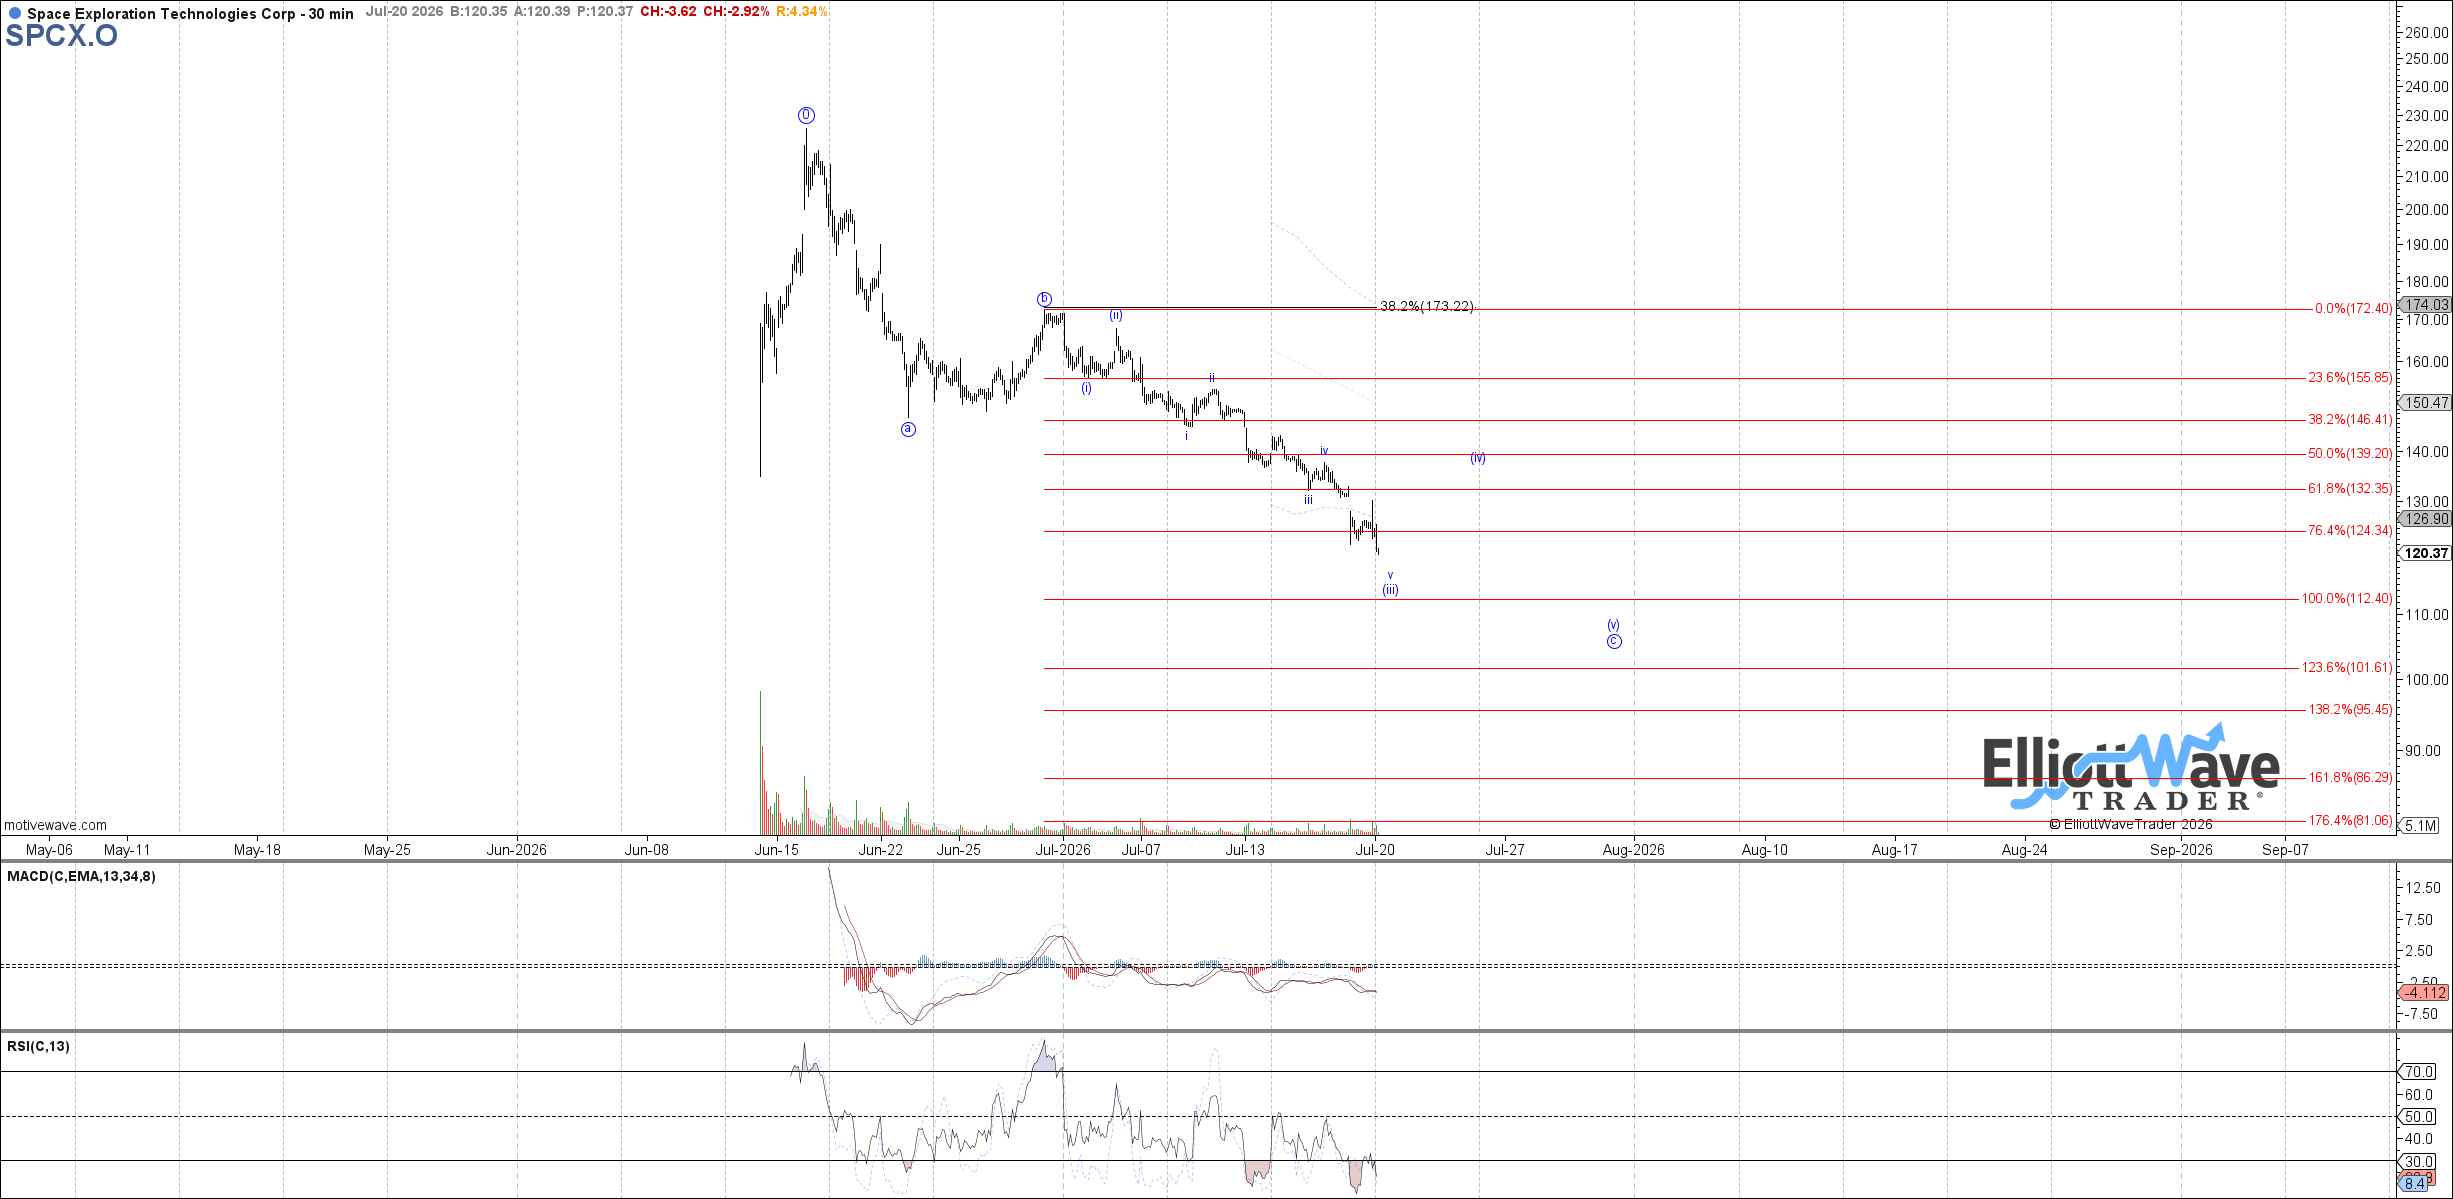
Note how Garrett is tracing out a circle wave ‘c’ down here. The $112 area becomes the likely target for the fifth wave of that ‘c’. It seems likely that there should be a fourth wave bounce first that would retrace approximately 38% of the wave ‘iii’ down. Should the $112 area be struck directly, then it is plausible that ‘iii’ and ‘iv’ are already complete.
It will then be the structure of the next anticipated rally that will tell us what is more likely ahead for SPCX. Should the bounce begin as corrective in structure and overlapping, then it suggests that the low projected to complete at the $112 area was an A wave and price would form a B wave bounce back up to the $155 - $175 area. If instead price forms a clear 5 waves up and then a corrective 3 waves down, it would give us a more bullish setup to track and trade.
For now, we anticipate a bit more cooling off and consolidation to the $112 level. Then this may just be ready for another liftoff.
