Some “Scary” Bullish Set Ups
As I have been known to do in the past, when the metals market transitions into a more bullish posture, I will often give primacy to the most bullish counts I am tracking. While I am unable to do so just yet, I am certainly going to highlight the potentials I am seeing and also identify when they ignite. Personally, I would not want to be holding any short positions should we see ignition in some of these patterns I am tracking.
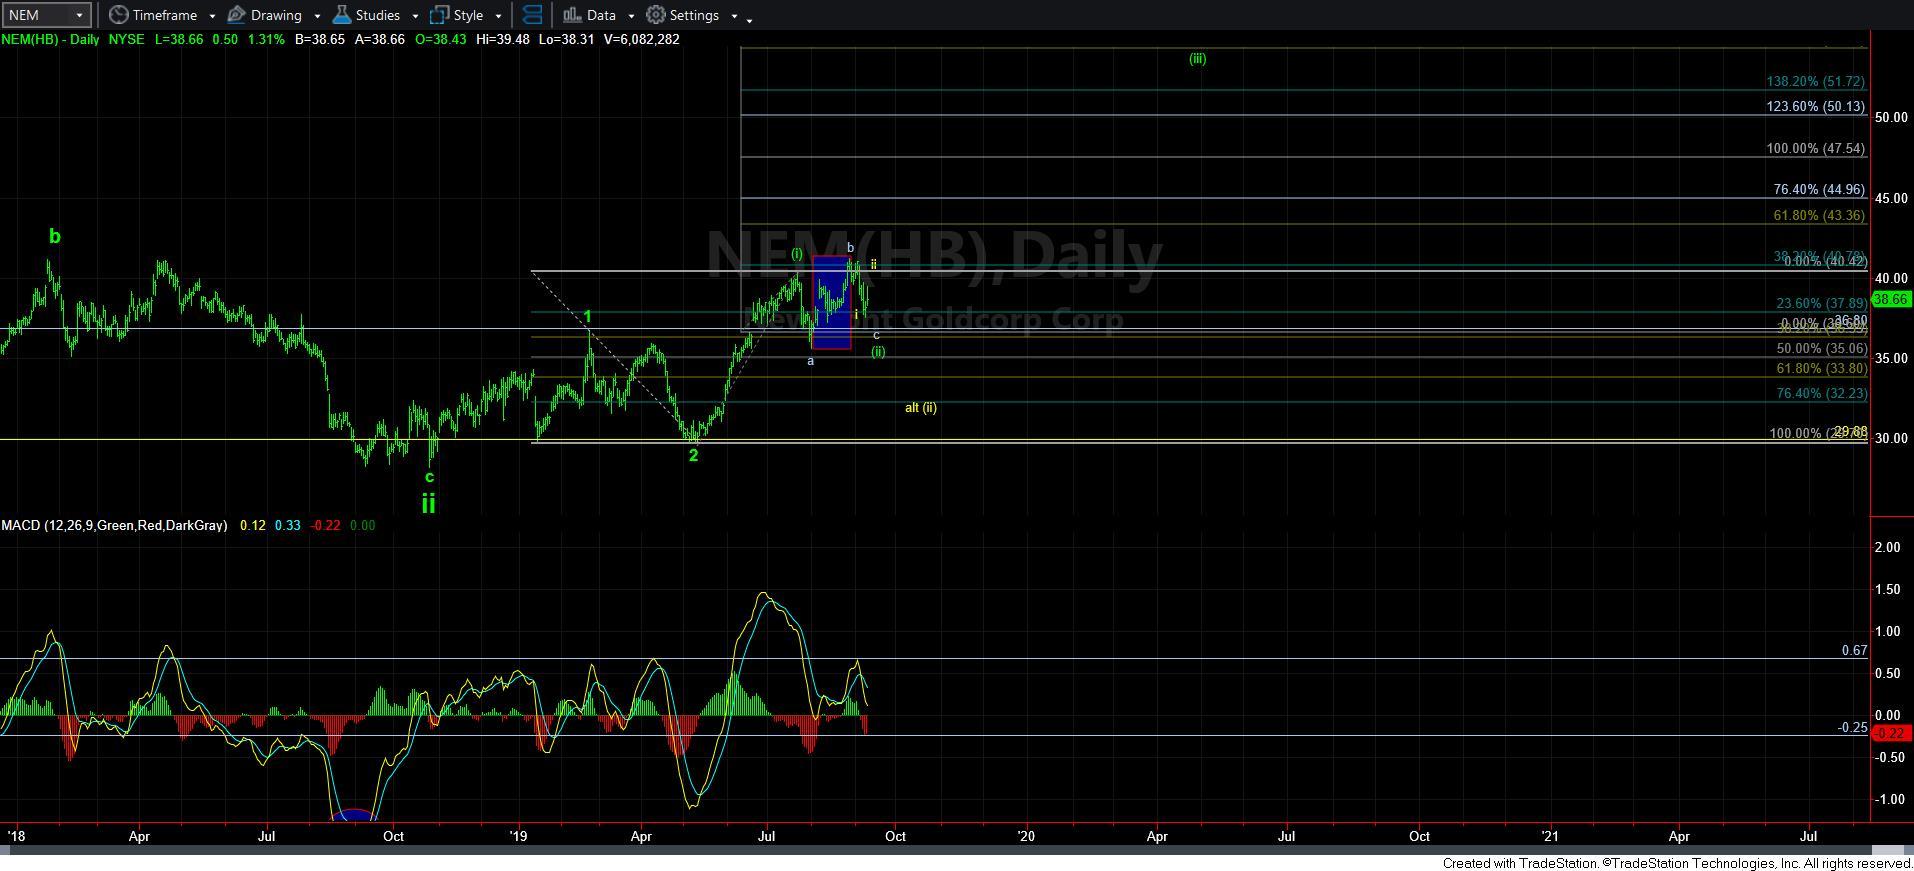
First, I want to begin with the NEM. Since the NEM is the largest miner within the GDX, I think it deserves some attention when I see a set up like this develop. In fact, this type of set up can easily carry the GDX up towards the 35 region on its own, and would then allow the NEM to catch up to the structure that we see in the rest of the market, as it has fallen well behind.
If you would look at the attached NEM chart, I want to bring your attention to the topping structure which hit a high of just over 41, as highlighted by the blue box. If you look closely, you will see that this top was struck on a 3-wave rally. That ordinarily signifies a b-wave high within a correction. And, since the rally before that can be counted as a completed 5-wave structure, I am viewing that b-wave high as a b-wave within wave (ii). Expanded b-wave structures like this are very bullish indications, and strongly suggests that the market will exceed those highs.
The question now is how deep the c-wave of wave (ii) will take us? For the shallow wave (ii), the maximum I would be willing to accept is the 36.80 region which would be the 2.618 extension of waves 1-2 down in that c-wave. That means that as long as the NEM holds over that level, and then breaks out impulsively over the recent high over 41, that could trigger a 3rd wave pointing us to the 50+ region. However, with regard to this count, I do have to note that I only count 3 waves up off the low we struck yesterday, which makes it less likely that wave (ii) has completed. So, a lower low even within the upper wave (ii) is still very likely.
Moreover, if we see a strong decline below 36.80, then it likely means that we will get an extended c-wave down, pointing us as deep as the 32 region in the NEM. And, that will likely cause further pullbacks in the GDX as well.
I also want to add that there are a number of other miners that retain the more bullish upper support wave (ii) potential as seen in NEM (BVN and IAG to mention two). However, until we see a strong move through the 41 region, I am going to continue to treat this bounce as simply part of a larger degree pullback that is ongoing in the complex. Yet, a strong impulsive break out in the NEM over 41 will clearly get my attention and make me view the complex as potentially breaking out in its next phase rally.
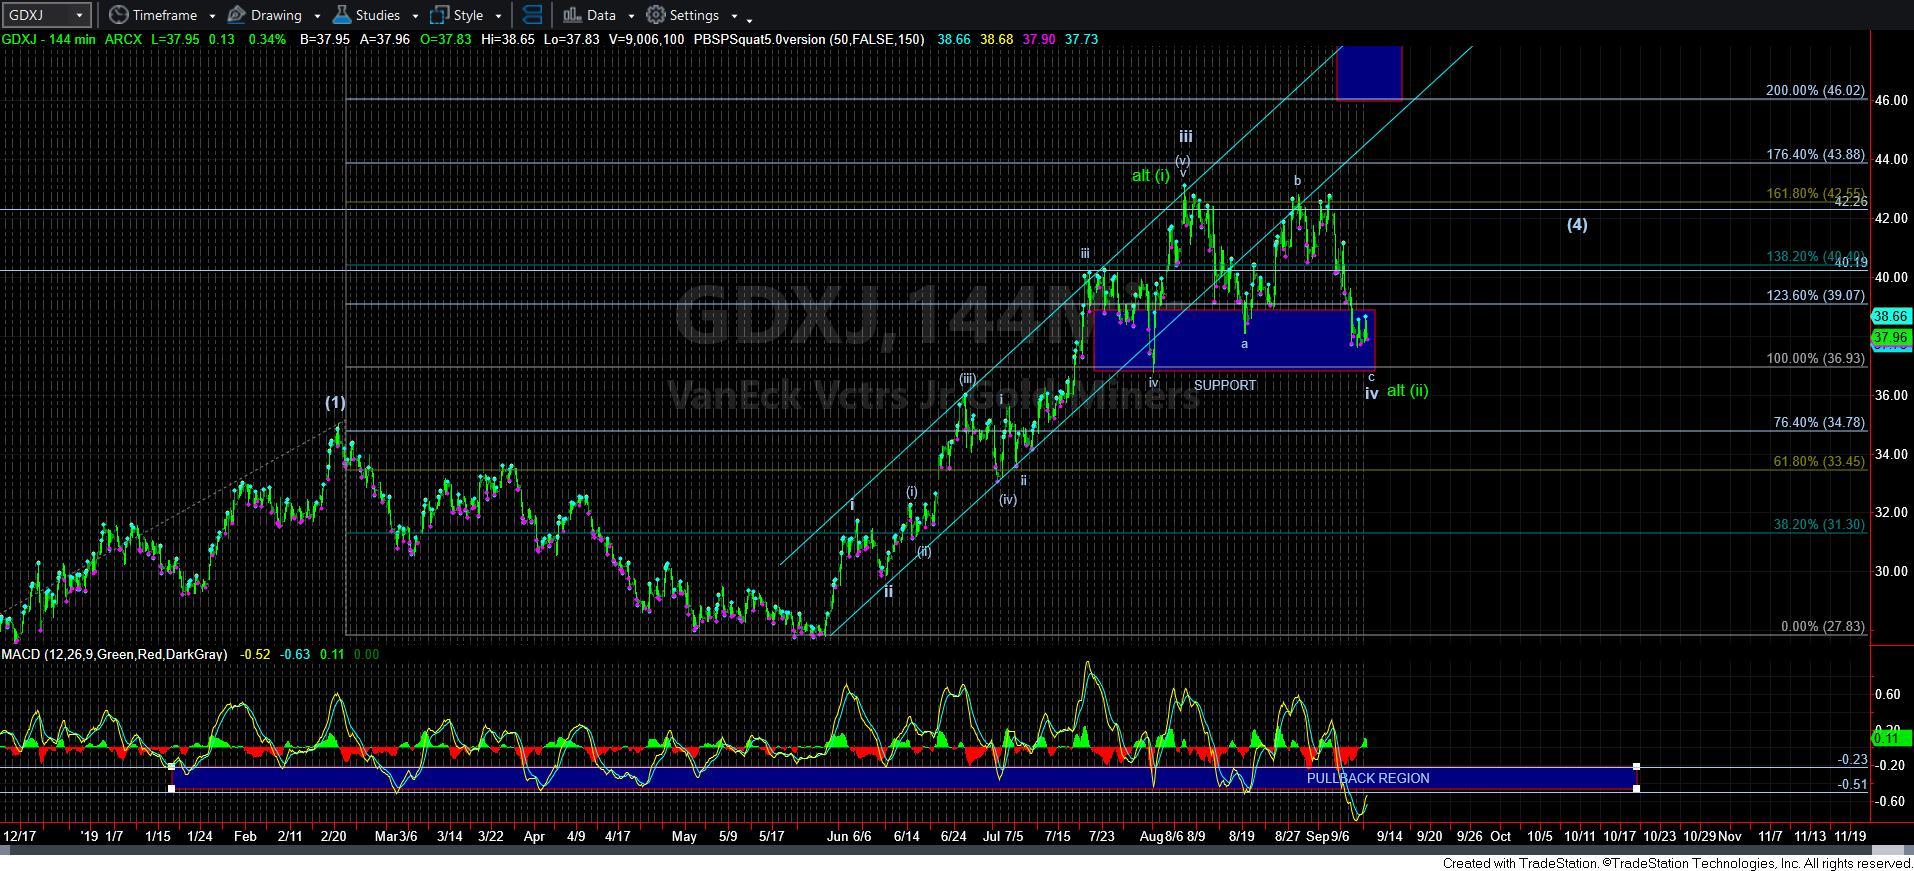
Along with other miners that have that same (i)(ii) structure, I have to now note that I can easily apply that same structure in the GDXJ. While I think we may see one more drop for a micro 5th wave in the c-wave in GDXJ to the bottom of the support region, I think that we can see a strong reversal off that low. And, should that reversal take shape as an impulsive structure, then I am going to be following this potential for the green count similar to what I would be tracking in the NEM. Again, this adds to the strength of the argument that a bigger than expected rally can kick off within the coming week or two.
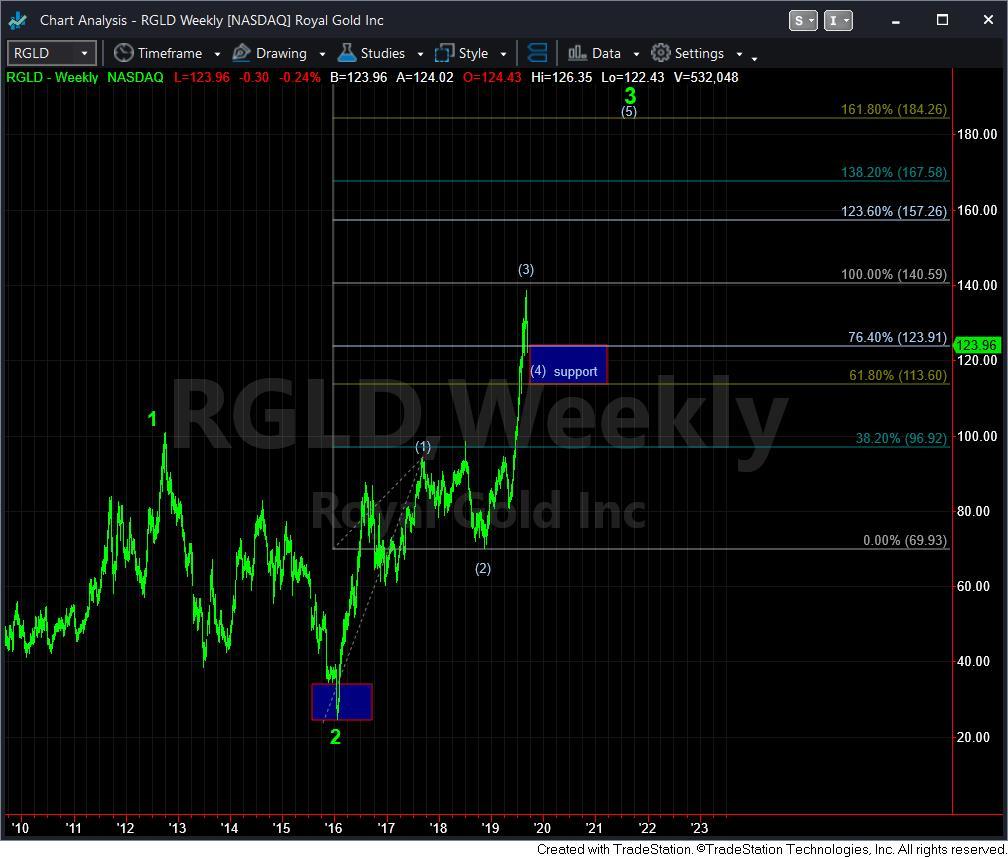
Then we can move over to the RGLD. As you can see, it too can be set up to rally in the wave (5) of 3, which also be a very strong move higher. So, as long as the micro support continues to hold, then I have to view this as a set up for another major rally in RGLD as well.
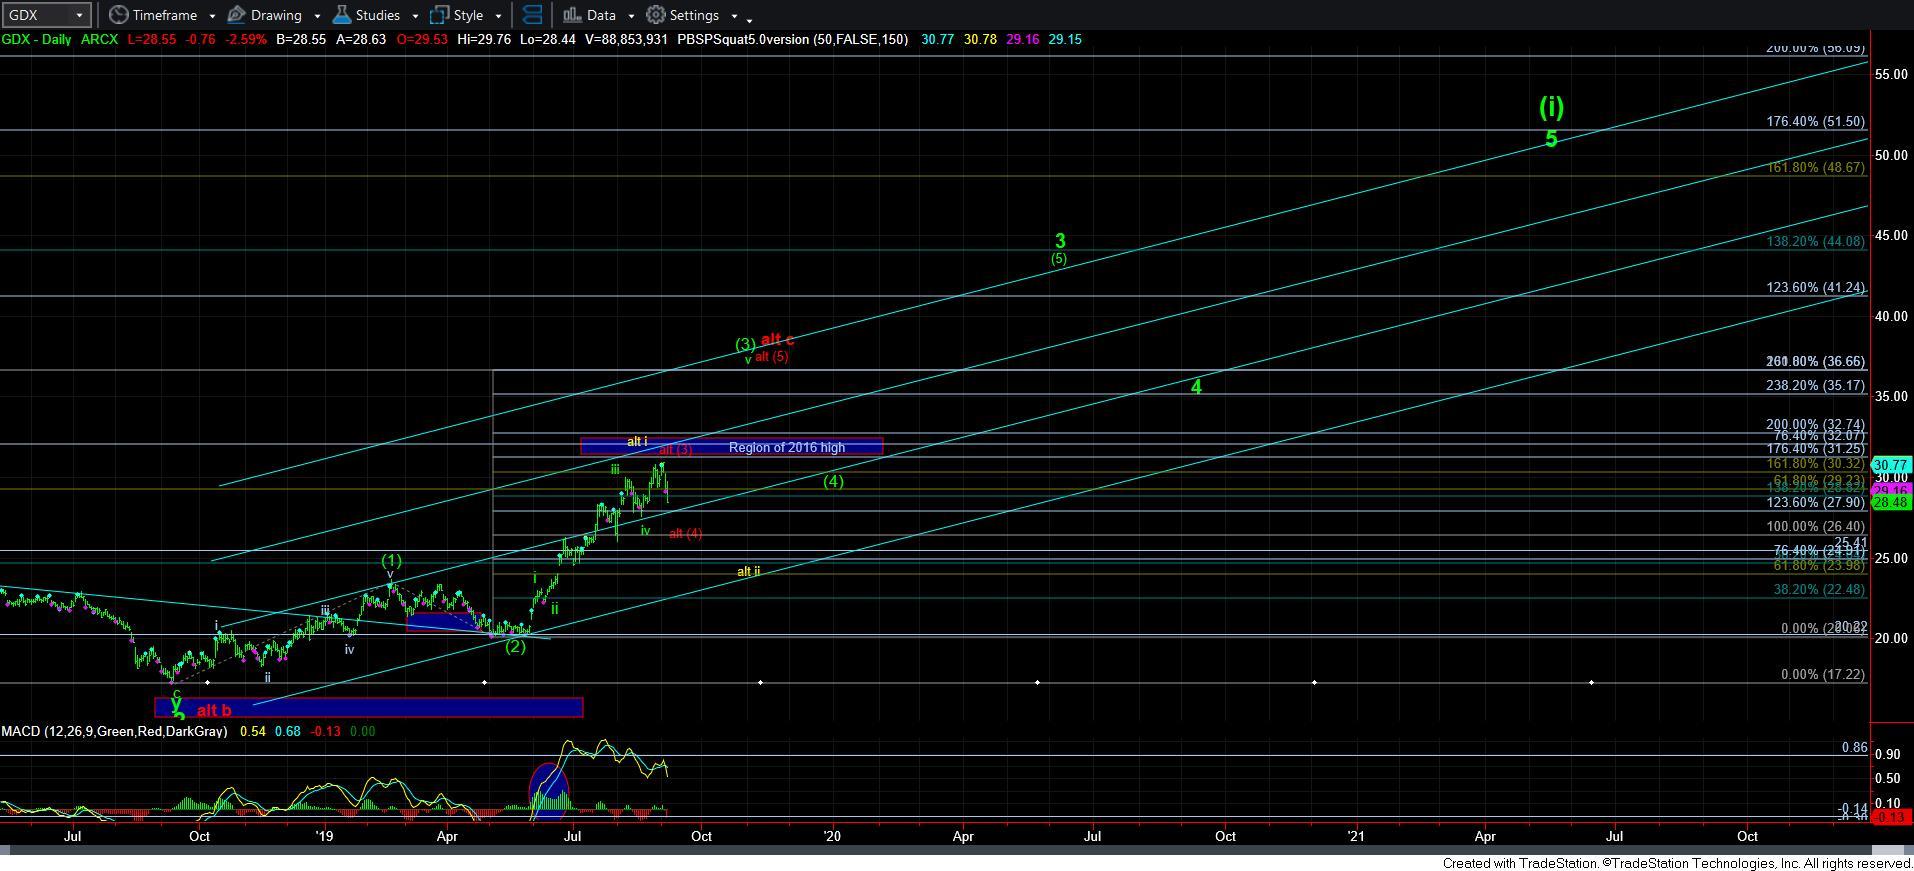
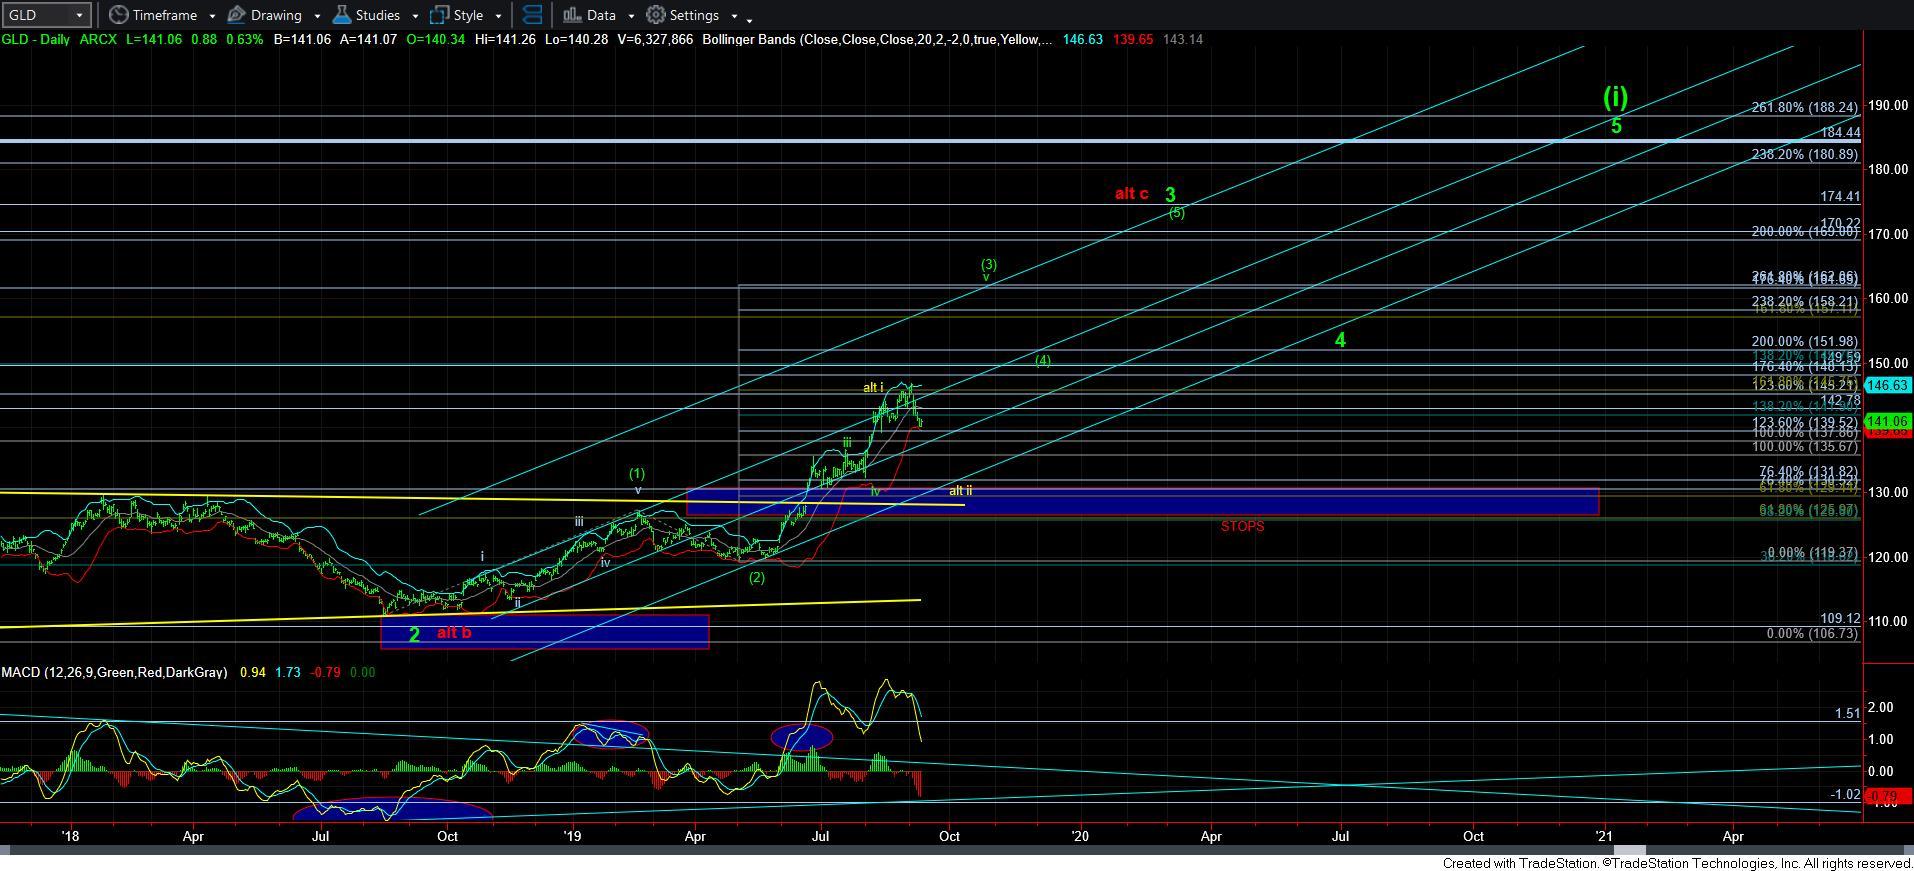
Now, when I review the GLD and GDX charts, I really struggle for a similar count as presented in GDXJ and NEM. In fact, if the GDX were to break out directly from here, I think it may lag some of the miners, as the best count I would have for it is still to fill in wave v of (3), as shown on its daily chart. And, I would likely view the GLD in the same manner.
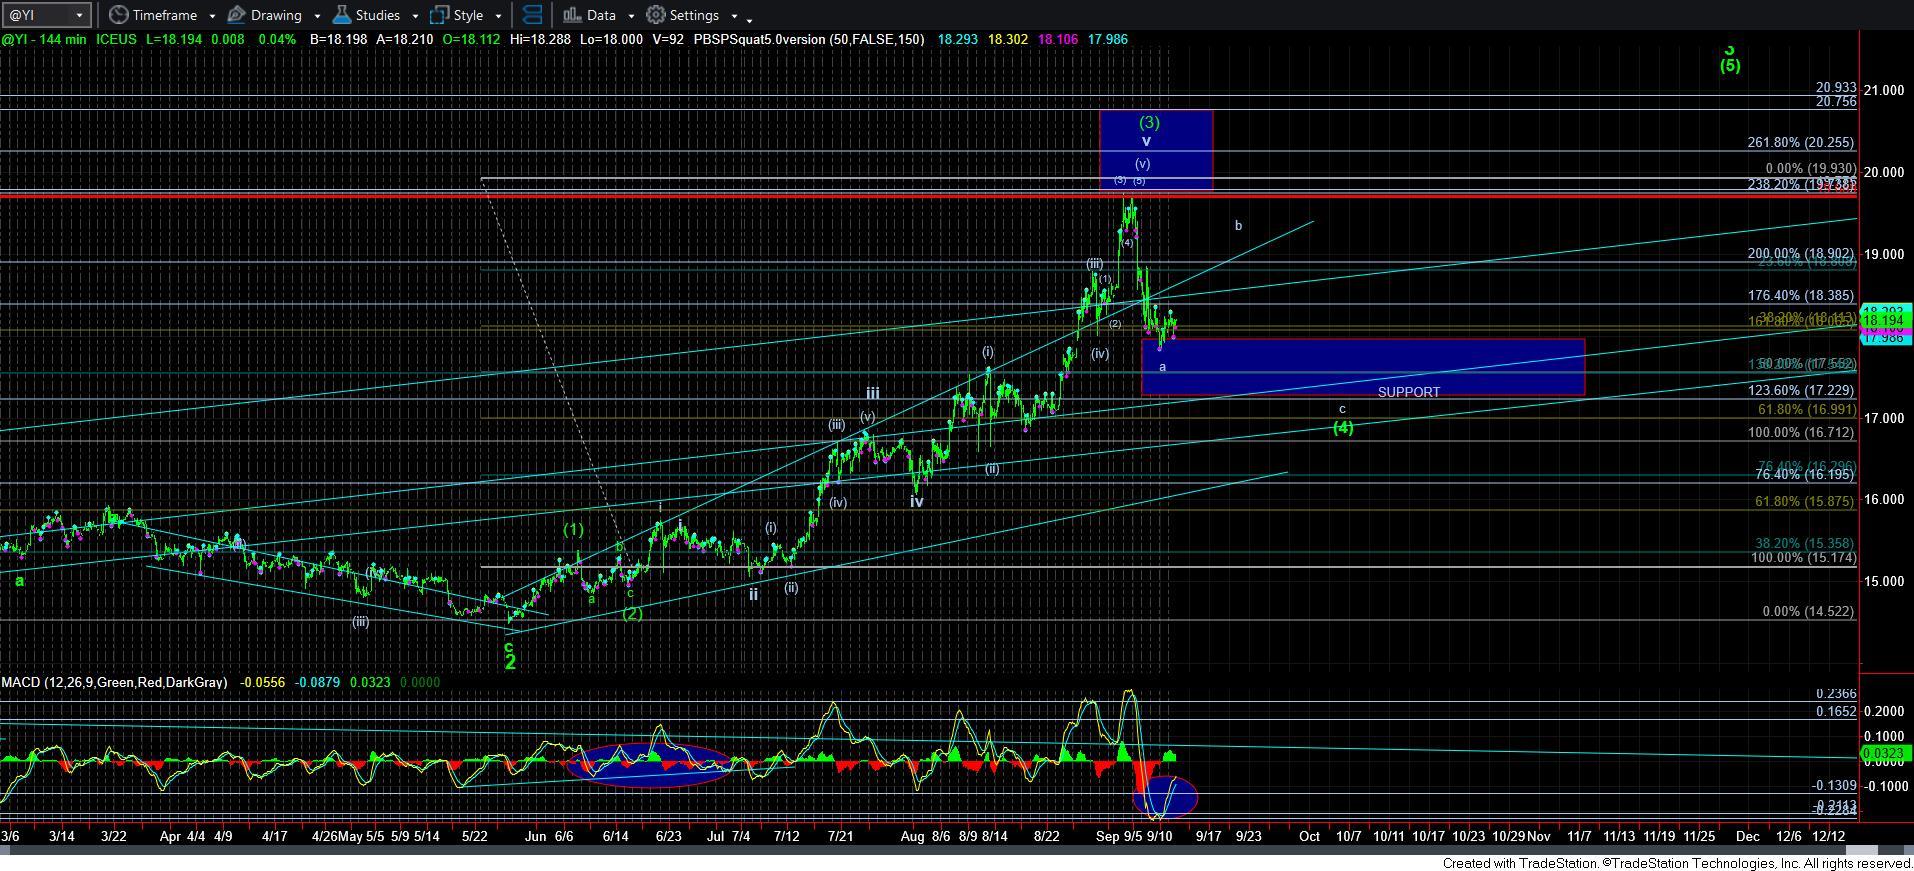
Lastly, when I review silver, it also looks like it is just completing an a-wave within a larger corrective structure. And, unless the next rally is going to be clearly an impulsive 5-wave structure, I will maintain this current perspective. I would imagine this would mean that silver can lag some of the other charts if I don’t see something more bullish developing. But, due take note of the 144-min MACD on the silver chart, as it is suggesting that silver has either bottomed, or has one more nominal lower low before we begin the next rally.
When I take all this information into account, I come to the conclusion that there could be some minor weakness left in the complex, with some charts still having potential of seeing one more nominal lower low. But, to me, it looks like bottoming action based upon a number of factors outlined above. The only question is what wave degree is each chart bottoming at, and it could very likely vary.
For now, I am still going to be treating the next rally as I have been outlining before. I will be treating the next bounce as an opportunity to hedge my positions using puts on GDX. However, if that “bounce” develops into a very impulsive structure, especially in NEM and GDXJ, wherein they then take out their recent highs, I will likely stop out of any hedges, and may consider leveraged long positions in those charts with the most room overhead (NEM, GDXJ, RGLD, etc.). So, I intend to stay on my toes and will let the action over the coming two weeks guide me as to how to view the complex as a whole, with the strong potential that we may see a bullish development unexpected by most, especially after this recent strong decline.