Silver Following Through - Market Analysis for Sep 6th, 2023
I have often mentioned that the metals complex can get bifurcated at major turning points. For example, while silver topped in April of 2011, gold continued to rally until September of 2011. We saw the same type of bifurcation in the last quarter of 2015 as the complex was bottoming. And, then silver did not see its true lows until March of 2020 when it struck $12.
So, not everything runs the same in the metals complex.
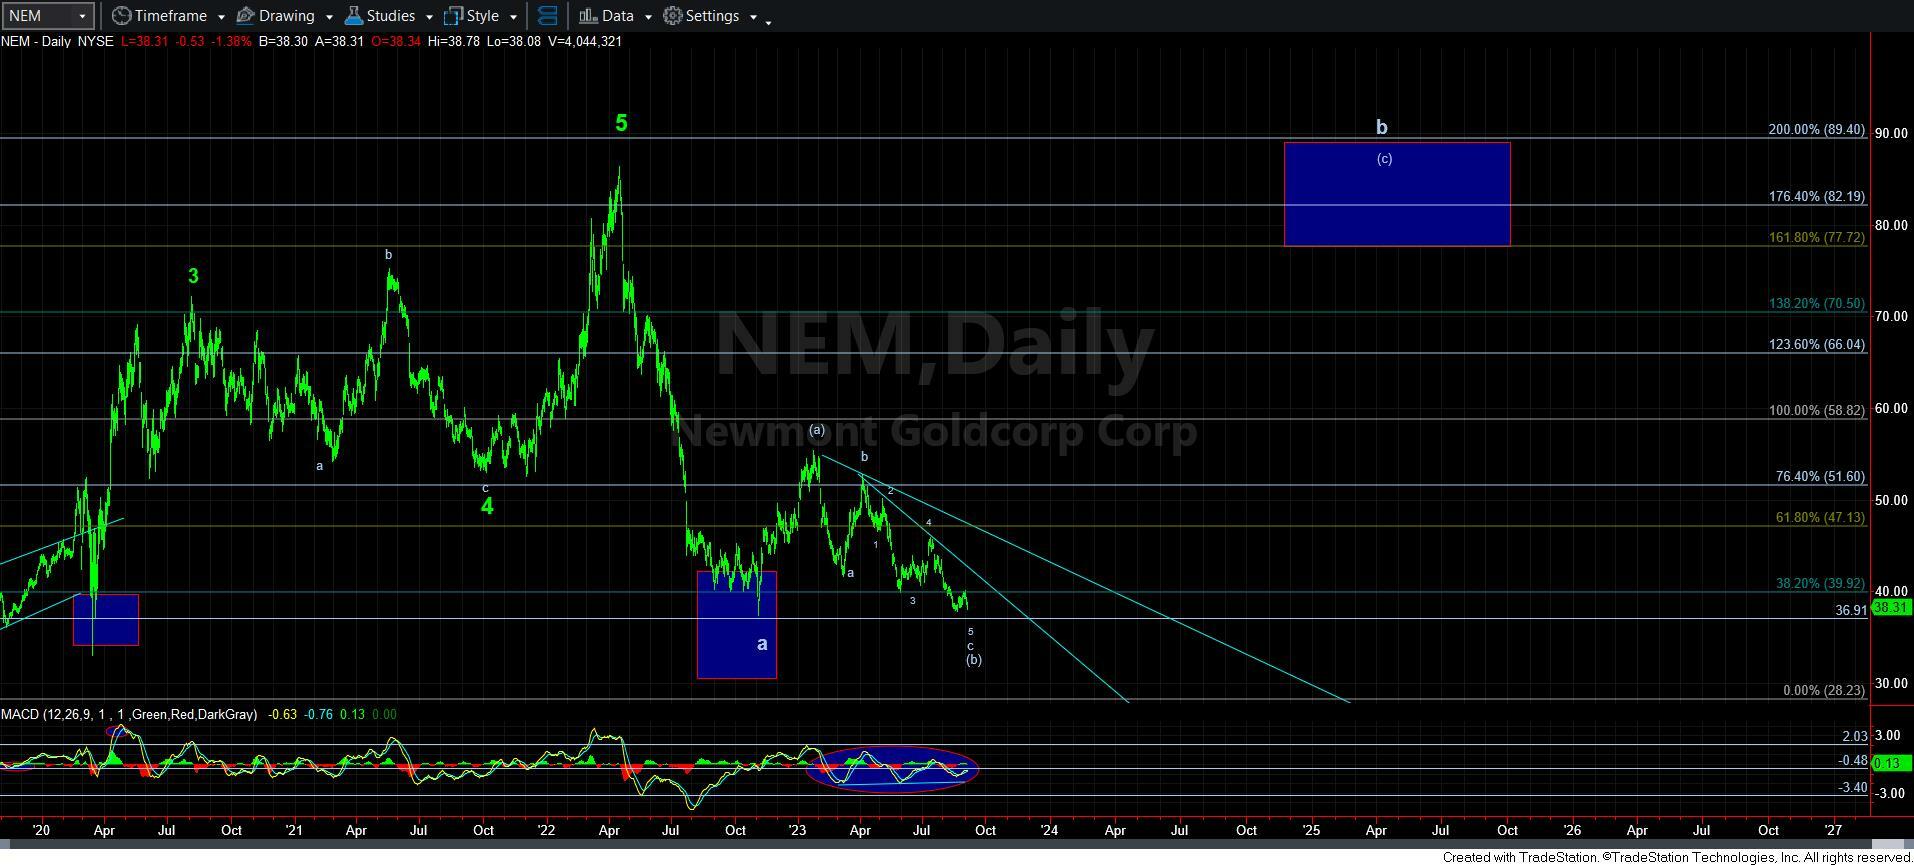
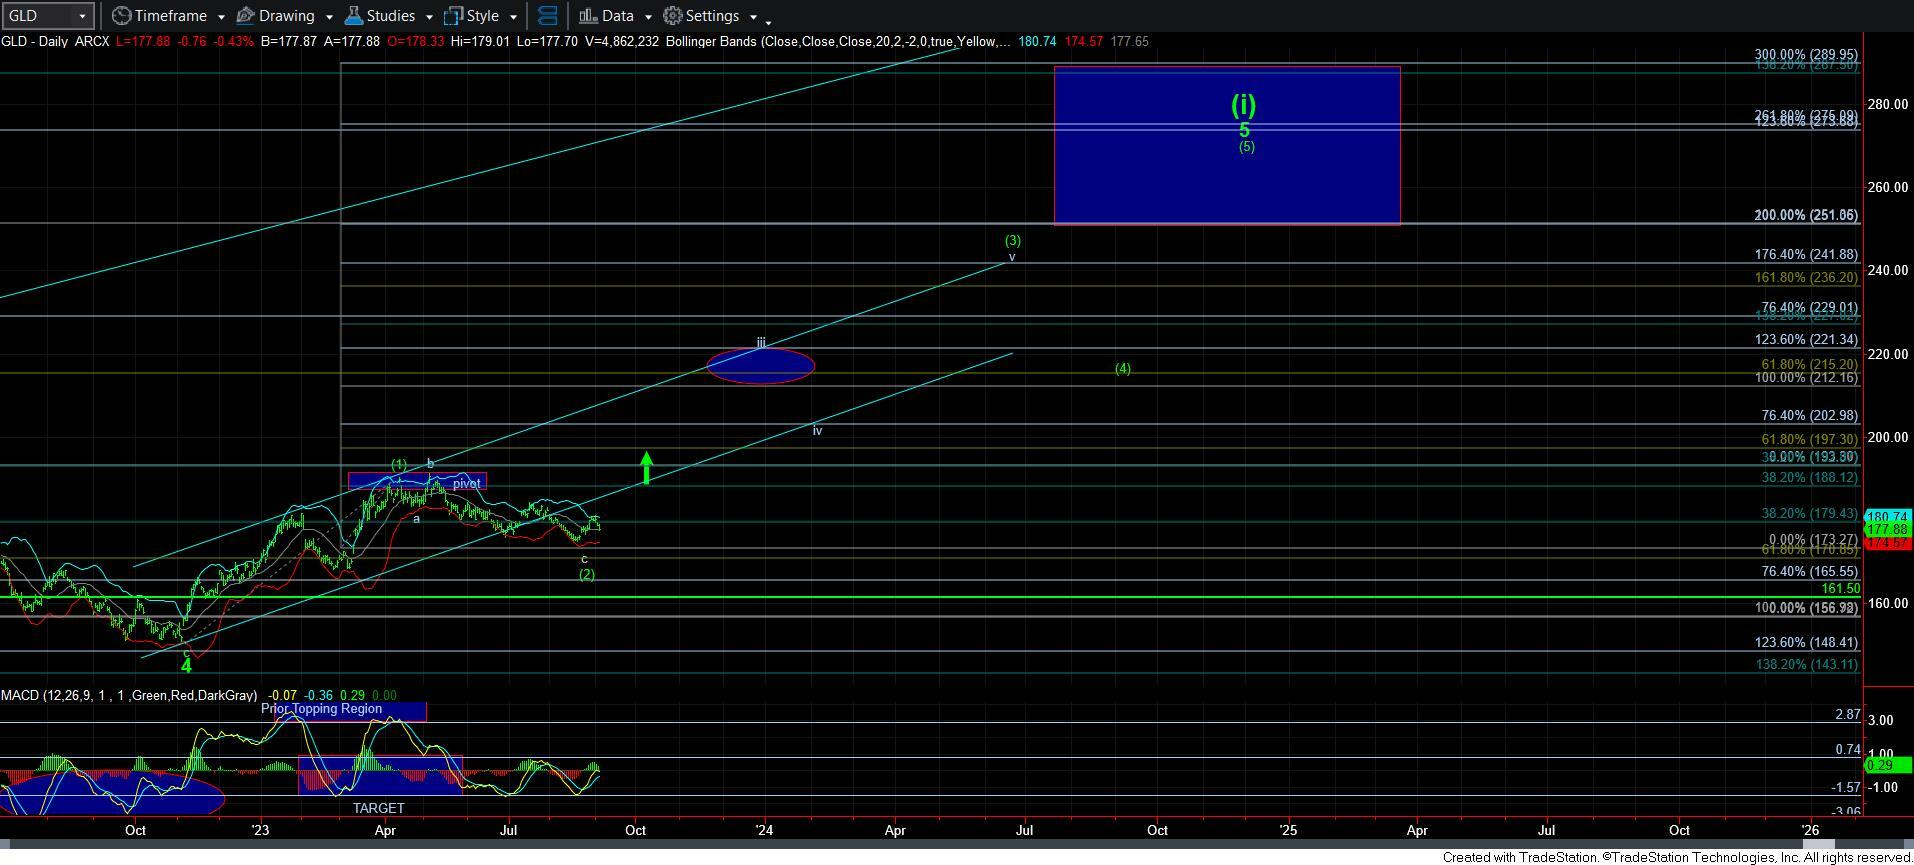
As I have been saying of late, I am unsure of gold has actually bottomed. So, I am just going to be watching that over the coming week to see if it provides any further clues as to whether it may want to try to see a lower low or not.
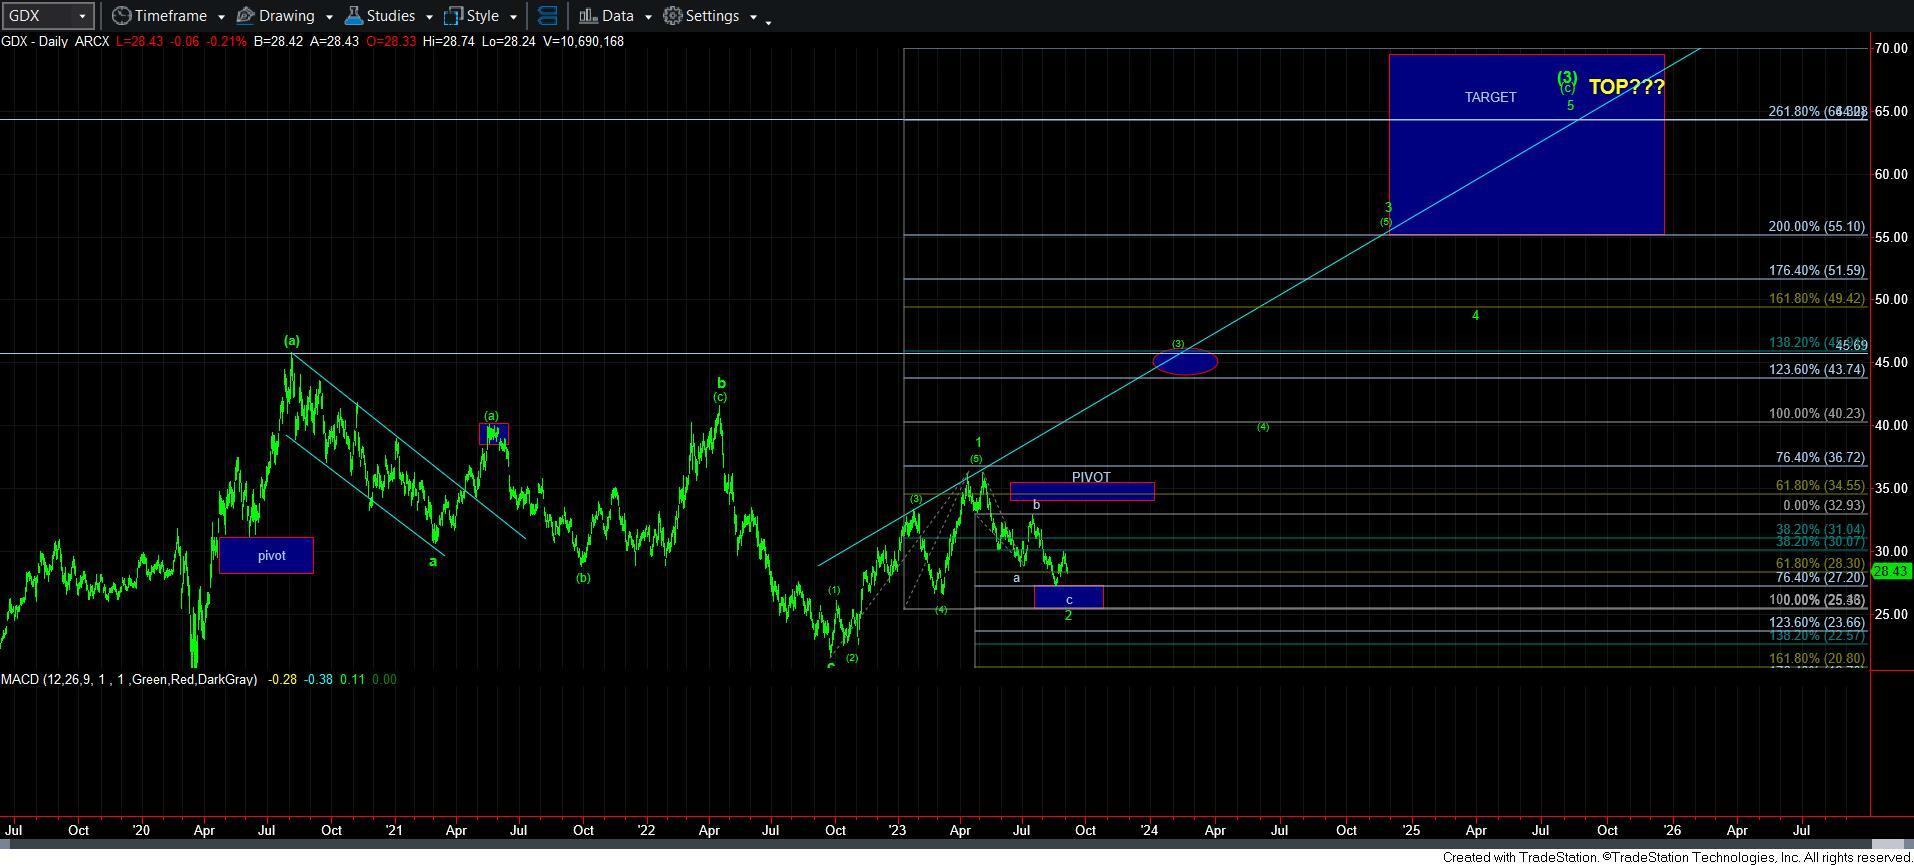
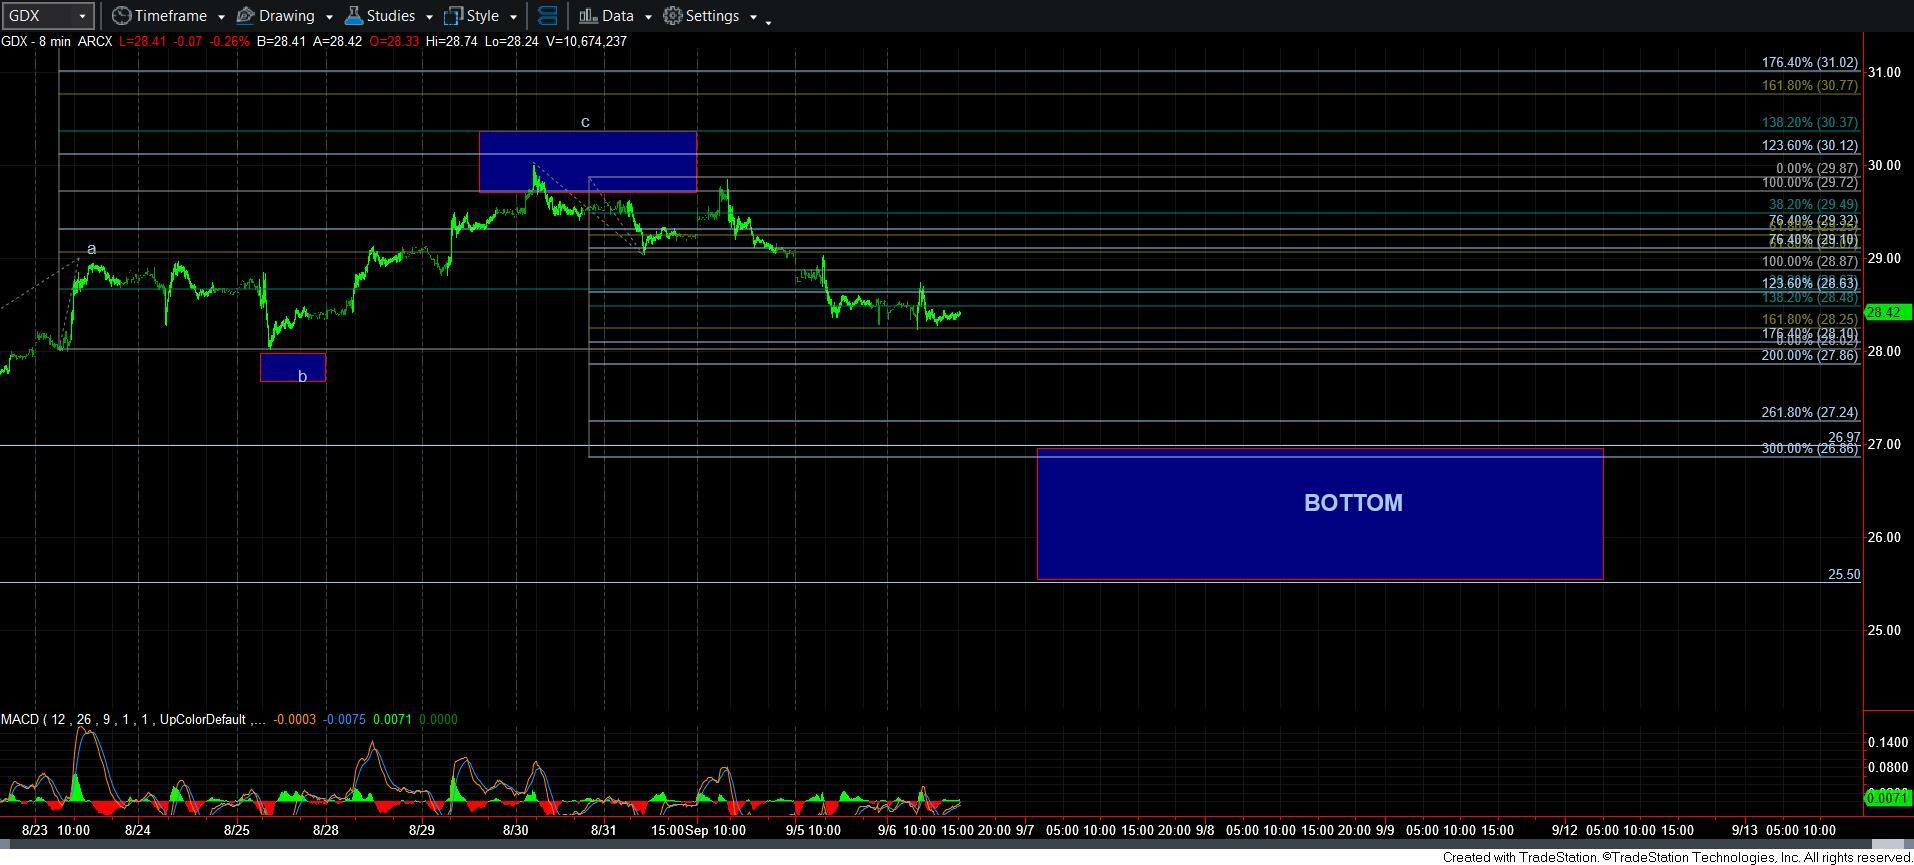
As far as GDX, well, this is a bit more complex. As I noted in today’s live video, it is comprised of many different individual mining stocks, some of which have not bottomed, and some of which have bottomed. Yet, the largest holding likely still should see a lower low before it completes this decline. So, I am maintaining an expectation that GDX will see a lower low. But, due to this push/pull between the various stocks within GDX, I cannot say we are seeing a very clear structure in this last decline in GDX.
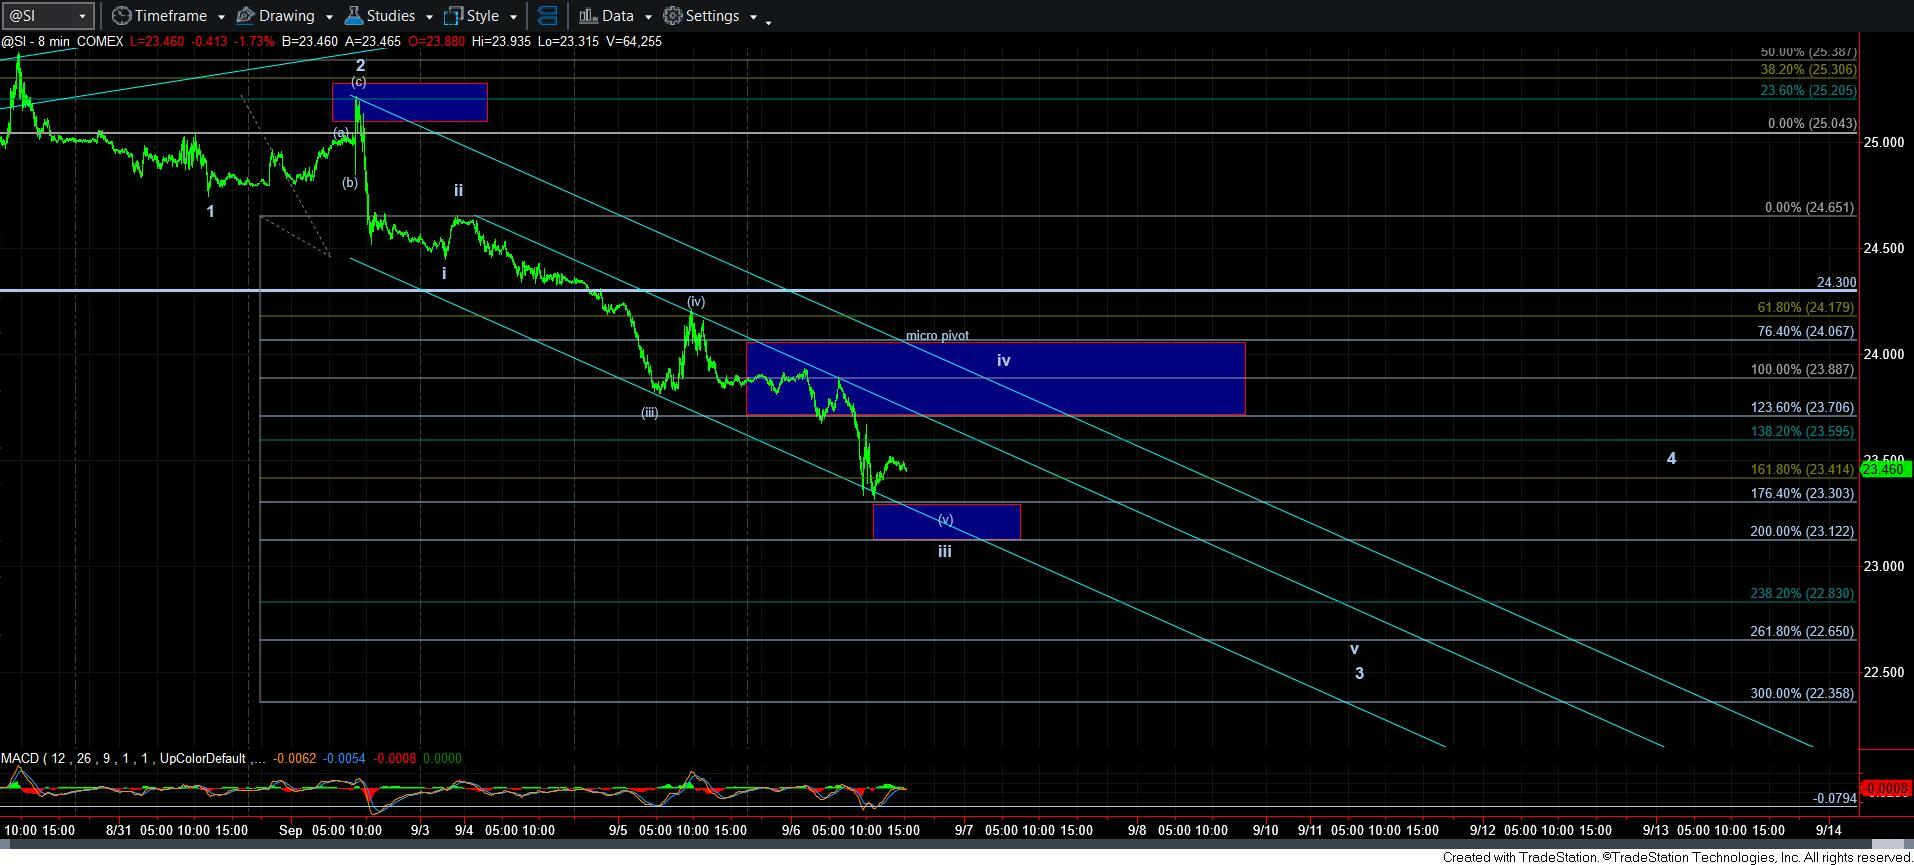
Silver is really providing us with the nicest structure for this decline thus far. And, if you look at the attached 8-minute chart on silver, you will see that I have us bottoming in wave iii of 3 in this [c] wave. Therefore, as long as we hold the 23.12 region, I am expecting to begin a corrective wave iv bounce in the near term, to be followed by a wave v of 3 decline pointing us down towards the lows we struck in June and August in the 22.60 region.
As of now, I do not think we are yet seeing extensions that would suggest that we are going to target the 21.50 region for this [c] wave decline. Of course, that can clearly change during wave v of 3 or even during wave 5. But, for now, I am only seeing us projecting down towards the 22 region to complete this structure.
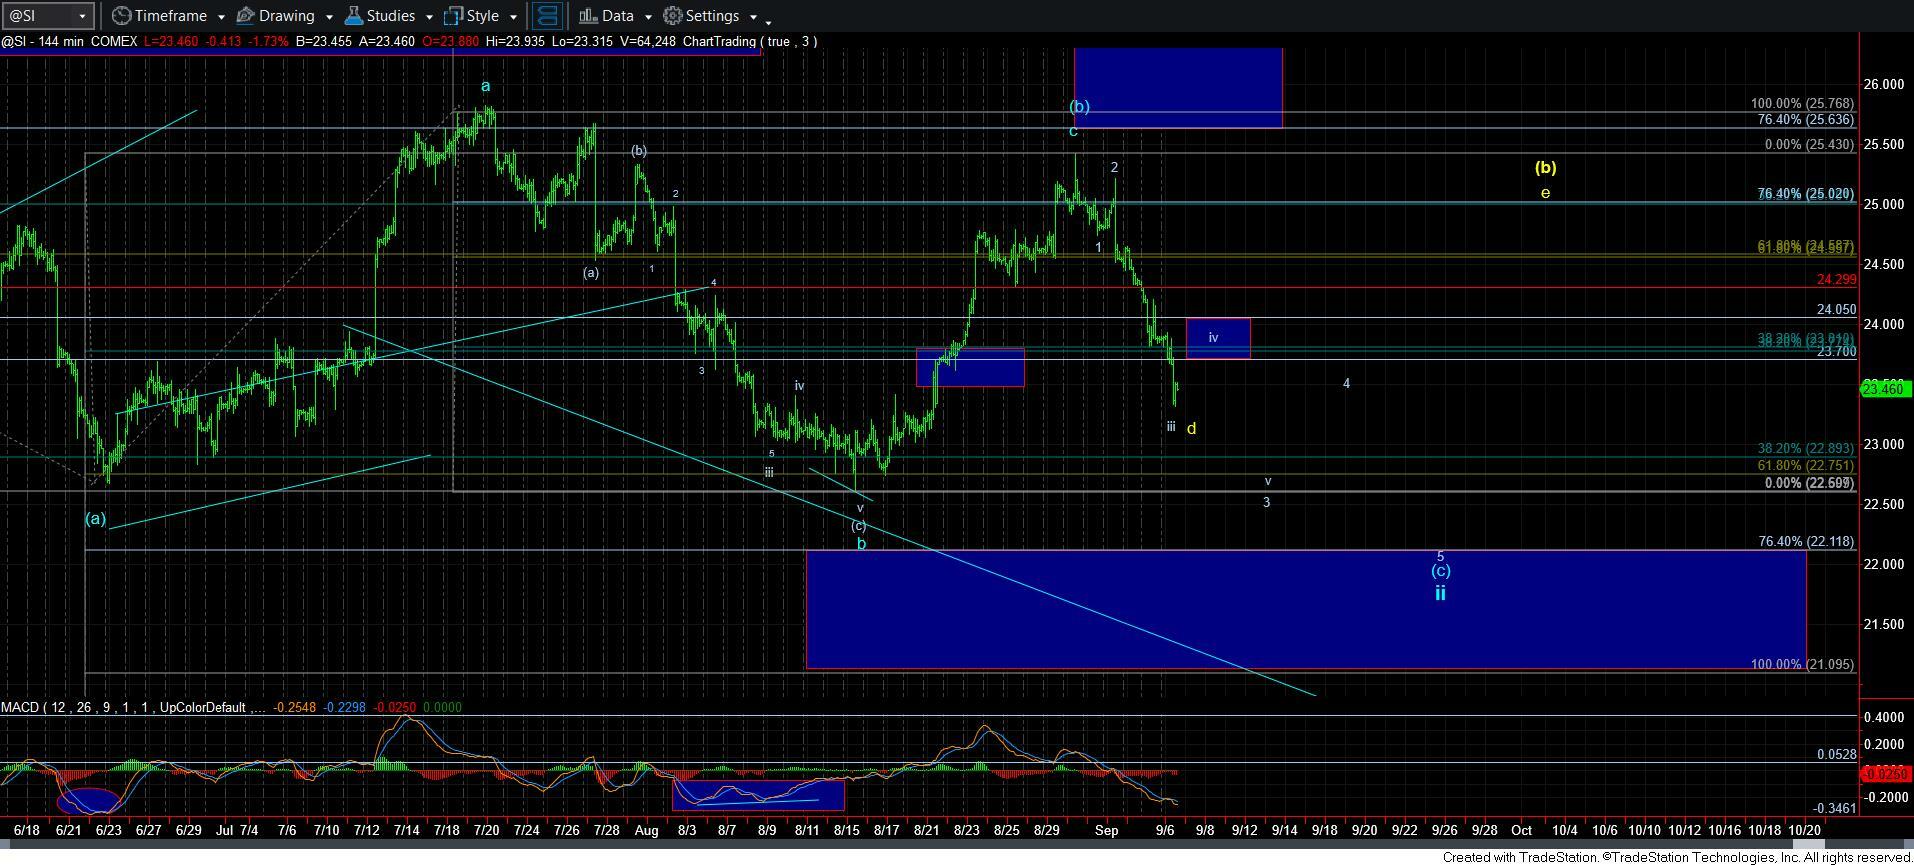
In the meantime, I am also following the MACD on the 144-minute chart. With us likely completing wave iii of 3, we should begin to see positive divergences with the wave iv of 3 bounce. And, we will want to see these continue through completion of waves 3, 4 and 5 to support our bottoming count.
Of course, I have to consider an alternative count as well. Should the market be able to break out through the wave iv resistance box, then I will have to assume that we are still within a [b] wave triangle within wave ii, and it will push out the completion of this wave ii in time, as we would still need a [c] wave decline thereafter.
So, in summary, I am going to be following silver the most closely, as it has the cleanest chart at this time. And, as long as silver continues to follow through on this 5-wave structure to the downside, then we will likely have a much stronger way to indicate a major bottom is likely being struck.