Silver Continues To Lead The Way
Well, to be honest, it was gold that made it quite clear that the rally we were seeing was likely a [b] wave. And, my view now is that we are likely in the [c] wave decline of wave ii. But, I will note that silver has the cleanest wave count to the downside, so that is what I will be following for the micro structure.
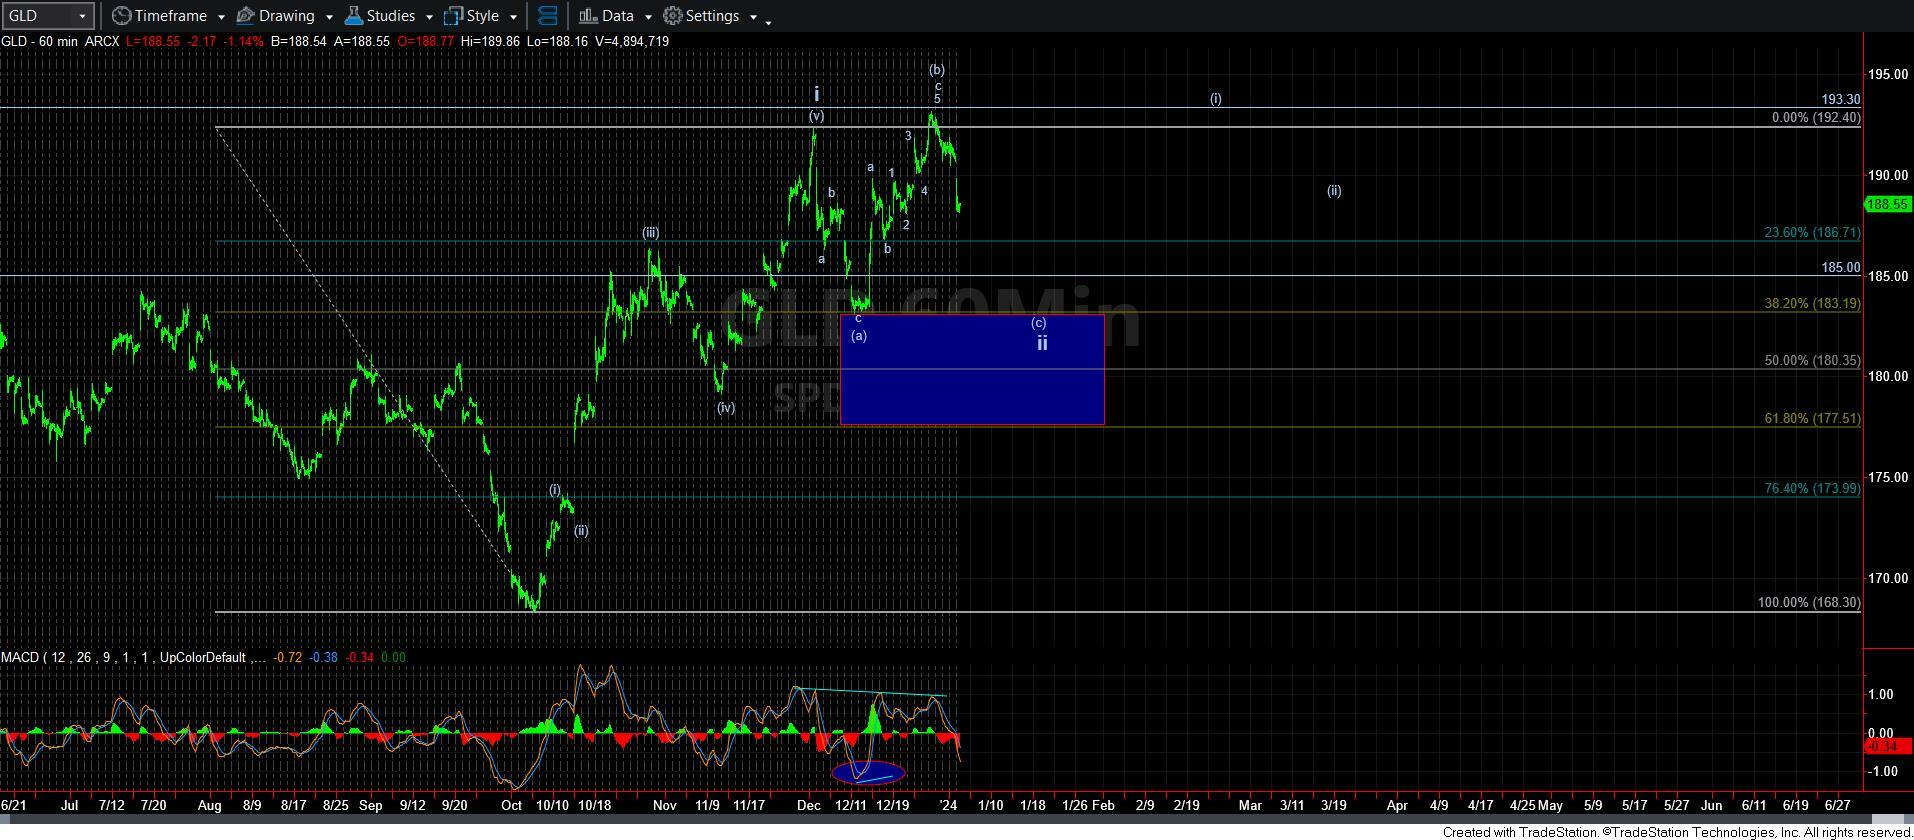
I want to highlight something I posted as an alert earlier today in the chat room, and which I also highlighted in my full-membership live video this morning. Take a look at the daily chart on GLD. Once we complete this [c] wave of wave ii, we will be going on “Break-out Alert.” You see, once the [c] wave completes, we will likely reverse in a 5-wave rally for wave [i] of iii, get a small pullback, and then break out in the heart of a 3rd wave. At this pace, we may only be several weeks away from that happening. And, it will trigger what will likely be a 3rd wave rally that can take us through the rest of 2024.
So, please maintain your perspective at all times now.
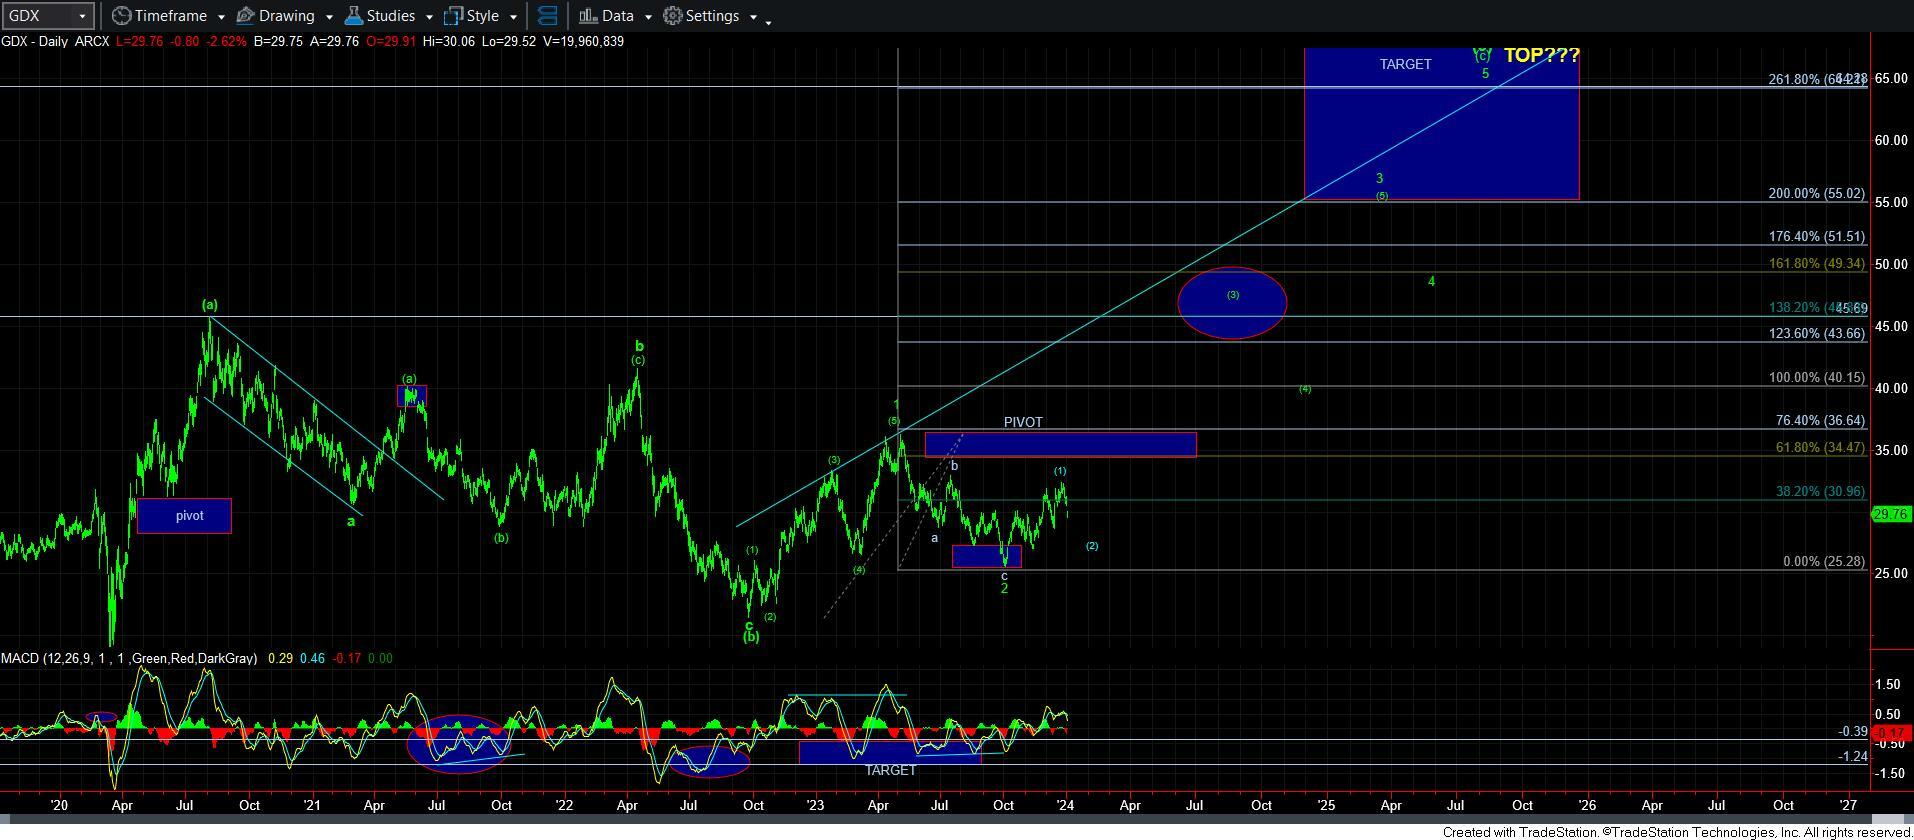
Both GDX and silver present in the same way on the larger scale. In GDX, we are currently in the wave [2] pullback, and I am seeing the 27-28 region as our support. Should that support hold and we see another 5-wave rally off that support, we will have a break out set up similar to what I just noted in gold.
And, of course, silver is presenting in the same manner. But, silver’s decline seems to be a bit more clear in its structure than the other charts. While I was trying to patiently await a [1][2] structure over the last week before we began this decline, the market snuck by with a smaller [1][2], followed by a 1-2 in wave 3. And, that is how I am viewing the chart at the moment.
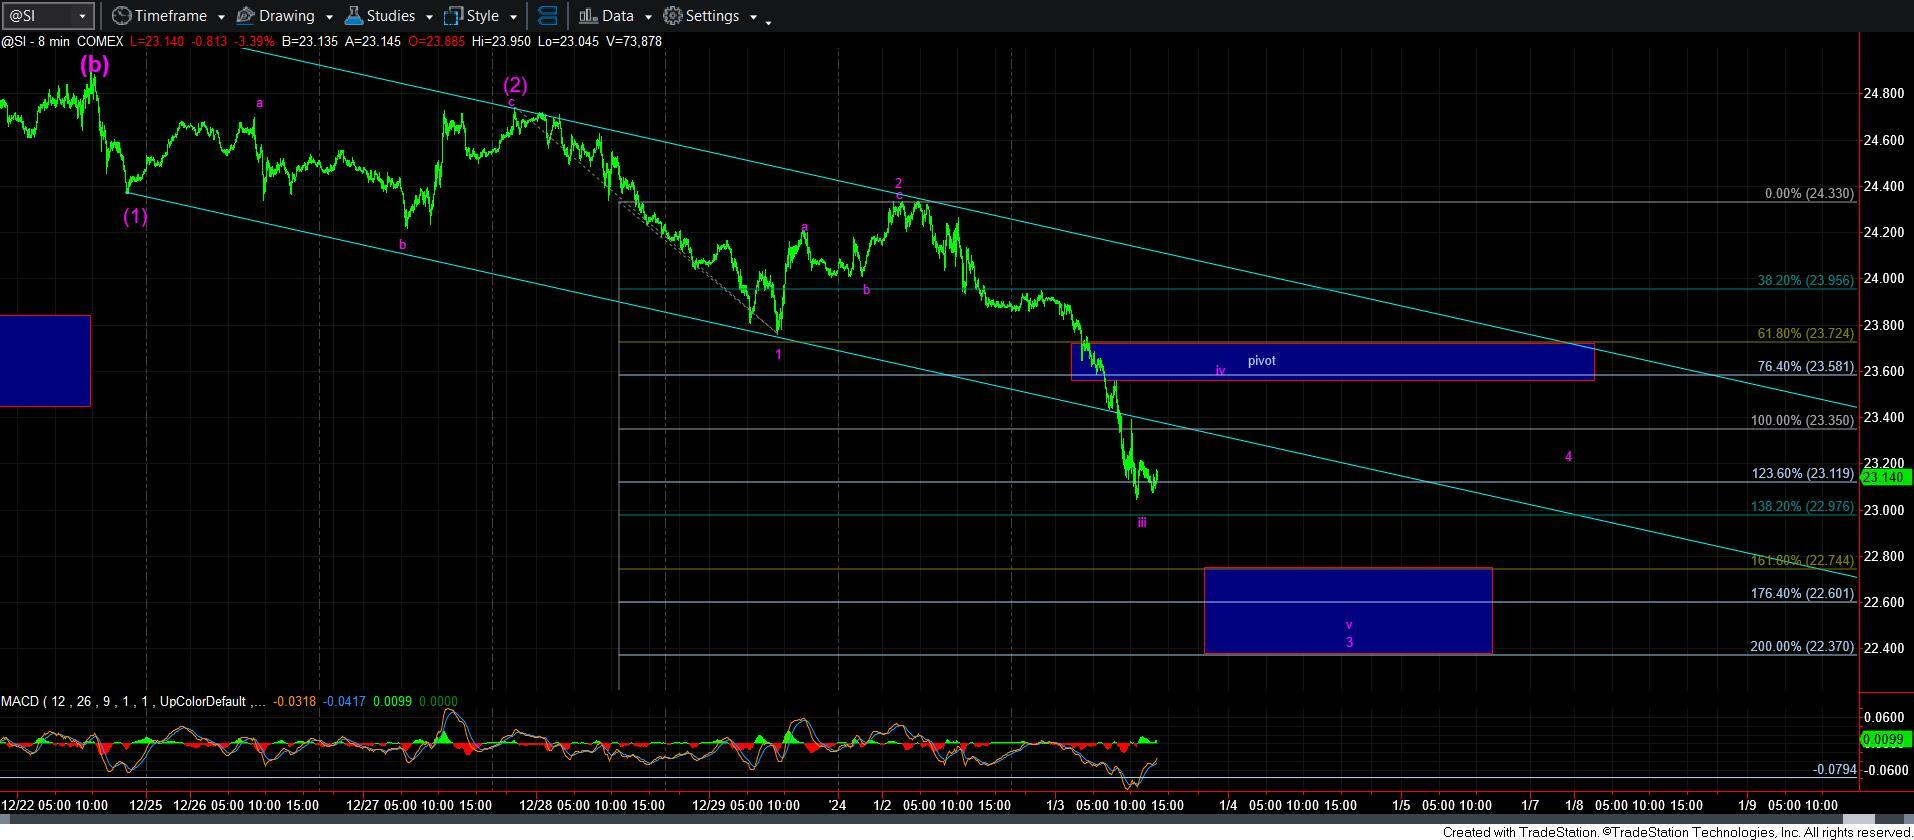
If you look at the 8-minute silver chart attached, you will see that I am viewing the current decline as completing wave iii of 3 of [3] in this [c] wave. Our resistance is noted on the chart as the micro pivot, and as long as we remain below it, I am looking to continue lower to complete this [c] wave of wave ii. But, do not assume that we MUST bounce to the pivot, as it is entirely possible that we just consolidate before we continue lower in wave v of 3.
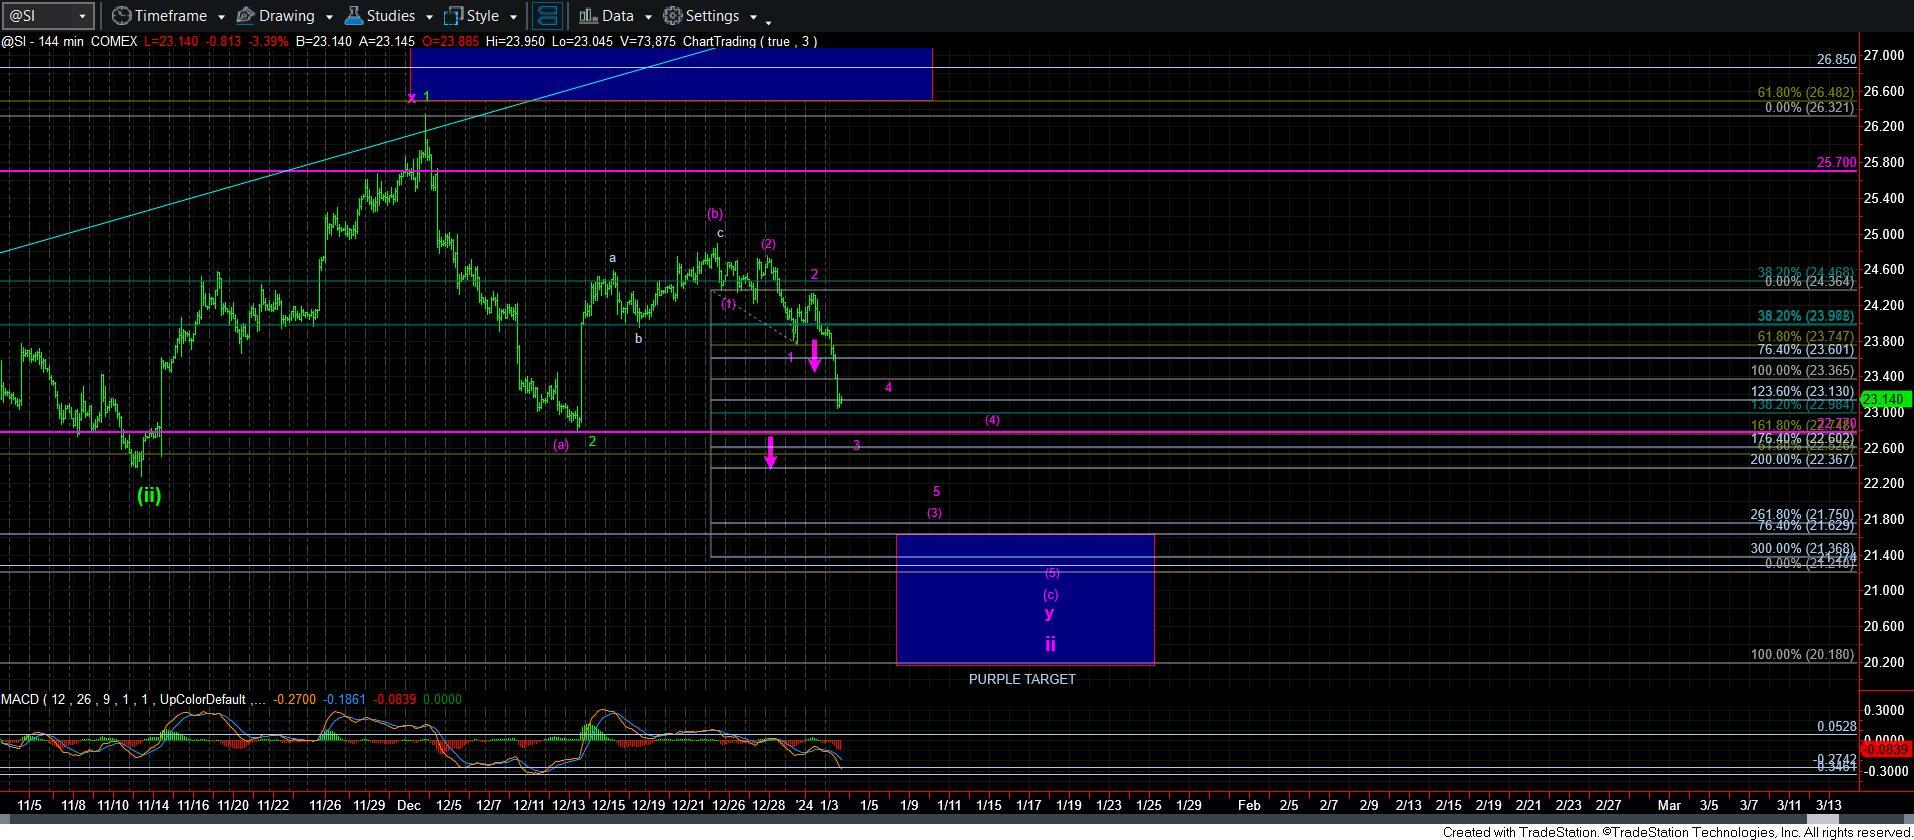
Furthermore, the depth of the drop into the box below on the 144-minute chart will depend upon the extensions we see in wave [3]. If we get to the top of the box in just wave [3], then it makes it a bit more likely that we can continue in the [c] wave to the bottom of the box.
As far as the micro count in gold, I am going to assume the same micro count, based upon the GLD chart. So, I am still expecting us to get back down to the support box on the 60-minute GLD chart before this [c] wave completes.
In summary, we are getting that last pullback before the market is primed to begin the heart of the 3rd wave for the metals complex. And, it seems that most of the charts I am tracking are setting up in the same posture, and may only be weeks away from the heart of the 3rd wave taking hold.