Silver Breaking Out?
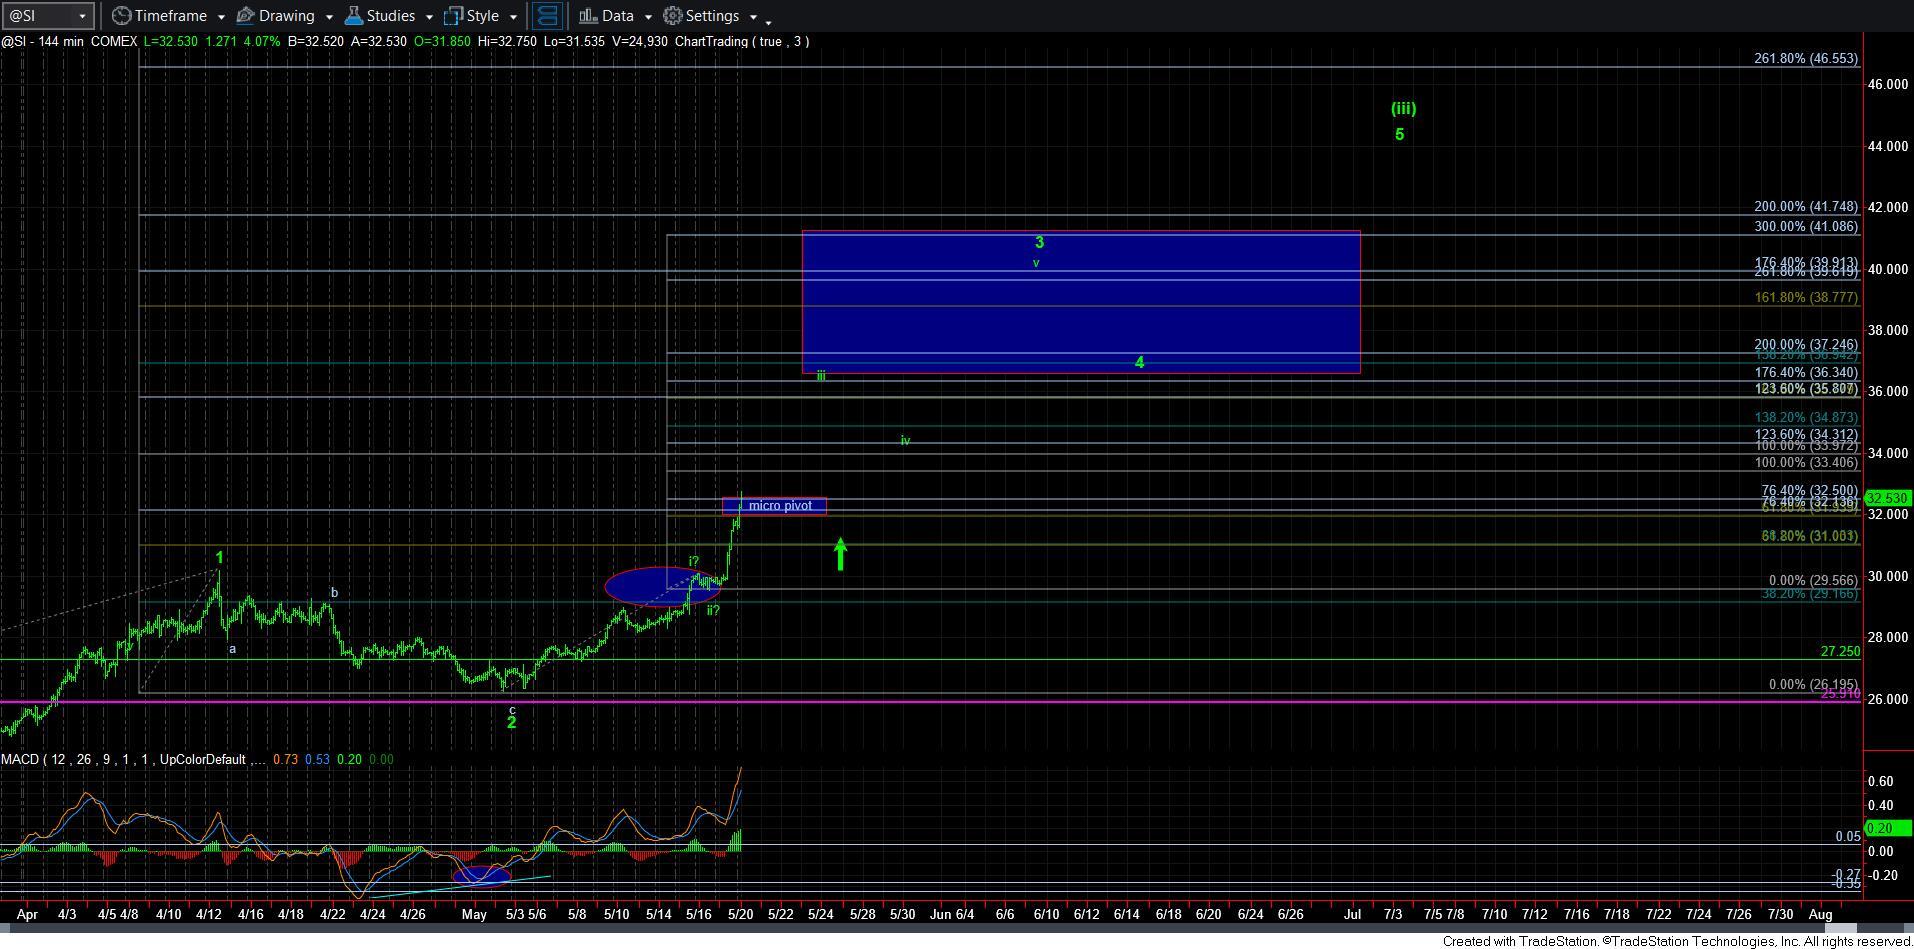
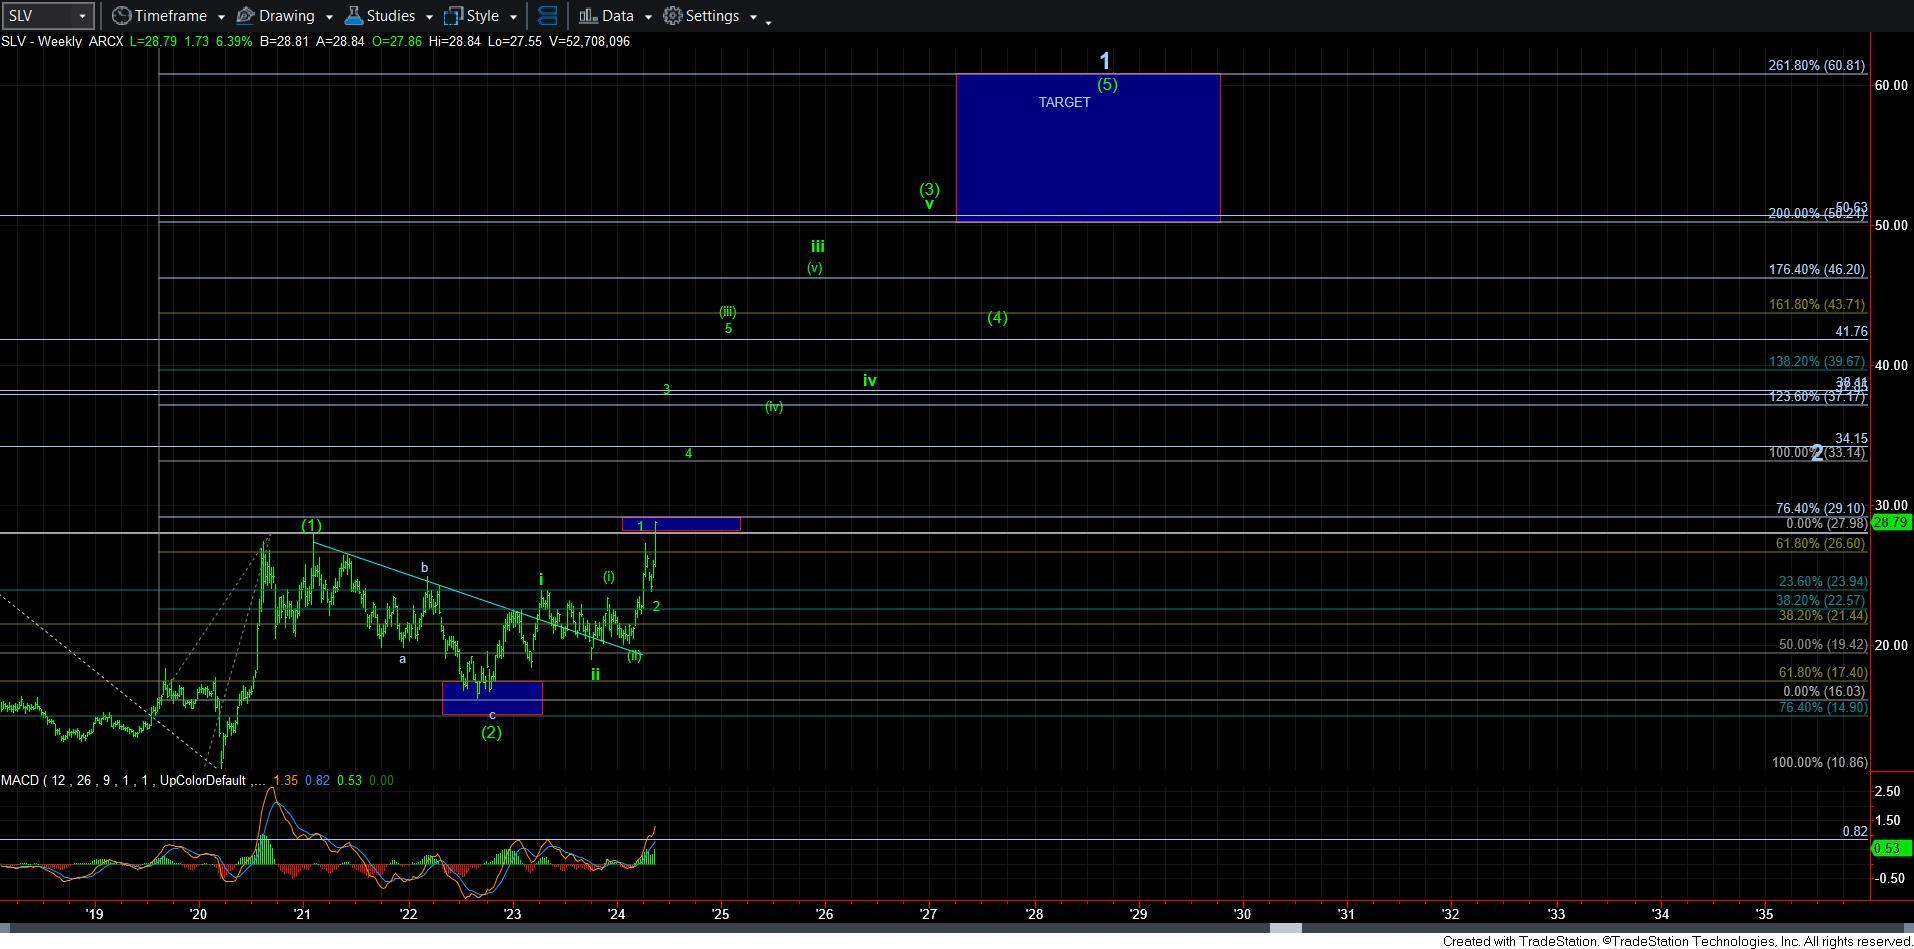
Before I call it a night, I went back to align the counts on SLV and SI due to the potential move through the pivot noted on the 144-minute chart. Please do not take the timing as gospel, as this can happen a LOT faster than this is showing here, especially if we follow the action we saw in 2010-2011.
The point of the chart is to show you that if we hold the micro support of the pivot this week then it gives you an idea as to how we are just starting the 3rd wave, and all pullbacks will likely be MUCH smaller as 4th waves from now on. Again, keep in mind that this is simply a general path, and we will adjust it accordingly as we move through the progression of the 3rd wave.
But, again, the main point is that if we hold the pivot as support over the coming 24-36 hours, then we are likely in the heart of the 3rd wave..
Good night.


