Significant Bottom Setting Up Target Zone Near 2800
 By
Ricky Wen
By
Ricky Wen
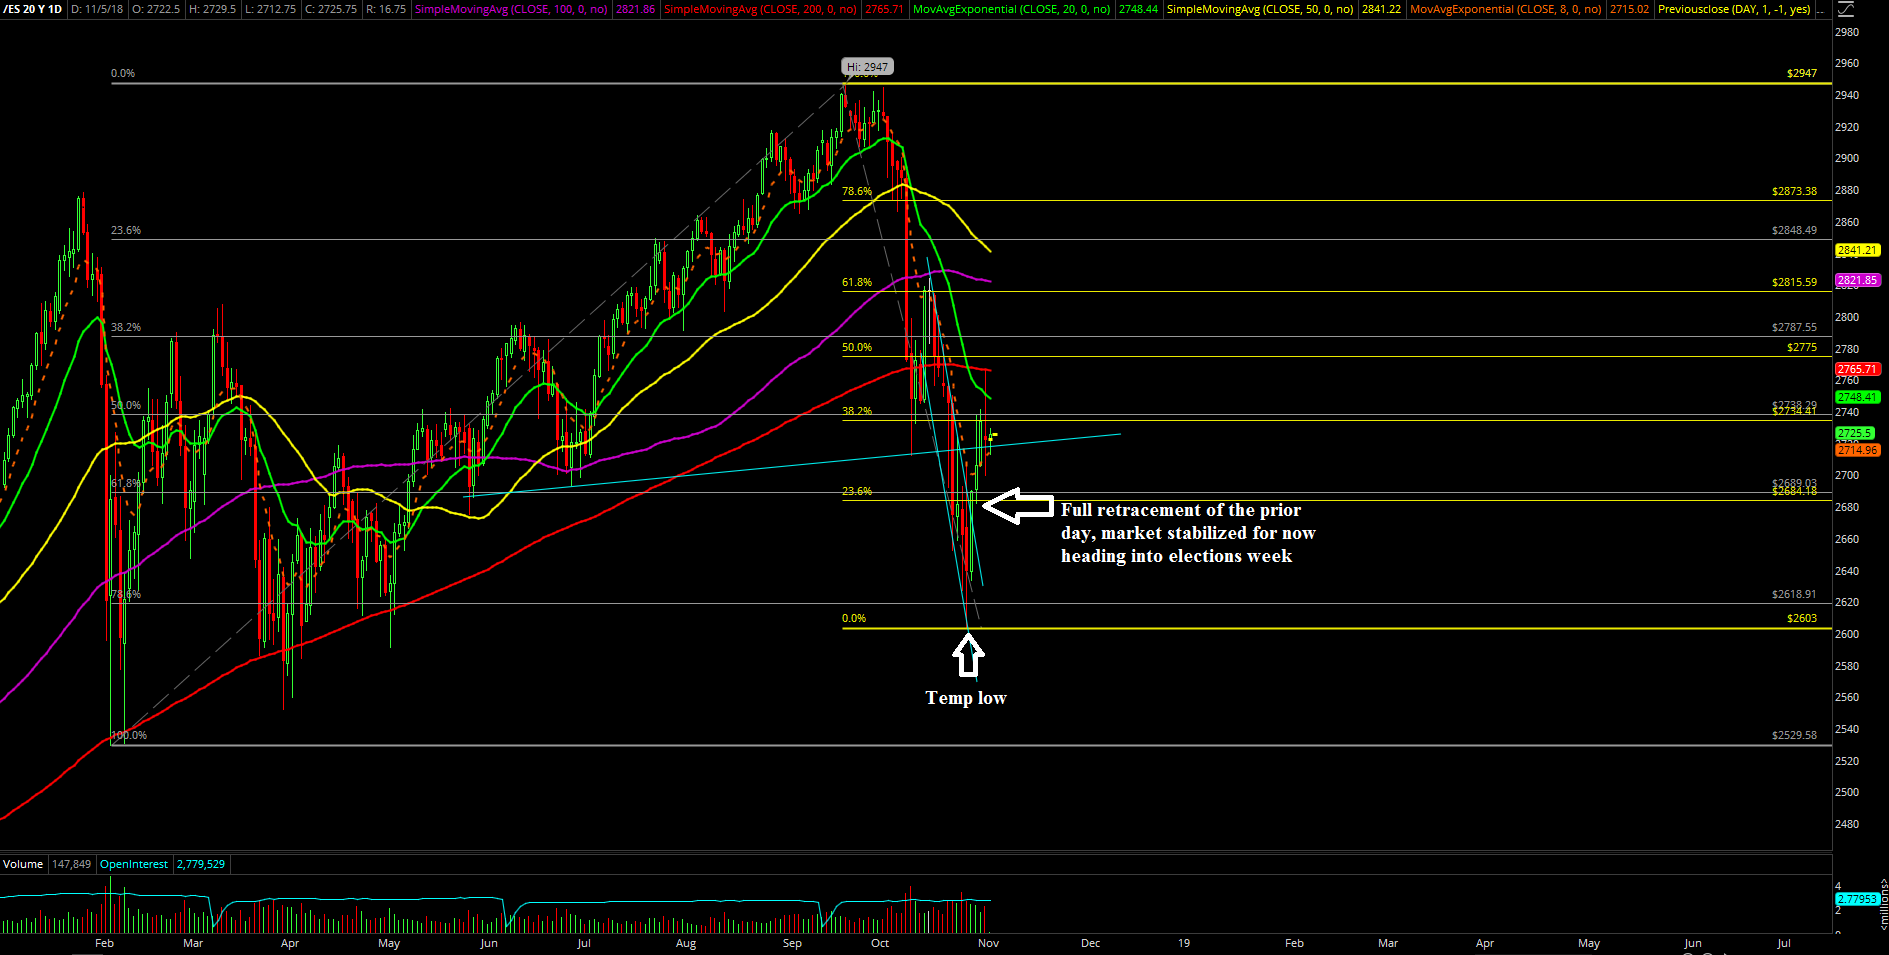
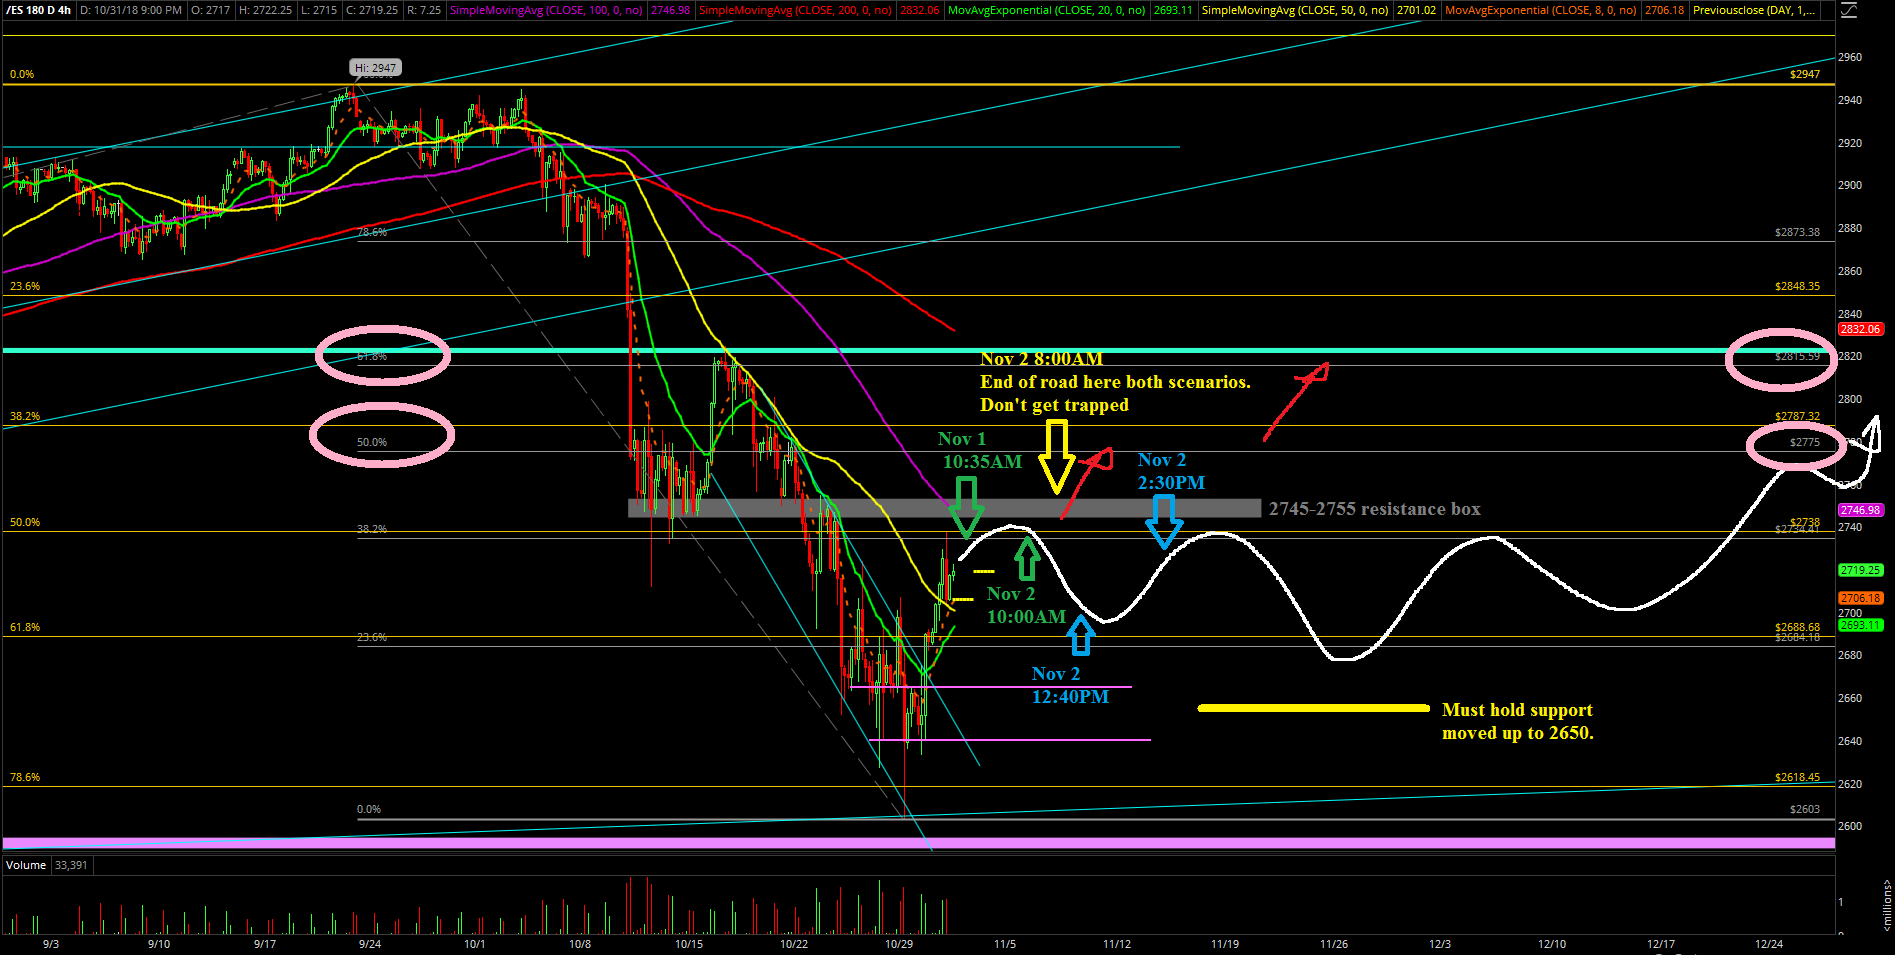
Last week’s action was primarily about the significant temporary bottom formation as the market stabilized by finding a bid at 2603 on the S&P 500 on Monday near the major support levels. The bears failed to close at the dead lows that day as the final 30 minutes of regular trading hours saw a rally of almost 40 points back into the range. Then, the bulls made an immediate continuation to the upside during Tuesday’s session, enhancing the odds of such a temporary low of 2603. The rest of the week became fairly textbook with the grind up back into the 2745-2755 resistance box following the 4-hour white line projection. On Friday morning, we cautioned traders about the potential trap/bait with the the market overshooting to 2760s (200 day moving average) just before the NFP timing catalyst. Subsequently, the market managed to break below 2745 to confirm the high of the day was in, and the flush began to accelerate to the downside following the roadmap.
The main takeaway from last week was about the stabilization and significant temporary bottom heading into the midterm elections, so we have several reference levels to trade against. The mentality heading into this week is about how to effectively trade into the intermediate 2775-2815 target zone given last week’s setup. Traders really need to be prepared for some overshoots given it's a news dominated week, especially on Tuesday.
What’s next?
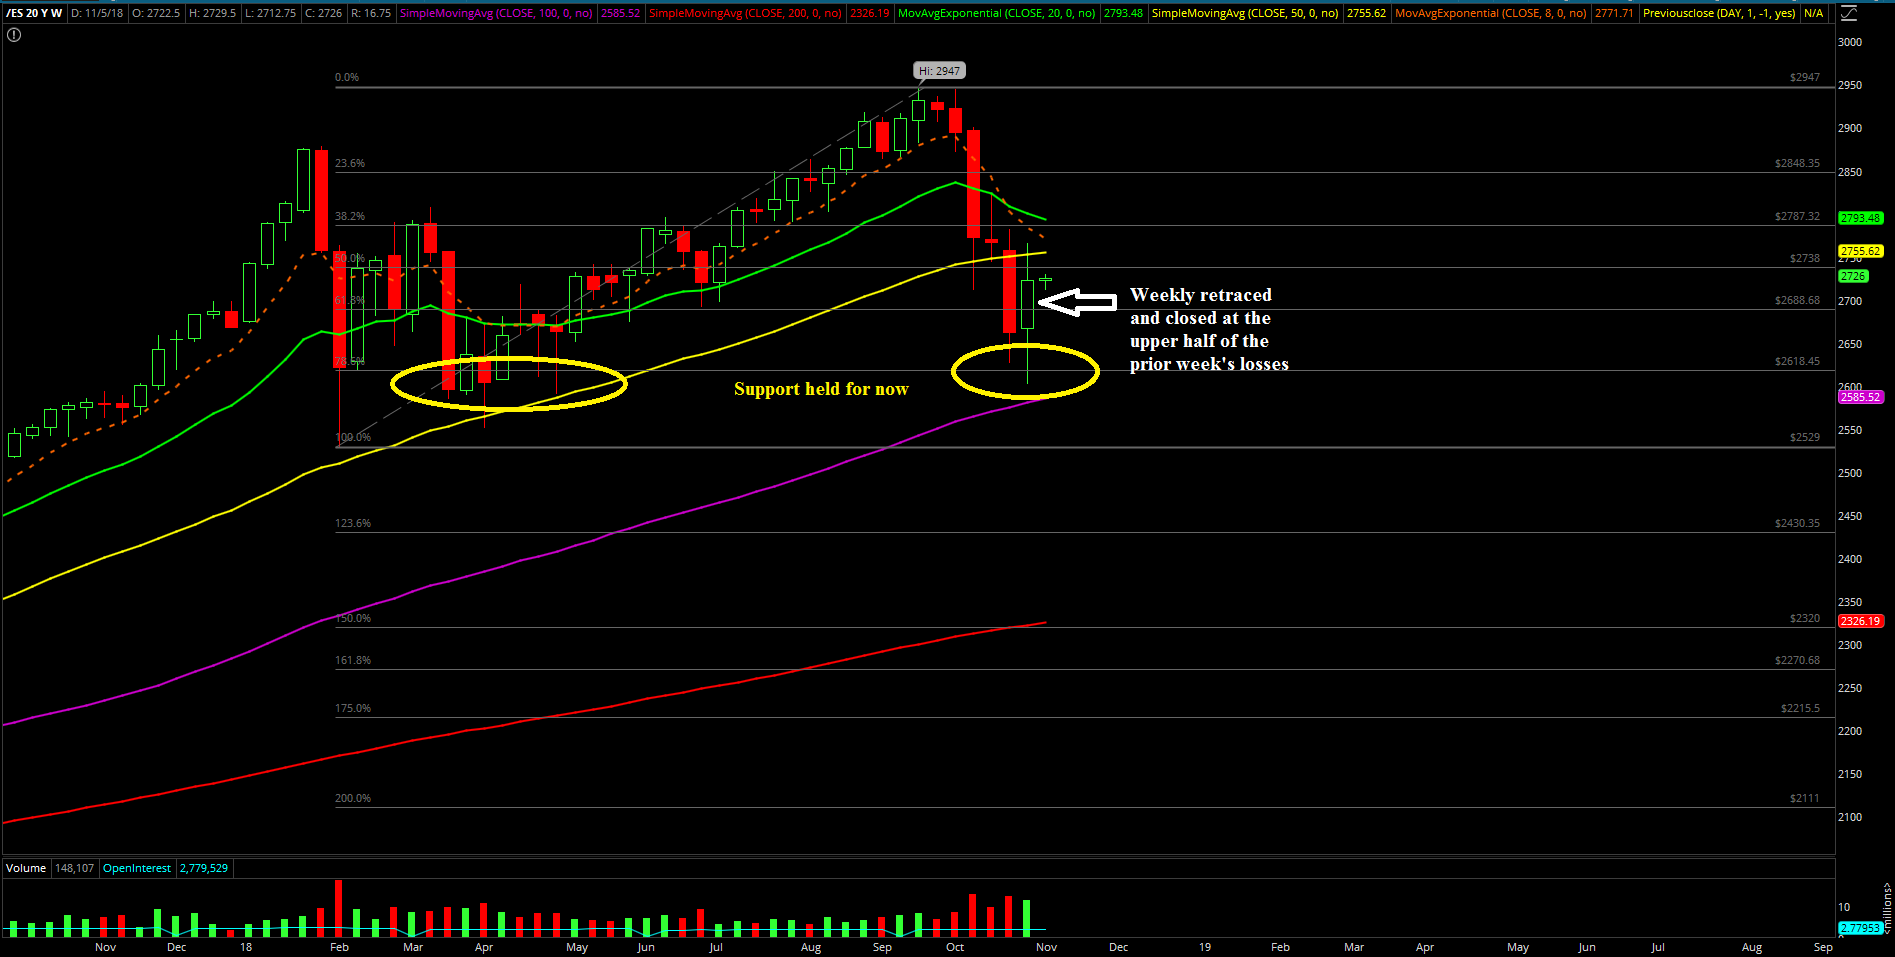
Friday closed at 2722.5 as a doji candle that was rejected by the 200 day based on the 2766.25 high that trapped traders before the NFP timing catalyst. Zooming out a bit, the weekly chart agrees with the significant temporary bottom formation given that 2603 was within the 2620-2590 support range and that 2600 is a psychological 100-point level. It is also showcasing a standard "hold half and go" setup that aligns well with our roadmap and game plan on the lower timeframes.
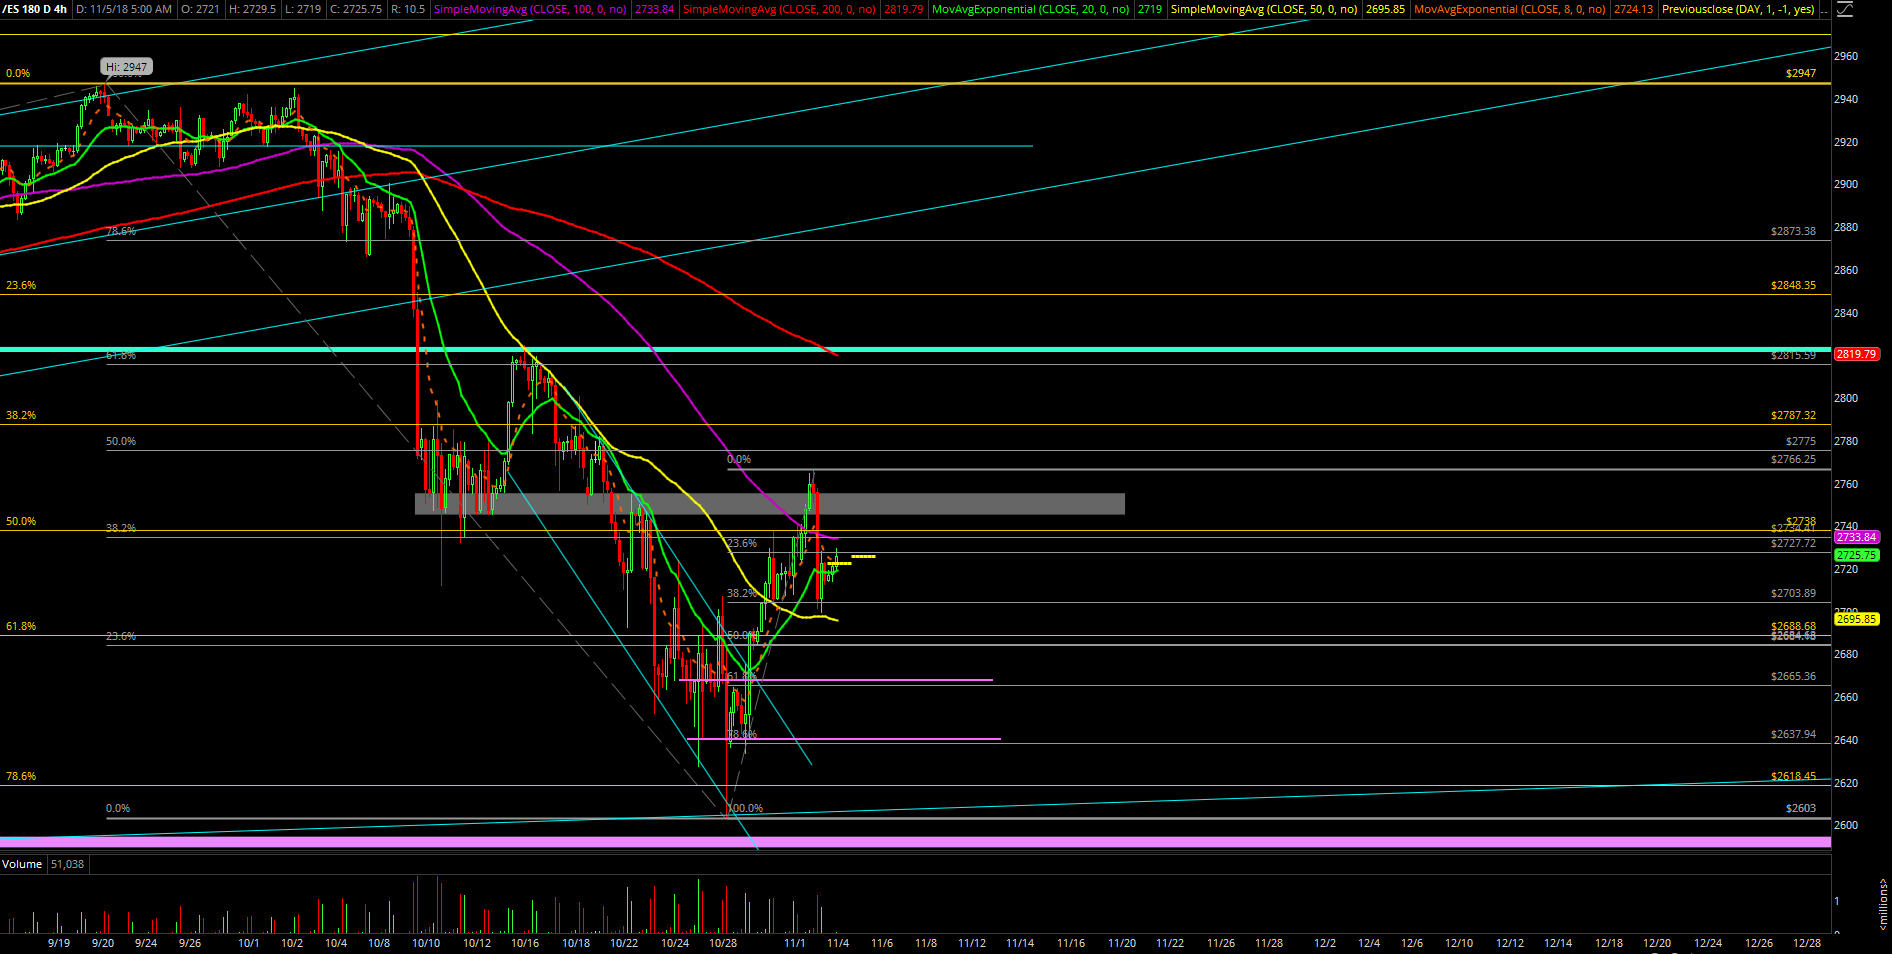
Currently, the price action is still following the 4-hour white line projection from the prior week and we’re looking for the backtest against support around 2680 in order to complete the setup later at the 2775-2815 region. At this point, current resistance remains the same at the 2745-2755 resistance zone where Friday dropped below it and flushed into 2700 before wrapping up the week.
The daily trending support remains the same at 2660; the odds would start to deteriorate dramatically or the whole setup changes. This also means that we have a reference level to trade against and it's also easier to plan our risk/reward if the market follows our roadmap. The 4-hour white line projection we drew last week serves as our roadmap for now until price proves otherwise. On another note, if the bulls become more bullish than we expect, then an immediate breakout decisively above 2745-2755 could morph the pattern into some sort of immediate continuation instead of just following the current roadmap.