Short-Term Trend Change Intact
 By
Ricky Wen
By
Ricky Wen
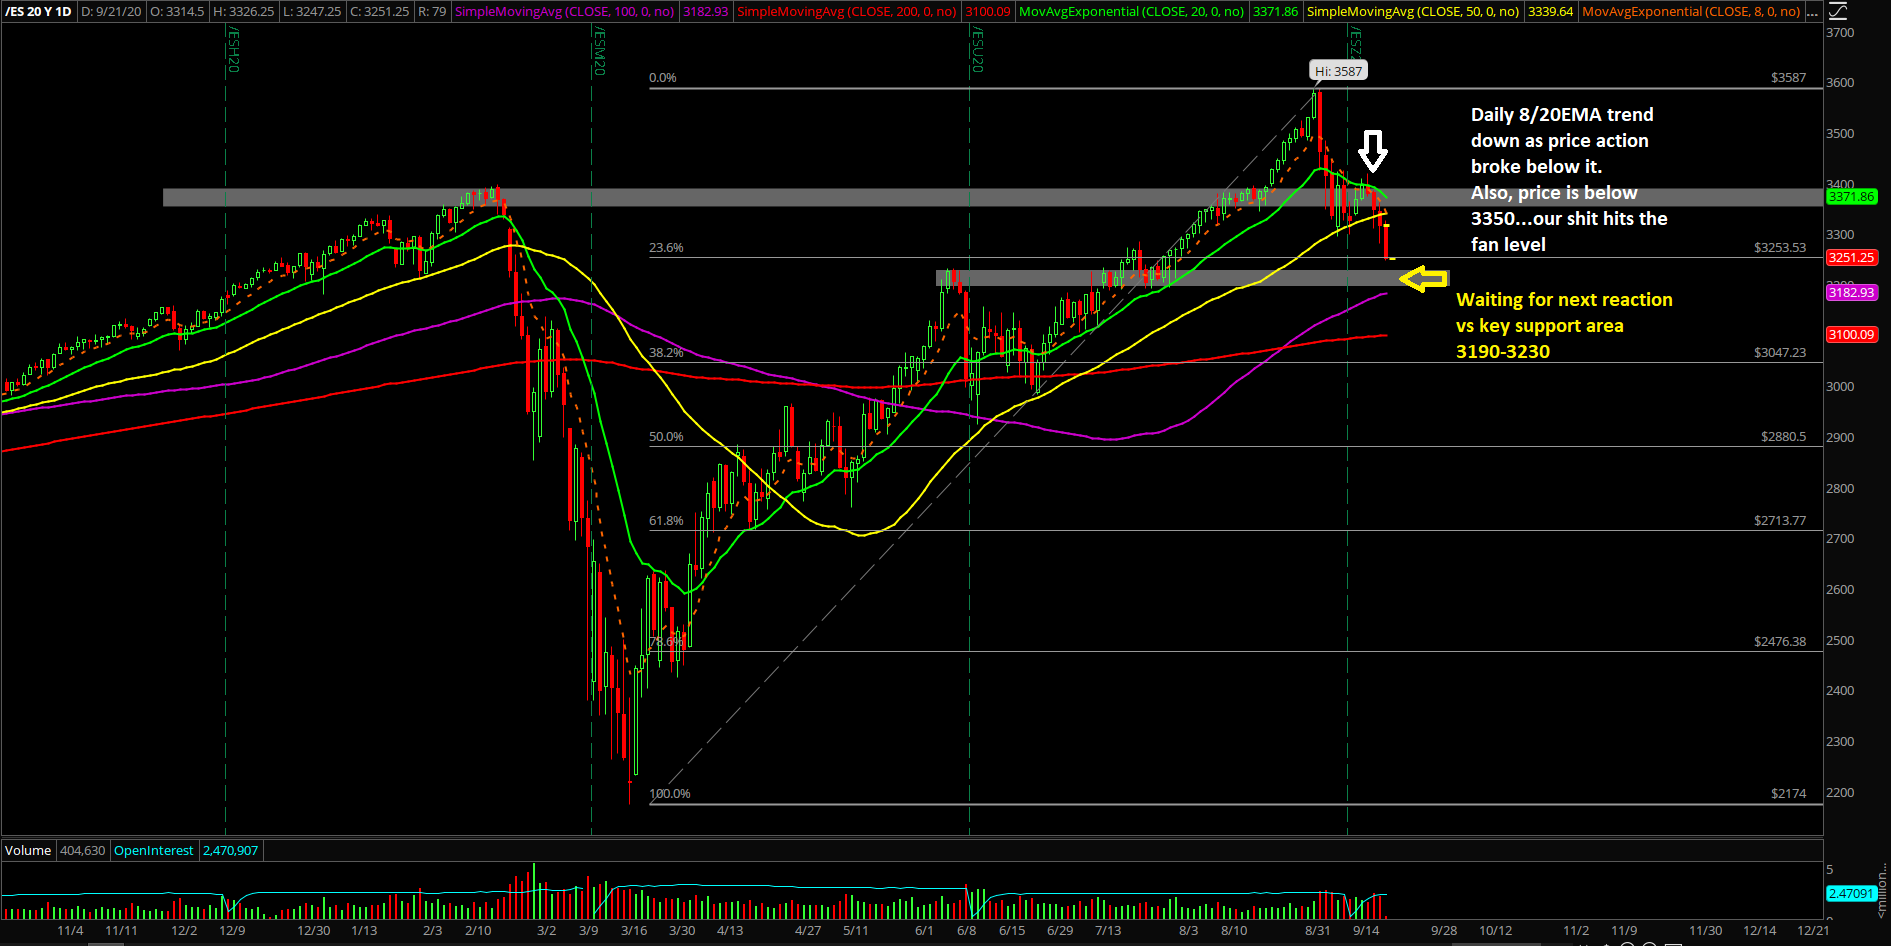
The price action during the past two weeks has seen lower highs and lower lows on the daily charts, as immediate trending supports such as the daily 8/20 EMA were decisively broken and are now acting as resistances. It’s been a quick immediate trend change alongside the other important weekly and monthly timeframes aligning with short-term bearishness.
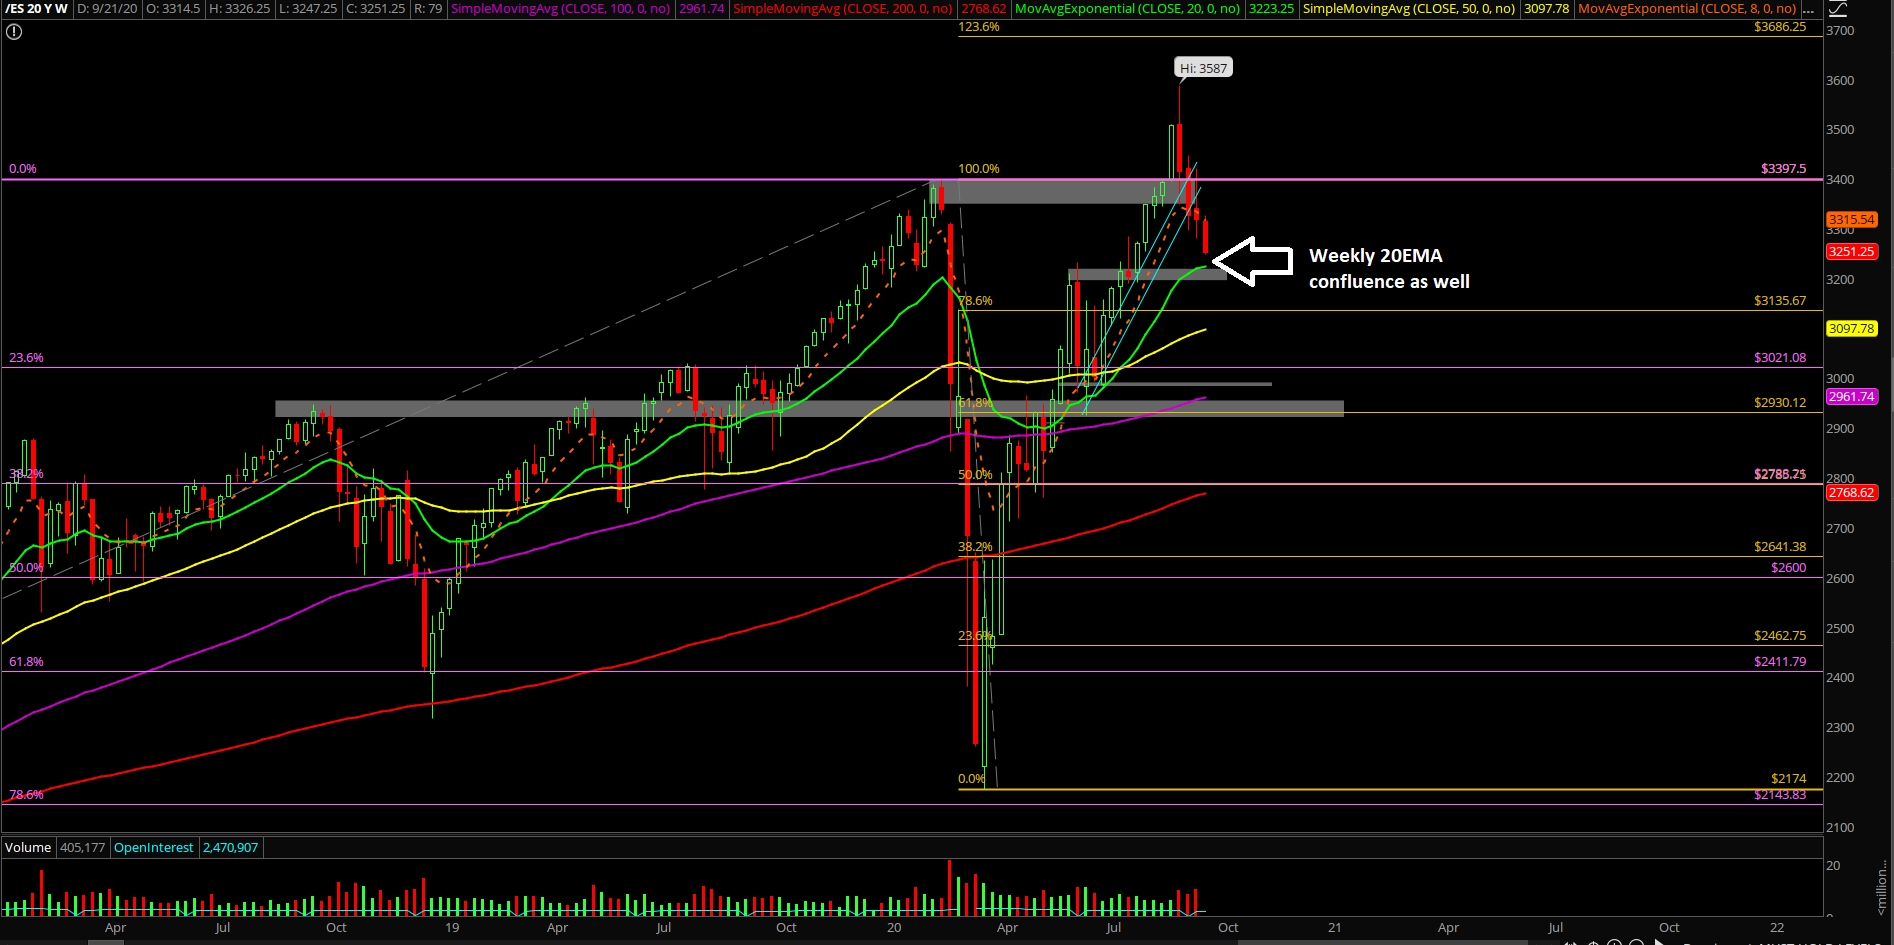
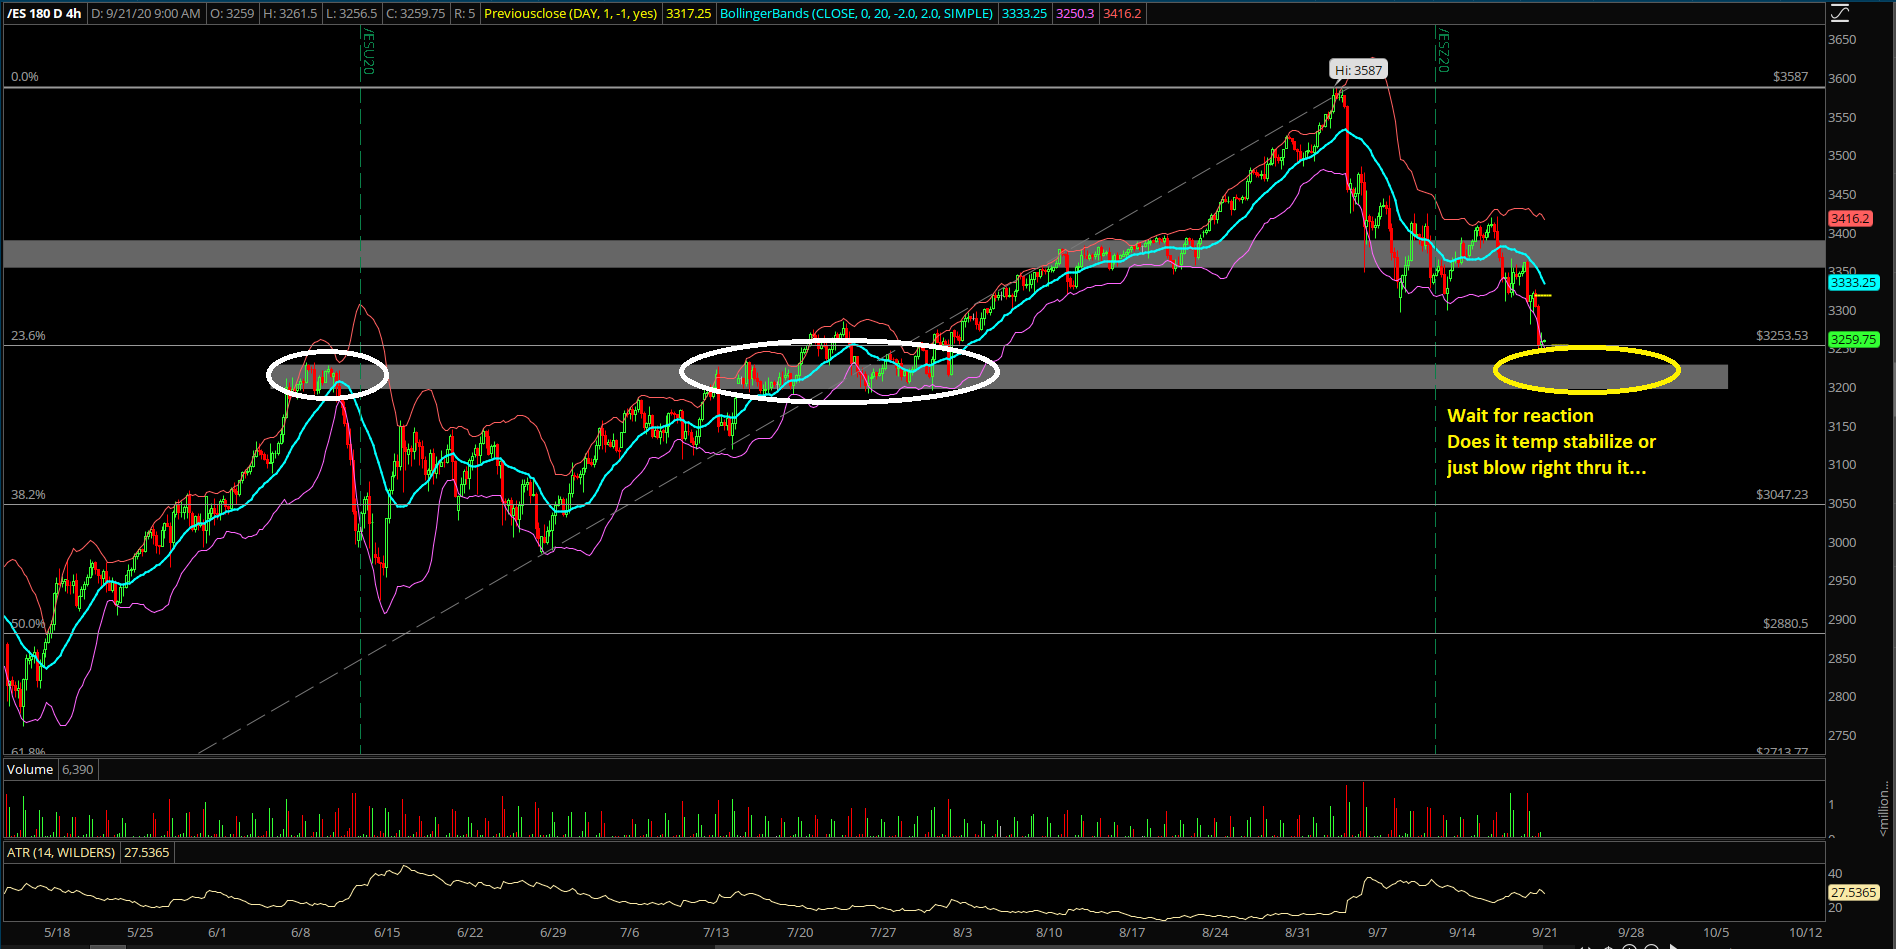
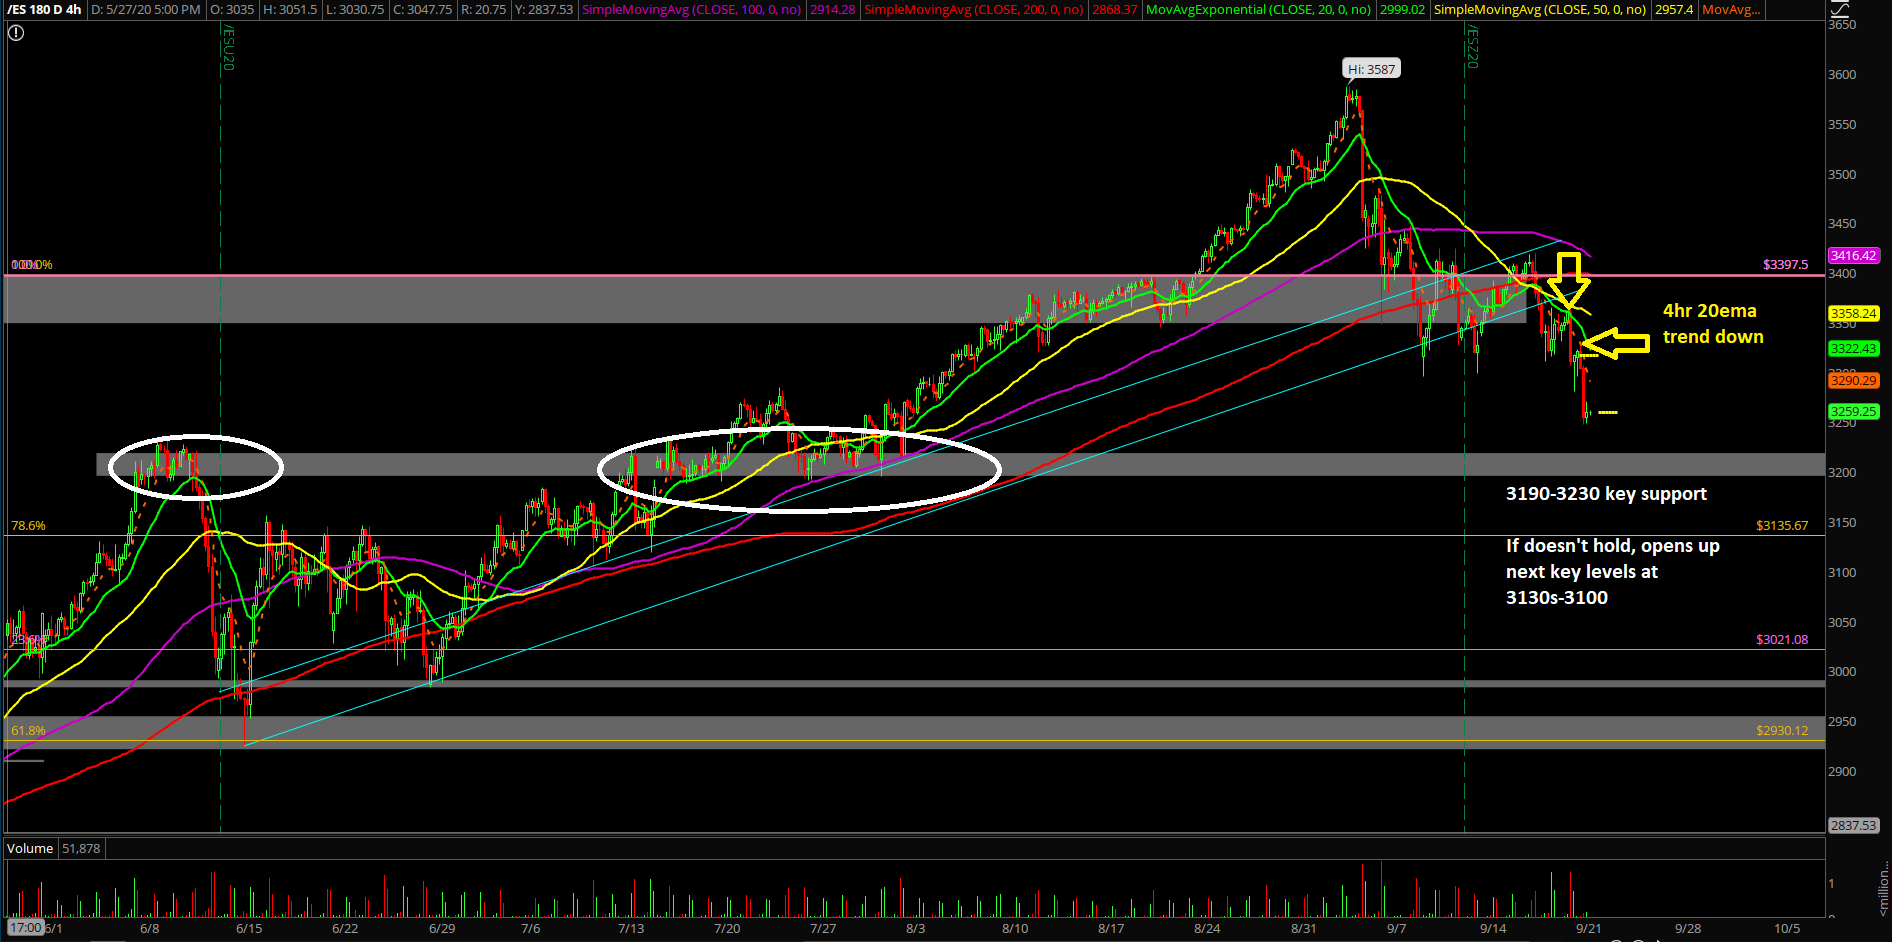
The main takeaway is quite clear: Short-term trend change is intact when price action is able to hold below daily 8/20EMA. Now, we’re waiting to see how price reacts at the 3190-3230 support level on the Emini S&P 500 (ES), which also aligns with the weekly 20EMA and prior breakout zone from June-July 2020.
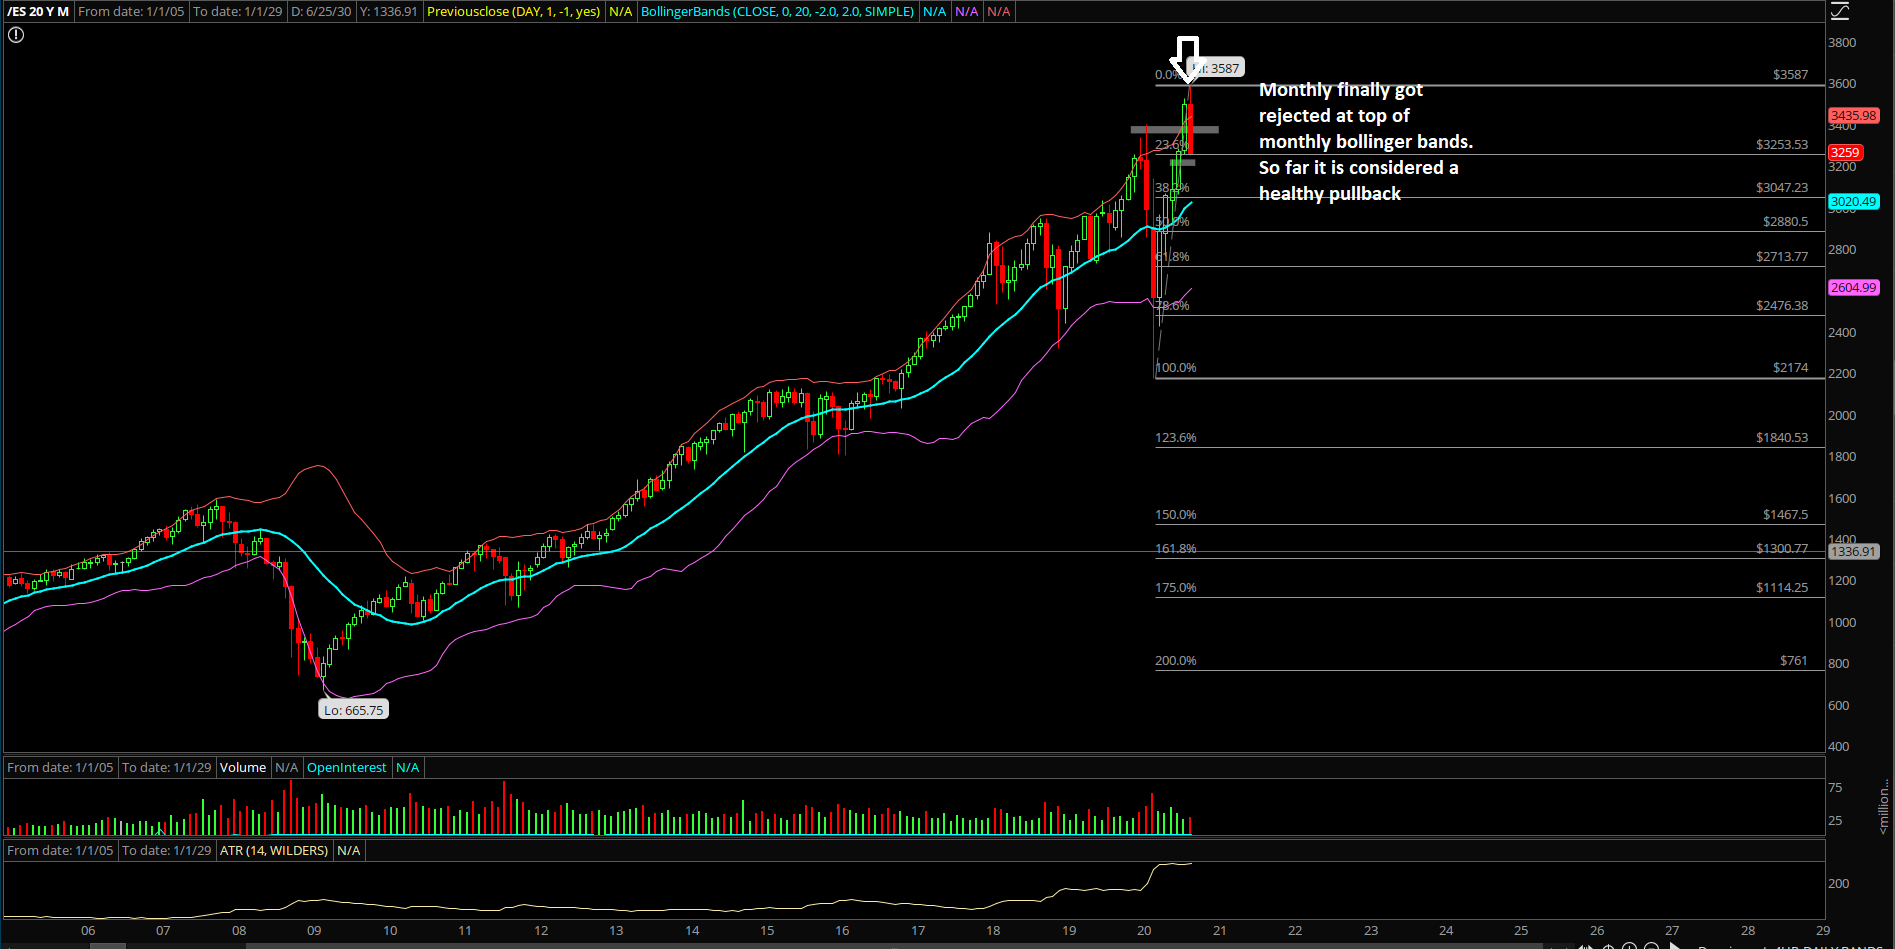
So far this is a very healthy pullback in order to set up for the year-end ramp into highs. This is all presuming the pullback does not get too crazy and exceed the 50-61.8% standard retracements off the 2174 March V-bottom.
Some highlights of our game plan:
- Price action closed Friday below 3350, which was our "sh*t hits the fan level" (SHTF) indicating important timeframes such as daily, weekly, monthly are changing or have changed trend directions and now need price action to stabilize or else lower end supports come into play
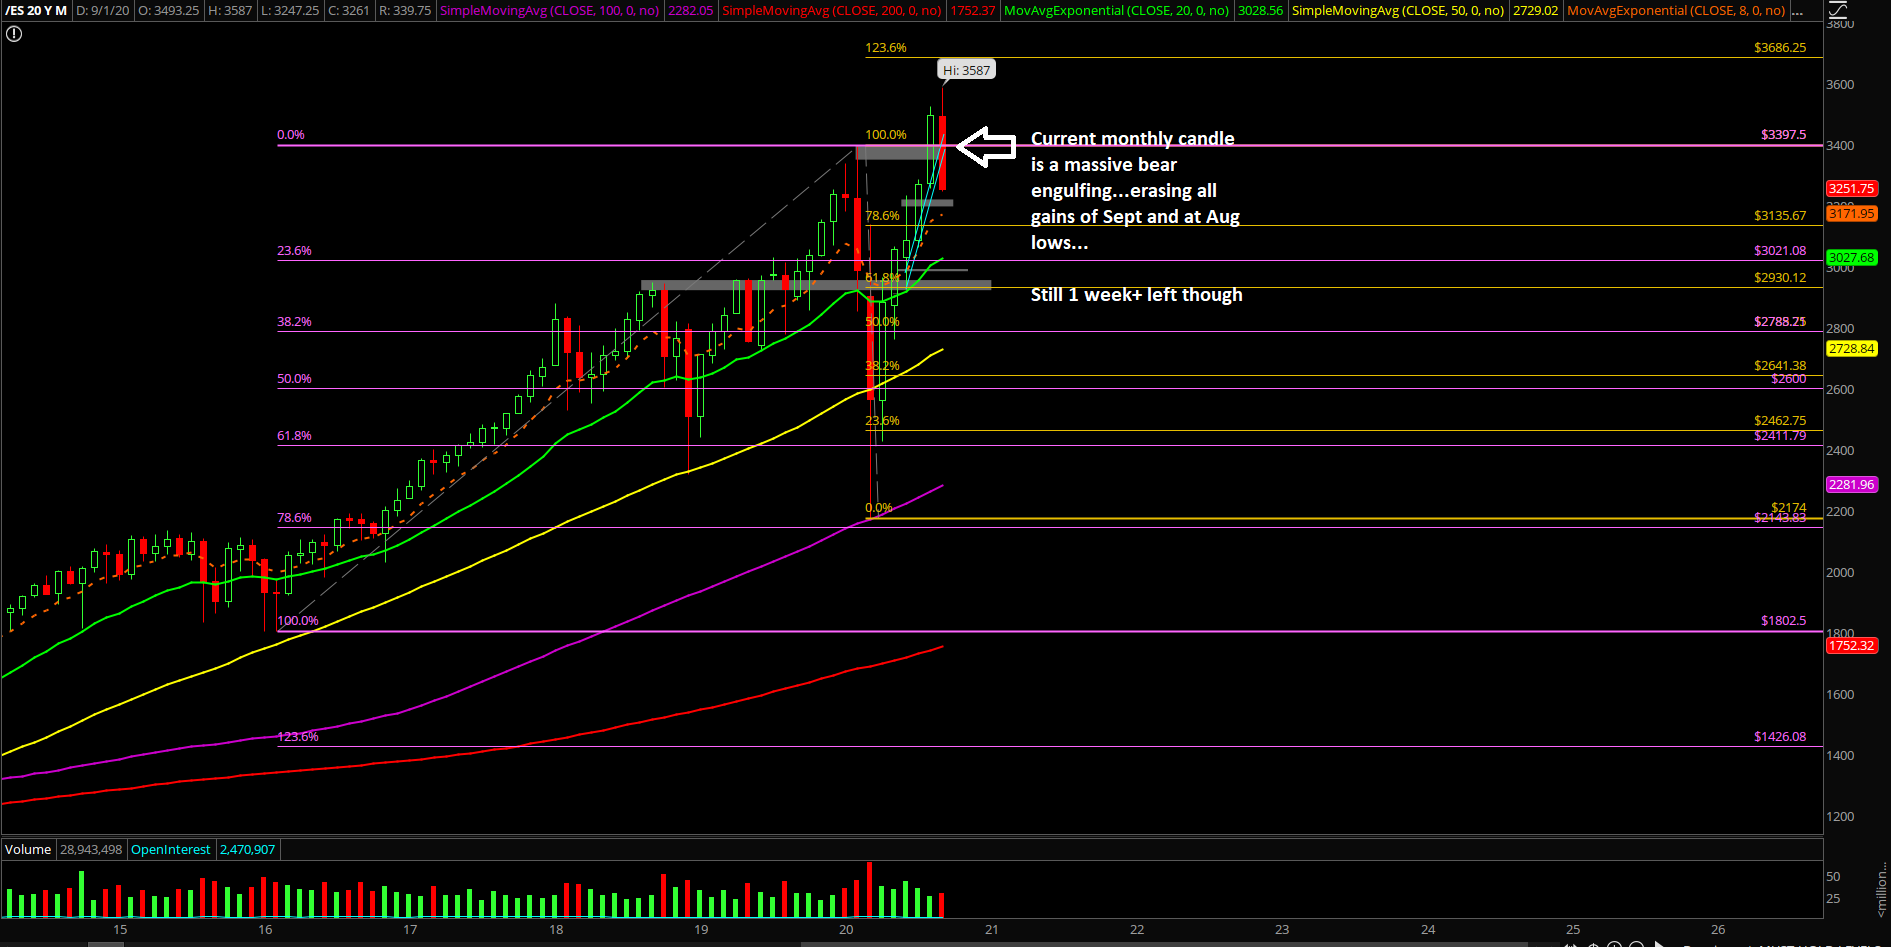
- Currently, price action is hovering around 3250s, which is 100 points below our SHTF and where the August monthly lows are located. This means that price action needs a strong break below/continuation in order to cement the current monthly bear engulfing candlestick.
- *Current monthly bear engulfing candlestick = 3587-3247.25 range thus far erasing all of Sept gains and have erased to August lows
- Immediate bearish bias when below 3350 and 3370s, so look for lower highs and lower lows setup when/if applicable. At this point, the Sunday overnight high of 3326.25 should not be breached by bulls as the immediate bears are attempting this direct follow through downside
- We’re utilizing 3190-3230 as next key support that could temporarily stabilize the price action to see if there’s a dead-cat bounce. If no such reaction occurs, new levels would open up immediately such as 3135/3120/3100 where the latter is the current daily 200SMA
- For reference, 3190-3230 area represents a strong support on the weekly timeframes where the current weekly 20EMA and past breakout zone from June-July are located