Several Charts Broke Today
While it was clearly not my expectation that the i-ii, 1-2 structure we have been tracking for the last year and a half was going to break, many clearly have today. Does that make me bearish? No. It just means that it is likely that we are still working on the larger degree wave ii.
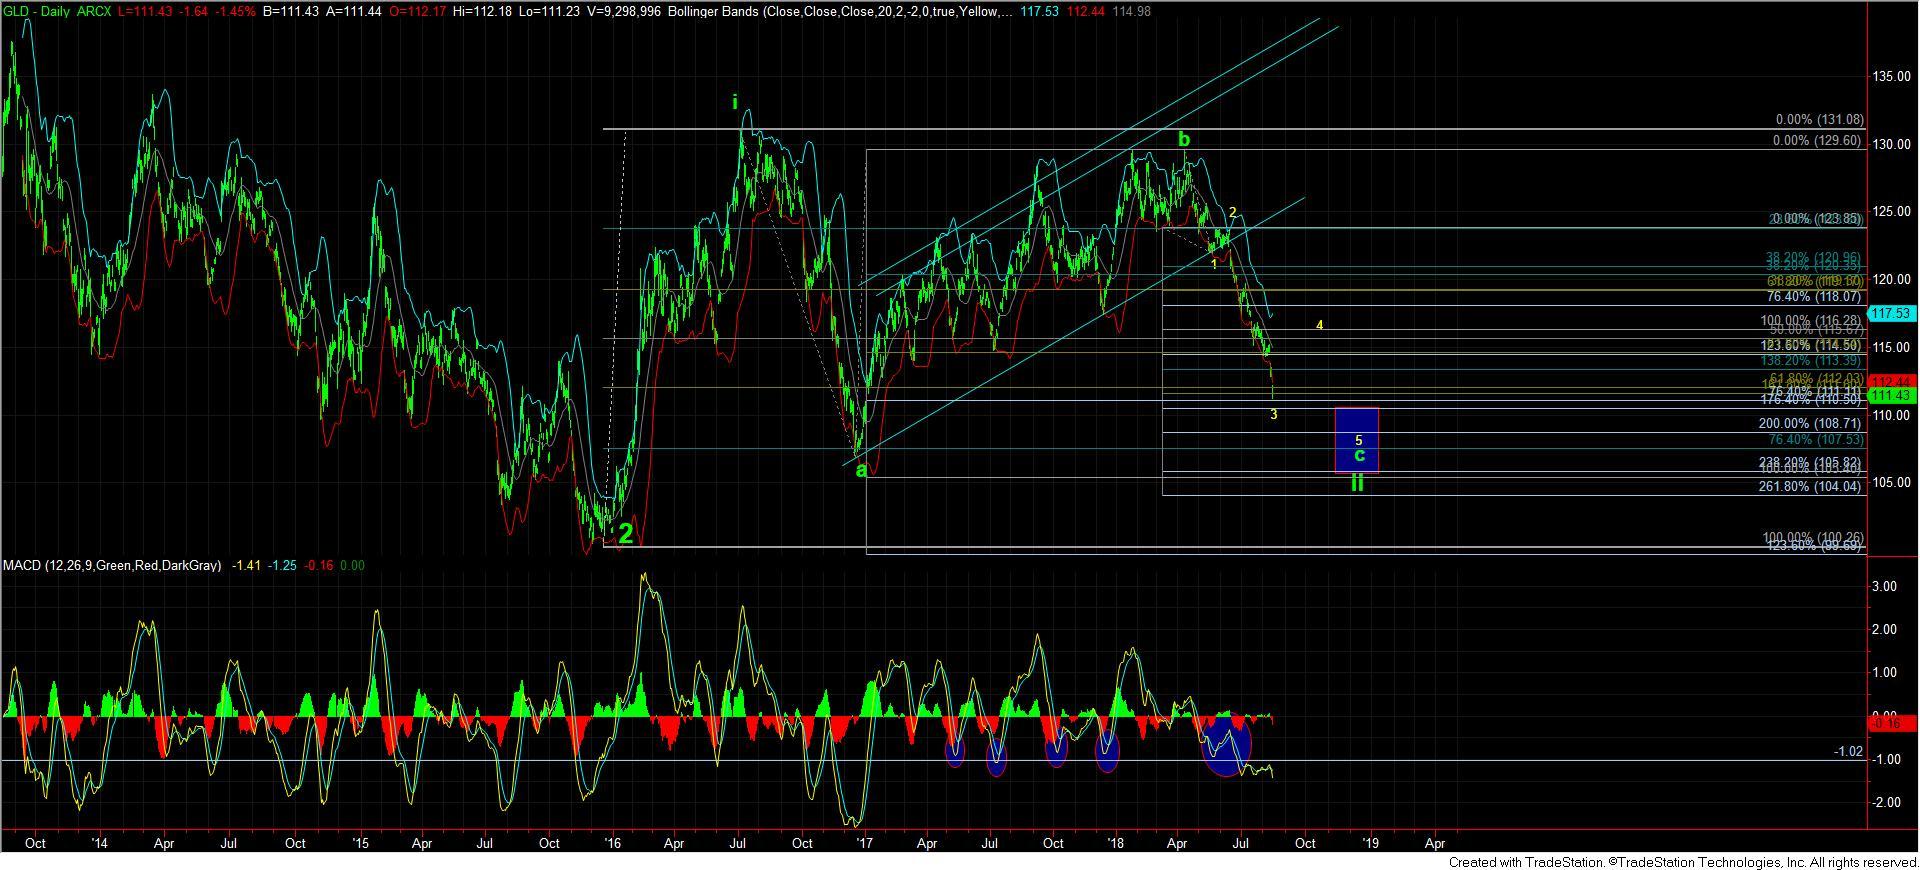
A little over a month ago, when we broke 117.40 in GLD, I stated quite clearly that it will likely take us months until we can resurrect a bullish set up. Moreover, I noted that the break down suggests that we will now test the 113/114 support region, which, if broken, can open the door to 105-110. At this point in time, that is exactly what we are seeing.
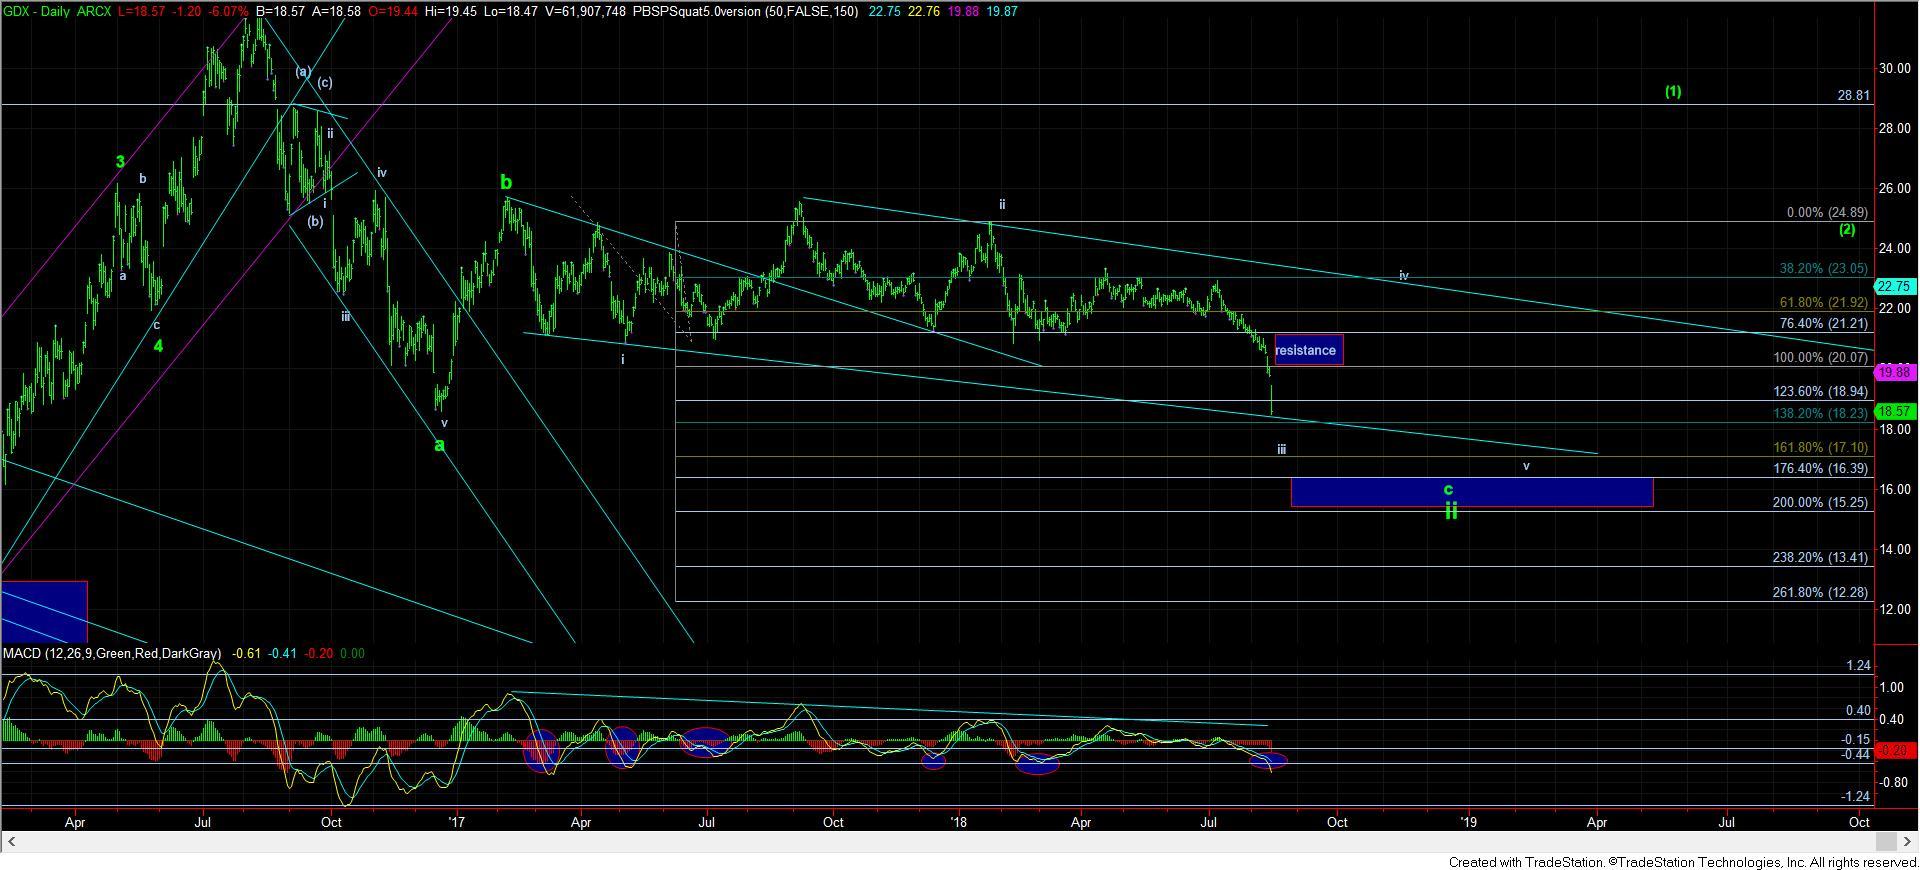
Today was also a major day in the GDX. It too broke its support, and opened the door to a much bigger wave ii to take shape. And, clearly, this was also not my expectation, especially as we came into 2018 with a very strong bullish set up. I am sorry I cannot always be right, and this is one of those times where the market did not meet my primary expectations. The question is what is the GDX telling us now?
Well, again, this depends on which miner you are tracking. As far as the GDX as a whole, it would seem that this break down would suggest we can retest the 15-16 region. Yet, the question of how we get there is not easily answerable based upon the overlapping structure with which we have had to deal over the last year and half. You see, we can always take a direct drop to the 15-16 region. But, if the market takes the indirect path through the 20.50 region, we will be completing this c-wave of wave ii as an ending diagonal. And, to be honest, I may be leaning more towards the diagonal due to the potential for a larger rally to still be seen in the complex. But, if we break the 18.20 region sooner rather than later, then it would suggest we are taking the direct path.
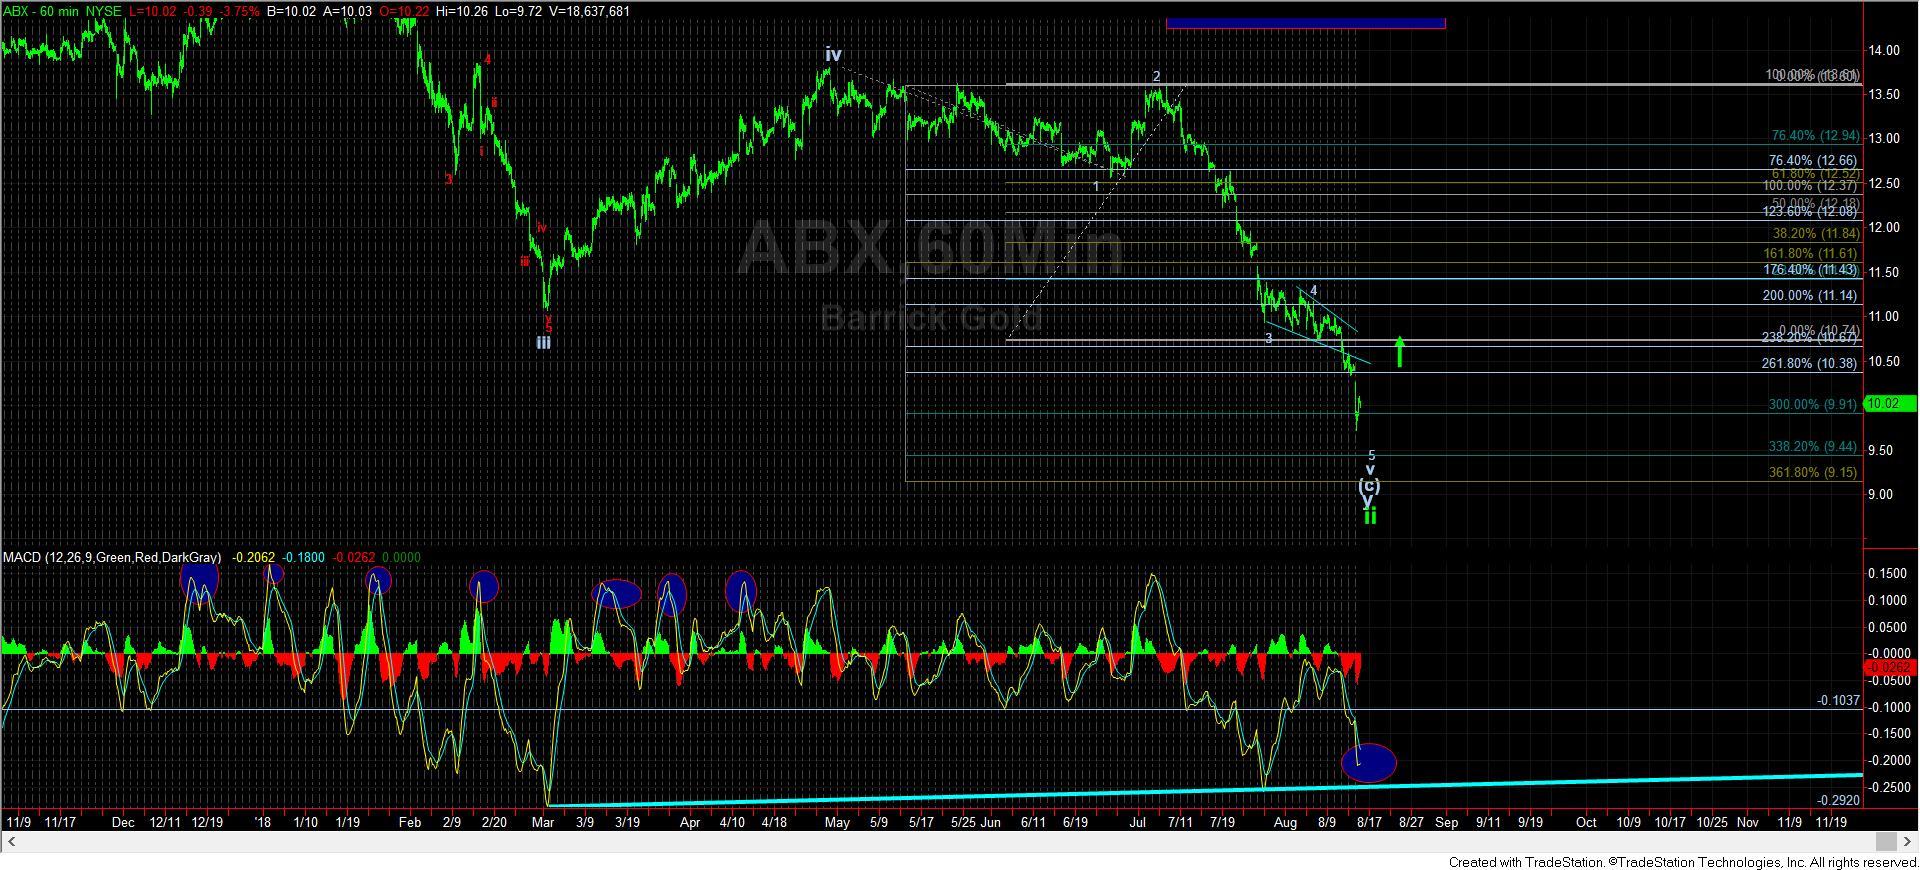
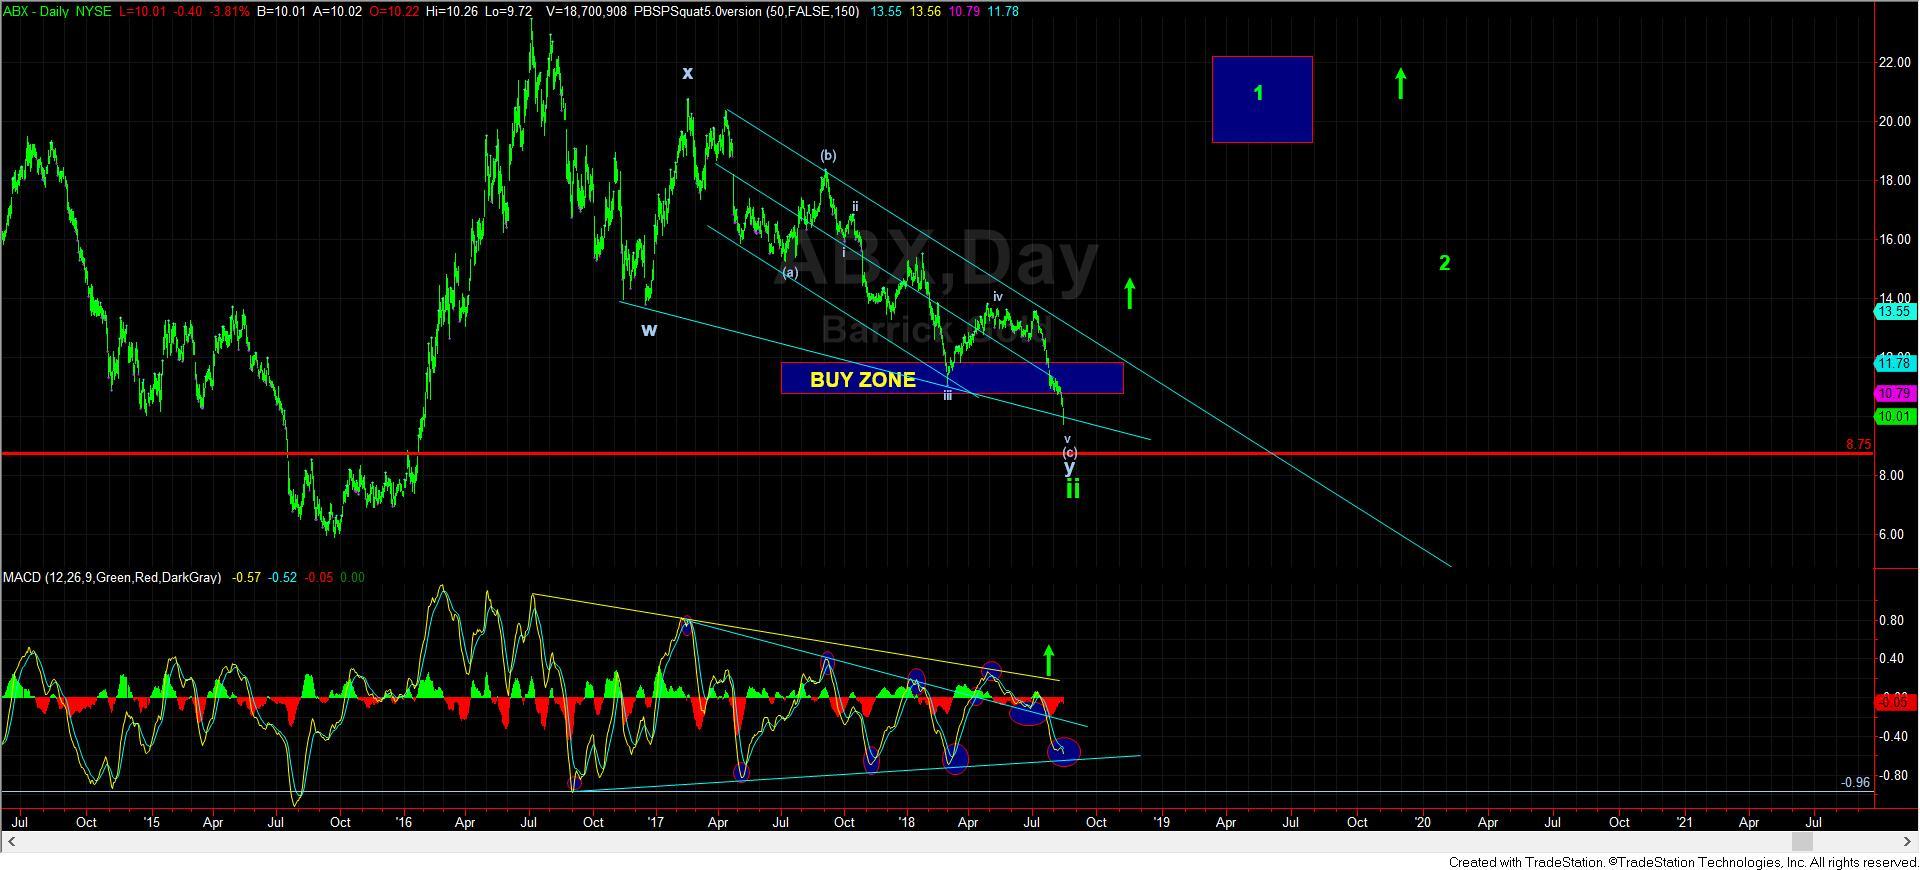
As far as the ABX is concerned, while we have spiked lower today, this is still in line with my expectation for completing a 5th wave down in this final 5th wave. And, as you can see, all divergences have held quite well on all time frames. But, we still need an impulsive rally through the 10.50 region to suggest we have completed wave ii.
With regard to the GLD chart, I think I will have to adopt the prior alternative as my primary count right now, based upon the plans I have laid out over the month or so. The break down below 113 has certainly opened the door for this being the c-wave of wave ii, but that still means we can see a rally back up towards the 116 region for a wave 4, before we drop again to test the 110 region, and even see as deep as the 105 region if we get an overly emotional sell off. However, if the market is able to provide us with an impulsive rally through the 116.50 region in the coming weeks, then I can easily consider wave 2 of iii as complete, and turn bullish in the near term again.
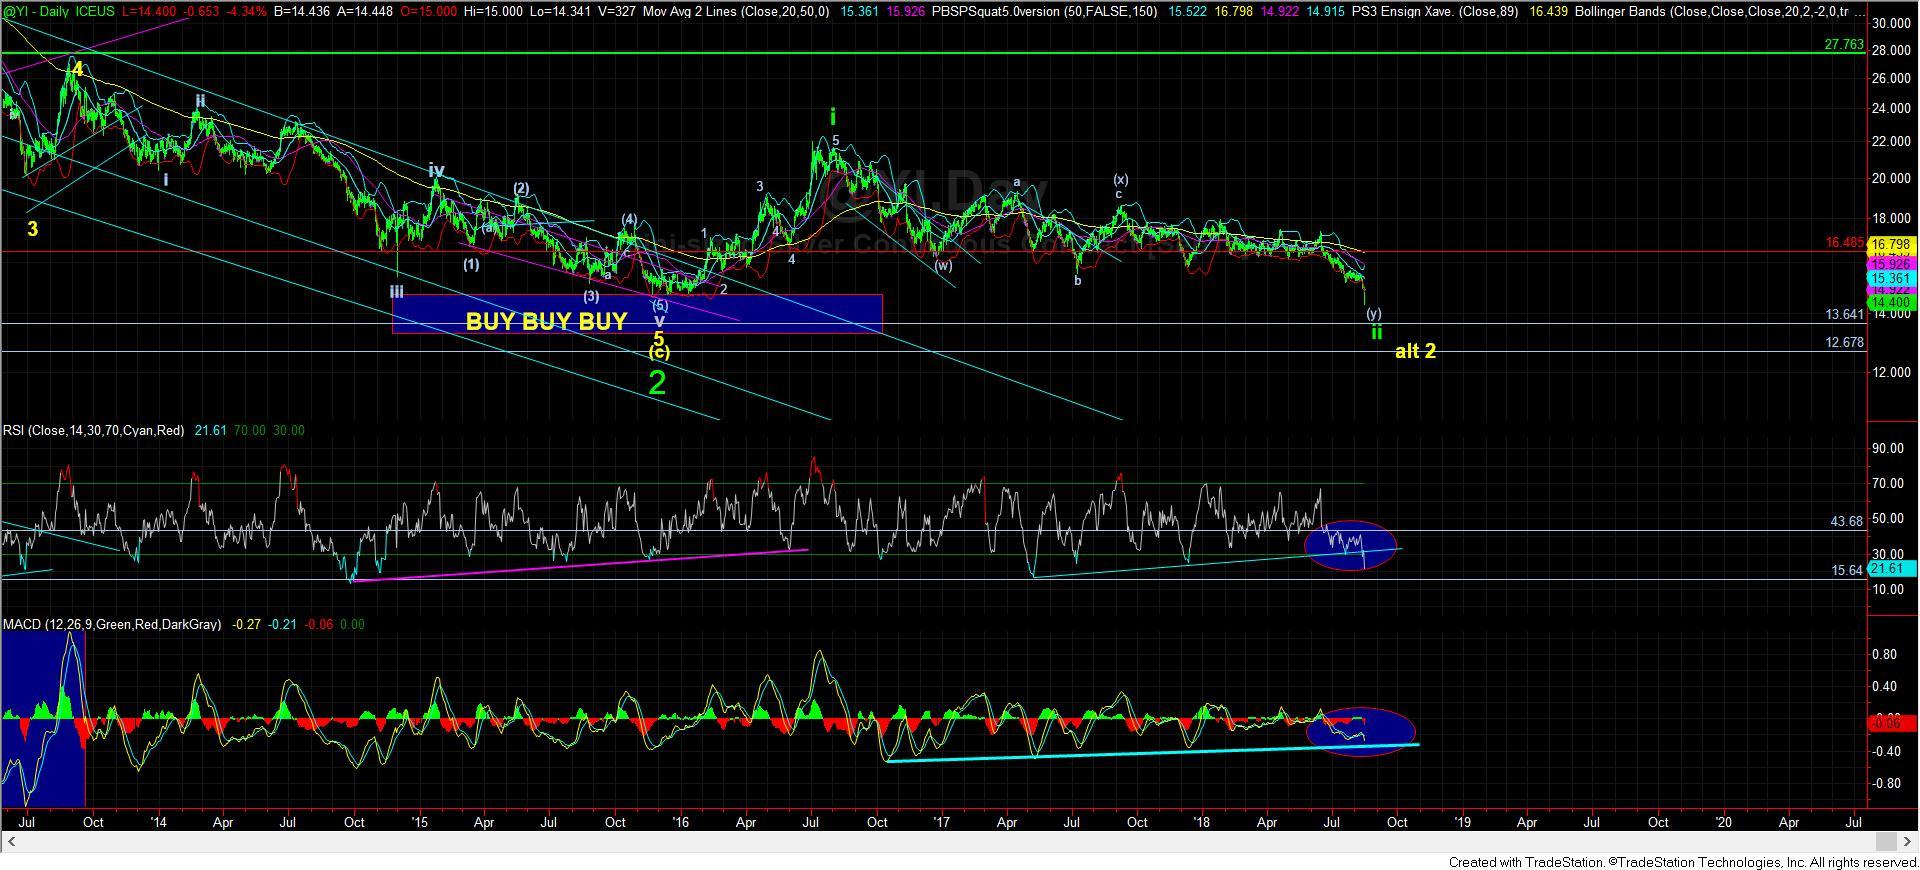
Silver has also broken the most of the divergences I have been tracking, and put that chart in a precarious position. I still think we are working on wave ii like the other charts, but I will need to see the techs shape up better before becoming bullish again. But, this is only a near term issue for me, not a long term one. Alternatively, silver is the only chart that looks like it has potential to make a lower low relative to 2015. But, then again, silver had the most amorphous looking rally off the 2015 lows too.
Overall, today’s action is not what I have been expecting. And, while I wish I could always be right, I am sorry that my expectations were not aligned with the market action today. However, while I noted over a month ago that it will take us months until we see the next bullish set up develop, it may take many more months in the charts which have really broken down, and potentially into year end, before those patterns develop again.
Yet, with as stretched as we are to the downside now, I still think that a rally is going to be seen quite imminently, but that may only be a corrective rally in many charts, while others may be starting on their next bullish move, similar to what we saw at the end of 2015. For example, I still think there is a good chance that ABX leads us out of these lows with an impulsive rally, to signal it has begun its wave iii.