Sentiment Overview: At an Inflection Point
 By
By
Here's a quick review of the monthly sentiment charts to give some perspective on this global crisis moment:
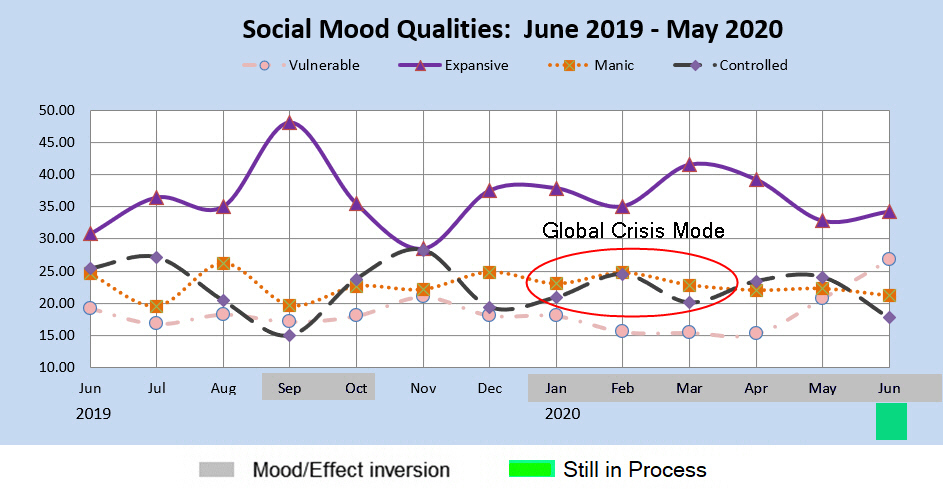
1). This first chart was shared in early January, and an article containing it in late January. It shows an unprecedented period of global crisis. (I've never seen a several months long crisis period show up on the monthly charts before, so it's unprecedented in my experience).
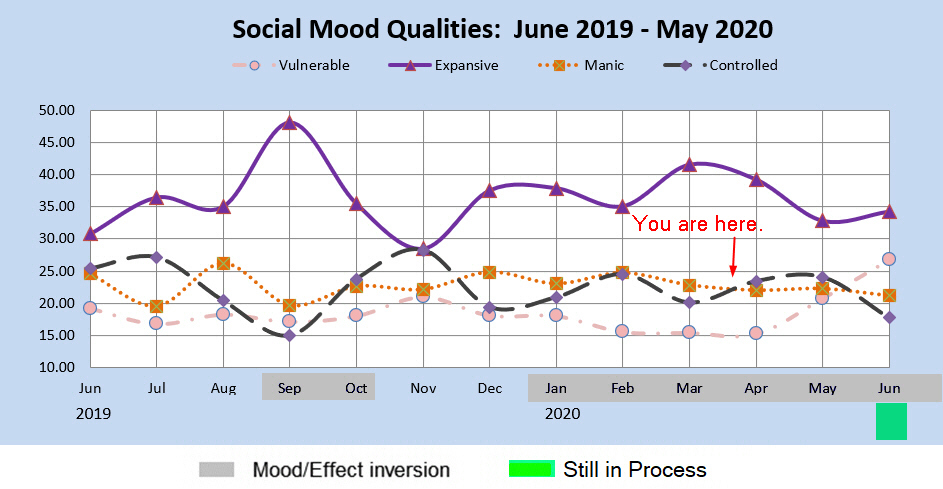
2) This is where we are now. You can see on the chart that there is an inflection point in the two components that define "crisis" or "disaster" (the orange and gray lines close together and/or parallel).
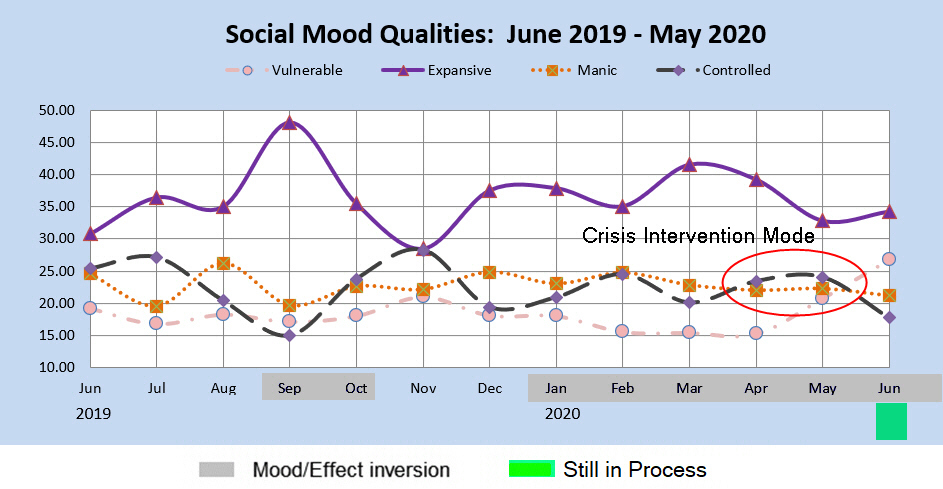
3) We are entering a period of crisis intervention where governments will throw everything they can at this to stabilize things. There is no sign that the virus should necessarily be gone from this, but that there should be a lot of activity to make things better or at least not get worse, and the perception that action is being taken. Usually markets rally during this type of pattern, at least short term. The pattern in May is a three component cluster that usually accompanies a sense of helplessness or victimization, so I'm not sure how this will play out in the markets, but large short covering rallies would not be a surprise in the midst of overall bearish sentiment.
4). The month of June's data is still not complete, but currently the two lines in question are not close enough or parallel enough to be considered "crisis mode."