
Same Ocean — Different Heading
 By
Levi
By
Levi
Carnival and Norwegian sail the same waters. Their charts suggest they are not headed to the same destination.
The cruise industry tells an incomplete story at the surface level.
Ships are full. Bookings have recovered. The visible signs of the pandemic's devastation have largely faded from the operating picture. If you only looked at passenger counts, you might conclude that the sector has returned to form.
The balance sheets reveal a different reality.
Both Carnival and Norwegian survived the crisis by doing what they had to do — selling equity and taking on debt at precisely the moment when those instruments were most expensive. The ships came back. The dilution did not reverse. That structural damage runs deeper than it seems, and it continues to shape the investment case for both companies whether the headlines acknowledge it or not.
Lyn Alden frames the challenge plainly:
"Even as the cruise industry has recovered its annual volumes to pre-Covid levels, their financials still haven't fully recovered due to all of the permanent dilution they had to perform during the crisis. Selling equity or debt at crisis prices is WAY more expensive than building up reserves when times are good, equity valuations are rich, and debt is cheap. But alas, they're doing their best."
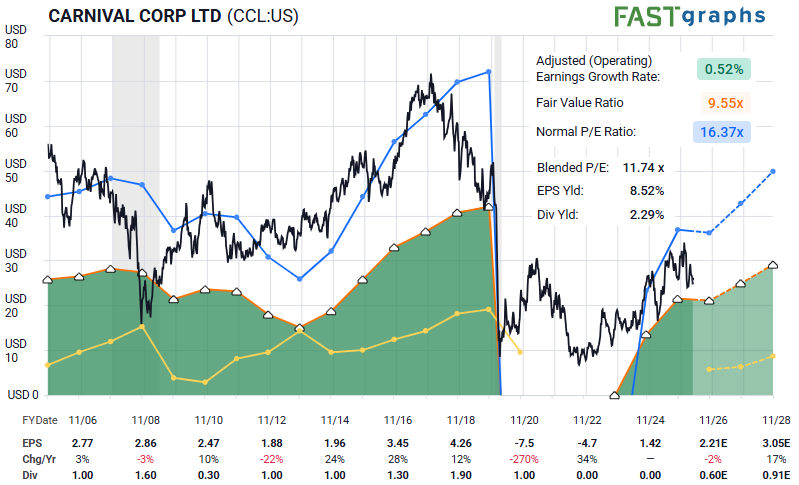
Carnival's FAST Graph reflects that reality. Earnings growth sits near zero at 0.52% annually. The blended P/E of 11.74x appears cheap against a historical normal of 16.37x — but cheap without earnings growth can become a value trap waiting for a catalyst that may or may not arrive.
So why compare Carnival and Norwegian at all?
Because Lyn also offered a clear preference:
"Between Carnival and Norwegian, I'd have to pick Norwegian over the next few years price-wise."
That preference — Norwegian over Carnival — is where the chart work becomes particularly useful. The two companies operate in the same industry, face many of the same macro headwinds, and still carry the residual weight of the pandemic. But their price structures are not projecting the same path.
One carries more ambiguity and appears farther along in its rally.
The other is developing with more clarity and a more favorable risk/reward profile.
Same ocean. Different heading.
Let's look at both.
Sentiment Speaks
This is where crowd behavior helps fill in what may come next. The charts do not erase the fundamental risks. They simply show how investors are collectively processing them.
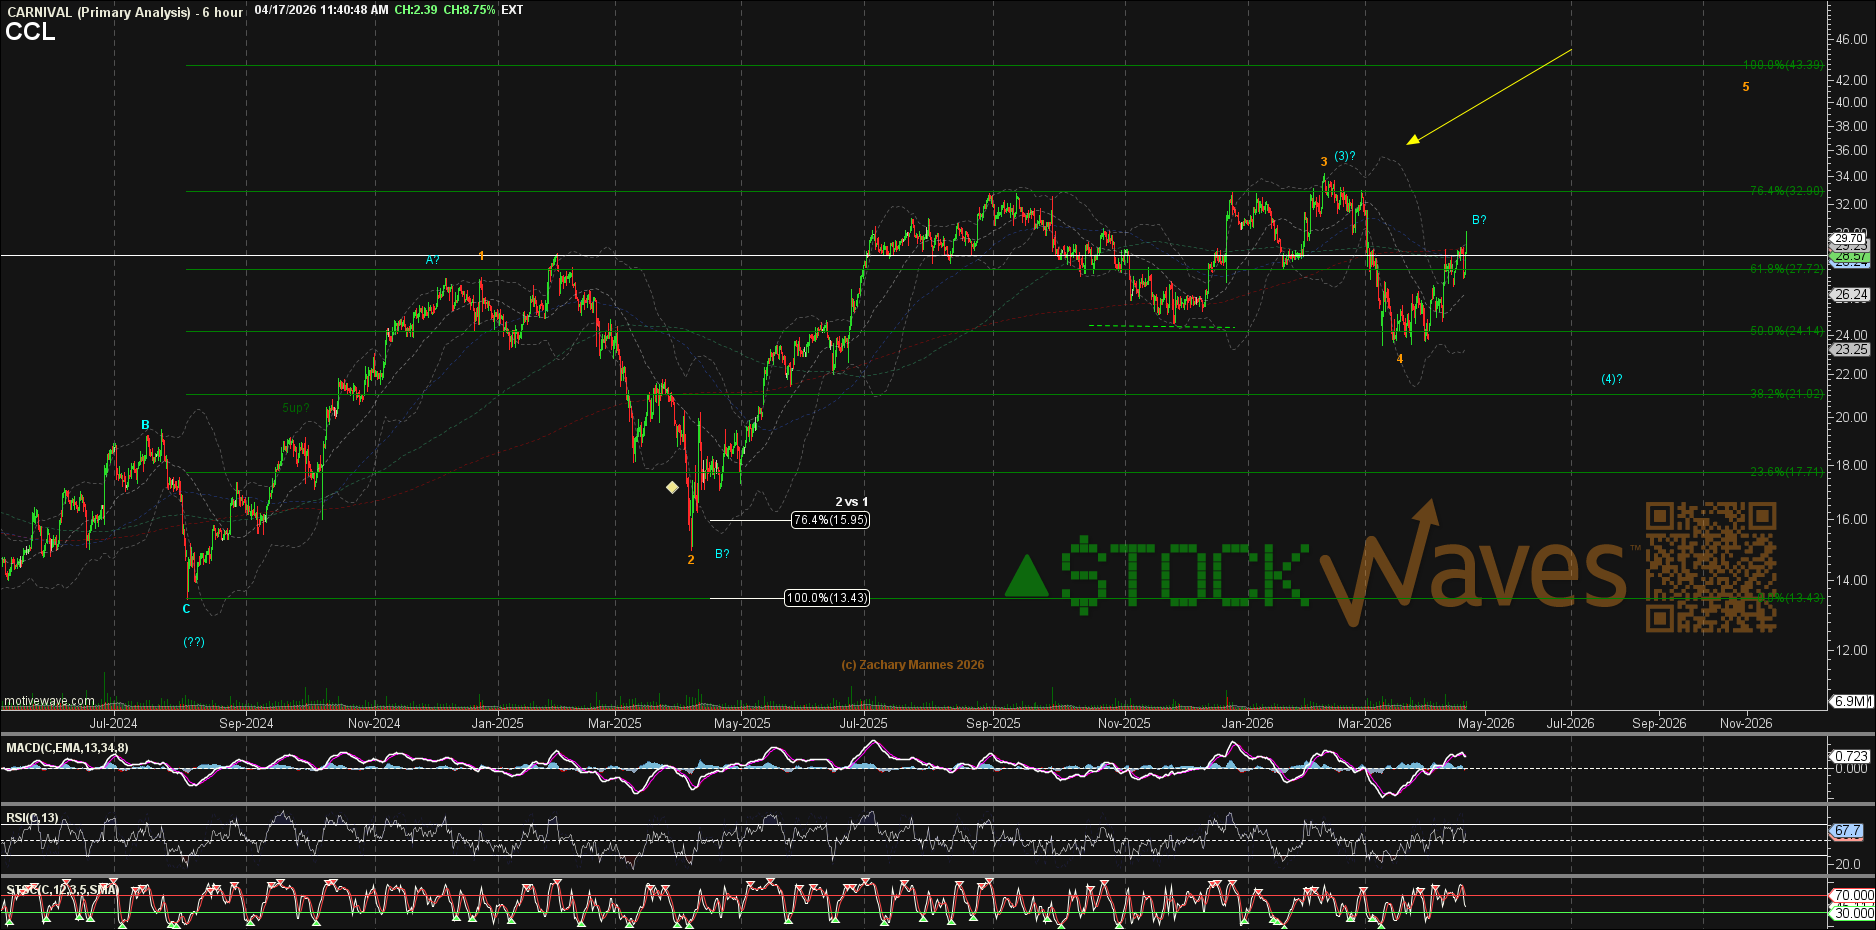
For Carnival, the $34-35 area appears to be key resistance. Should that area break, the next extension zone overhead sits at $36-39. If seen, the advance from the October 2022 lows would look quite mature.
However, there is another scenario we must respect.
It is possible that the $34–$35 target zone was already effectively struck with the move to $34.03 in February. If that interpretation is correct, then a break under the $23.50 area would further confirm the view that a deeper correction is already underway.
So, while Carnival may still have some upside potential, the rally appears mature enough that additional gains may come with increasingly poor risk/reward. The structure is not broken, but it is no longer early.
Norwegian did not make a lower low relative to Carnival back in October 2022. That alone does not make it bullish, but it does suggest that the crowd has been treating the two stocks differently for some time.
More importantly, NCLH now appears to be forming a base from which a larger rally may launch.
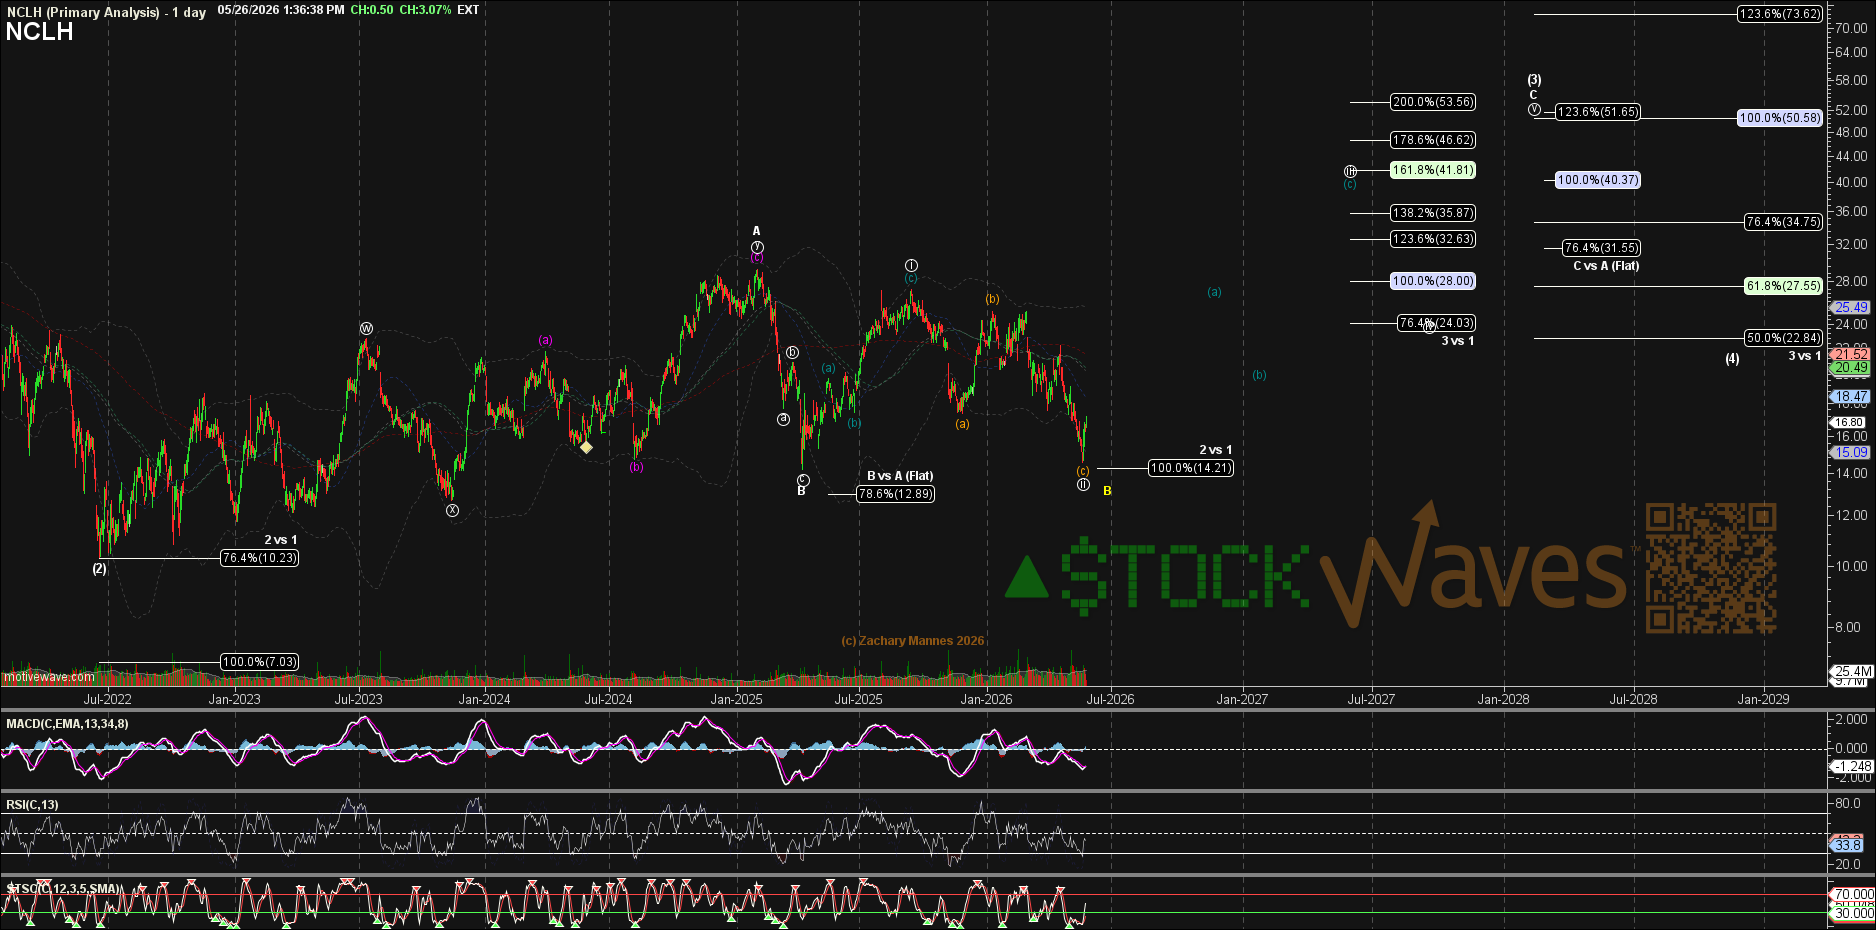
This recent swing low is either a very deep circle ‘ii’ or a greater degree B wave, as shown on Zac’s chart. Given that this entire structure presents as a diagonal, we would anticipate the next move up to develop as the (a) wave of circle ‘iii’. The typical target for that rally would be $35-40.
Will the entire move fill in exactly as drawn?
We do not know that yet.
But we can define the risk more clearly. For as long as price remains above the recent low near the $14.50 area, the upside target remains valid. That gives Norwegian something Carnival does not currently offer as cleanly: a defined setup, a clear risk level, and a target zone that still leaves room for meaningful upside.
Conclusion
Both companies sail the same ocean. Both carry the residual weight of pandemic-era dilution. Both face an industry that demands operational precision just to stay afloat financially.
But the charts are not telling the same story.
Carnival's structure suggests a rally that may have already delivered the bulk of its advance — with key resistance overhead and a maturing wave count that leaves limited room before the next corrective phase begins.
Norwegian’s structure suggests something earlier: a base forming, a potential launch point with defined risk at $14.50, and upside targets that reach toward $35–$40 as the next wave develops.
Lyn prefers Norwegian over the next few years on price. The structure agrees — the crowd's positioning in Norwegian reflects an earlier stage of the sentiment cycle than what Carnival currently displays.
Same ocean. Different heading. And right now, Norwegian appears to have the more favorable wind.
