SPY Probabilities Pointing to ATHs
 By
Luke Miller
By
Luke Miller
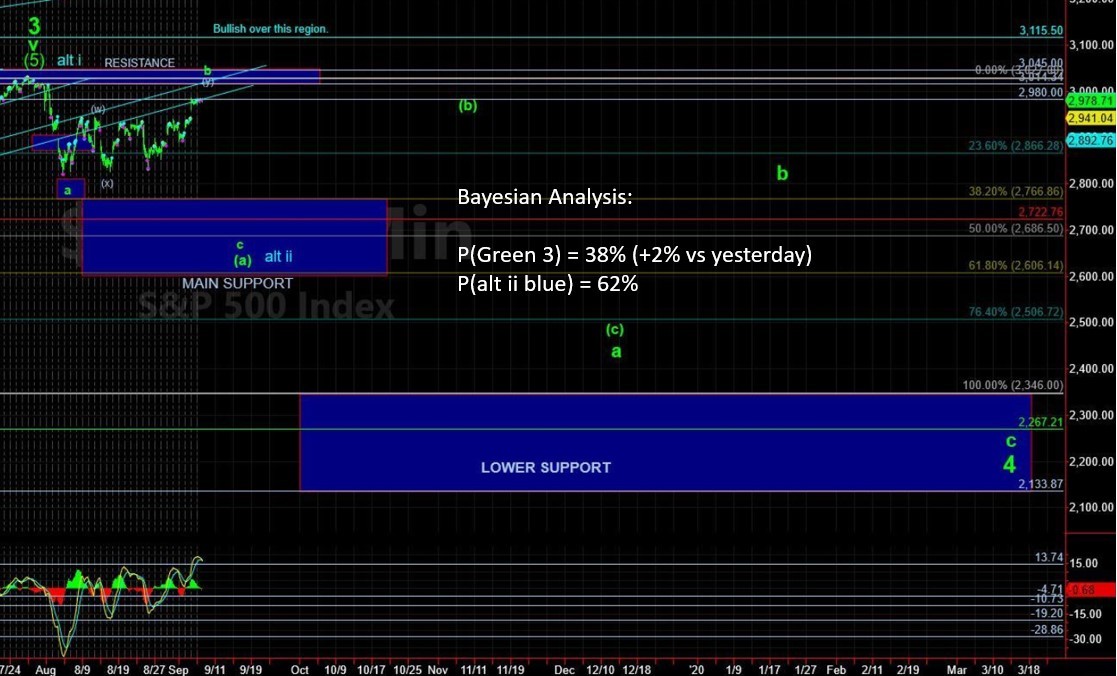
The important 292-296 resistance band in the SPDR S&P 500 ETF (SPY) was overwhelmed last week and thus opens up the probability of the SPY moving to all-time highs.
Here are the probability paths:
(1) [P=69%] SPY bounces off the 282-286ish zone (of which was hit on 8/23, 8/27, and 8/28) and begins a move higher to ATHs. One more pullback to 288-292 can’t be ruled out before the run higher continues, versus
(2) [P=31%] SPY works its way back to the 298-302 resistance and then has a strong bearish reversal targeting at least the 270s.
As noted to members last Thursday, using more conventional tools there are four rules of thumb that have a greater than 60% chance of being leading indicators for the market to eventually break higher out of this multi-week range:
(1) My Bayesian-based institutional accumulation/distribution statistics and a similar metric like Lowry’s data (whose data points since 8/15 have favored the bulls).
(2) The NYSE A-D line has made new ATHs for several sessions in a row.
(3) I have studied stock charts for nearly 20 years now and one of the most bullish set ups I have come across is charted for the QQQs below. I simply call it the “3 hump and go” pattern (even though someone somewhere else may have more formally defined this pattern) and the QQQs are exhibiting a textbook version of it now – if this pattern were to complete in a textbook fashion then you would see one more modest pullback in the coming days and then extending much more than a few days would negate this pattern, but I’ve learned to never trade against its potential.
(4) Just an anecdotal observation rule of thumb, two similar price patterns at similar points in time rarely complete in the same way. Many are pointing to the similar pattern between 10/15/2018-12/4/2018 vs the last several weeks as a fractal that will repeat (both about 12 months apart with similar multi-week congestion). My trader’s gut, as this would be too subjective to quantify, is that whatever price pattern we see in the near future will look different than this 2018 pattern, as the 2018 pattern was very bearish between 12/4/2018 and 12/24/2018, and I just don’t think we will see the same thing. So that leaves something more bullish, more neutral (i.e. more chop), or even more bearish than that December 2018 (of which I presently don’t view as very likely).
A quick comment on item #3, which if it develops would create a great long setup (and possibly even a nice little short trade first). For the QQQs “3 hump and go” patternto fully apply, the QQQs need to complete the downside of the third hump. Targets for textbook pattern would be 186-188 into a vibration window next week. With where QQQs trade now, the hump pattern never fully developed and as such we could see a more corrective multi-week bullish path higher with more bearish multi-month implications. Just going to have to monitor this one on the fly.
Note that if the 3 hump pattern is to develop, then the low 290s should be seen in SPY this week. If SPY bases above that, then there are still bullish outcomes (just not as bullish as if the three hump pattern completes).