S&P 500 Testing Key Support Region
 By
Ricky Wen
By
Ricky Wen
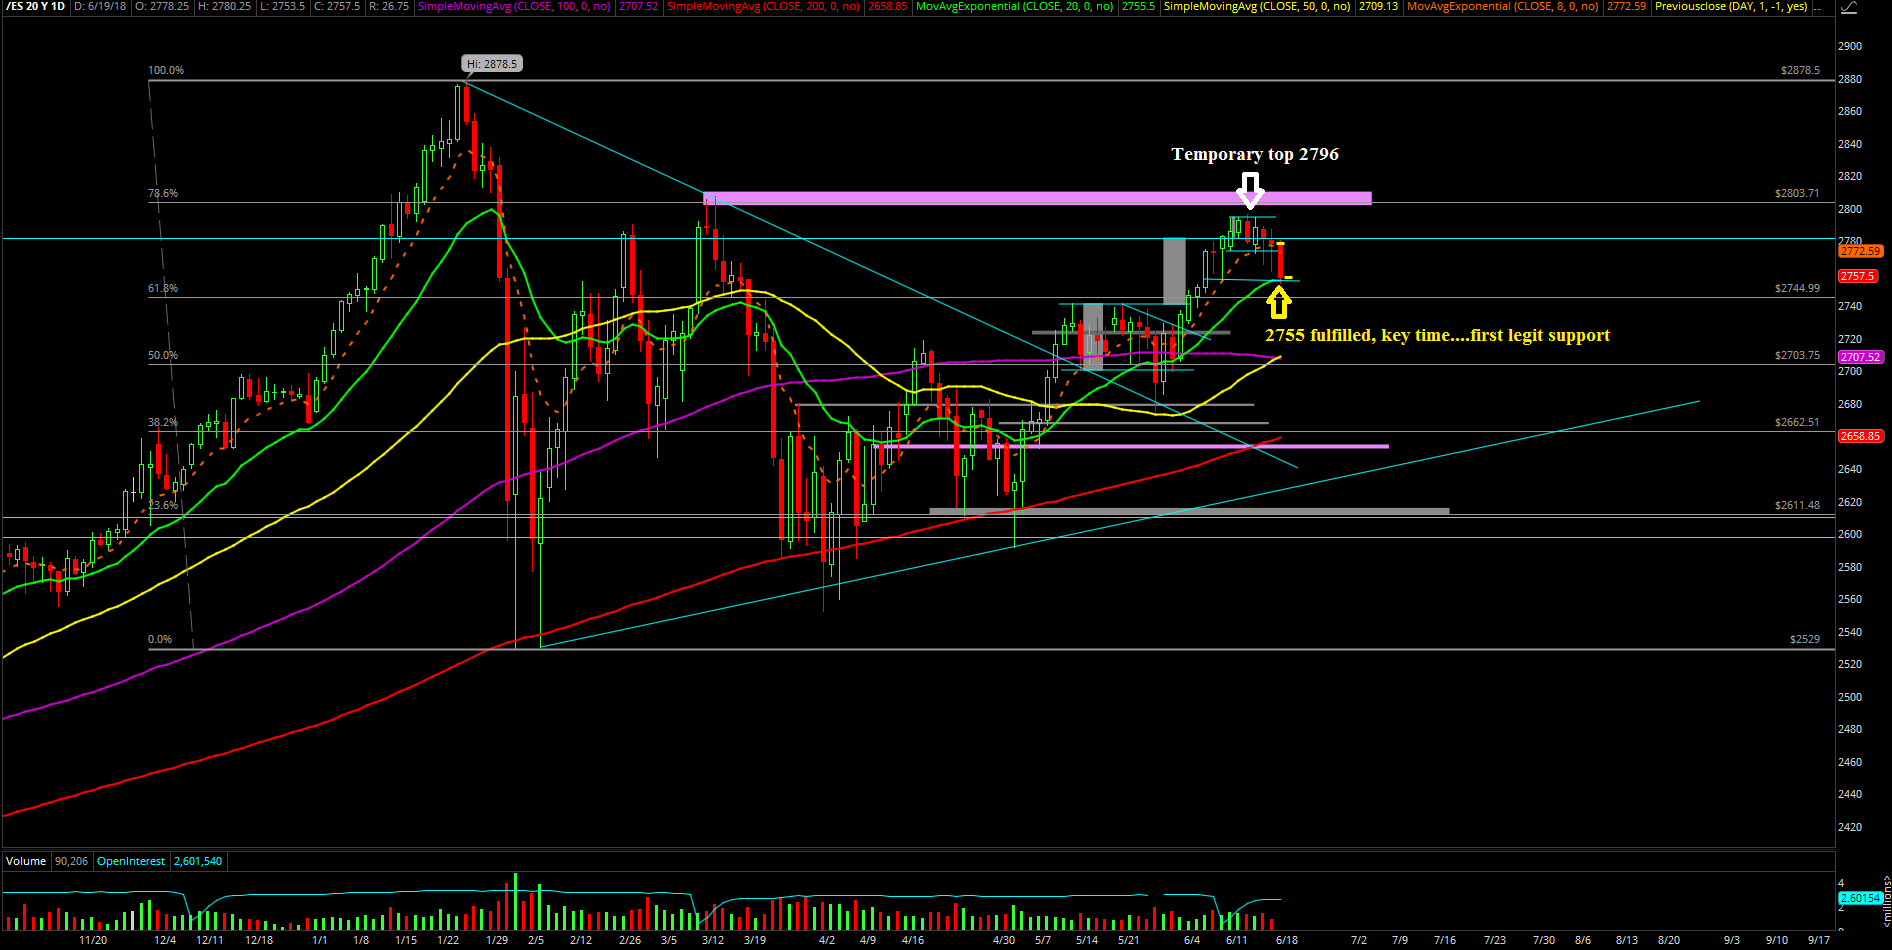
Monday’s session was quite the day as it started off with the bears holding strong onto last week’s temporary top of 2796. Overnight Sunday the Emini S&P 500 (ES) was rejected at lower highs at around 2786. This overnight move propelled the market to accelerate towards the downside as it made lower lows towards Friday's support by around 7 am Monday before setting a temporary low at 2761.25 around the market open. In our Trading Room, we took the morning opportunity to take some profits on some short positions/cheap insurance from last week’s highs that hedged our overall portfolio.
In essence, this meant that the bears got close but couldn't really finish the job immediately as the opposing bulls managed to bounce back into a morning high of 2778 by around 11 am. Then, price consolidated in a tight range for the rest of the day. However, those opposing intraday bulls still did not manage to fill the down-gap from Friday's closing level of 2781.
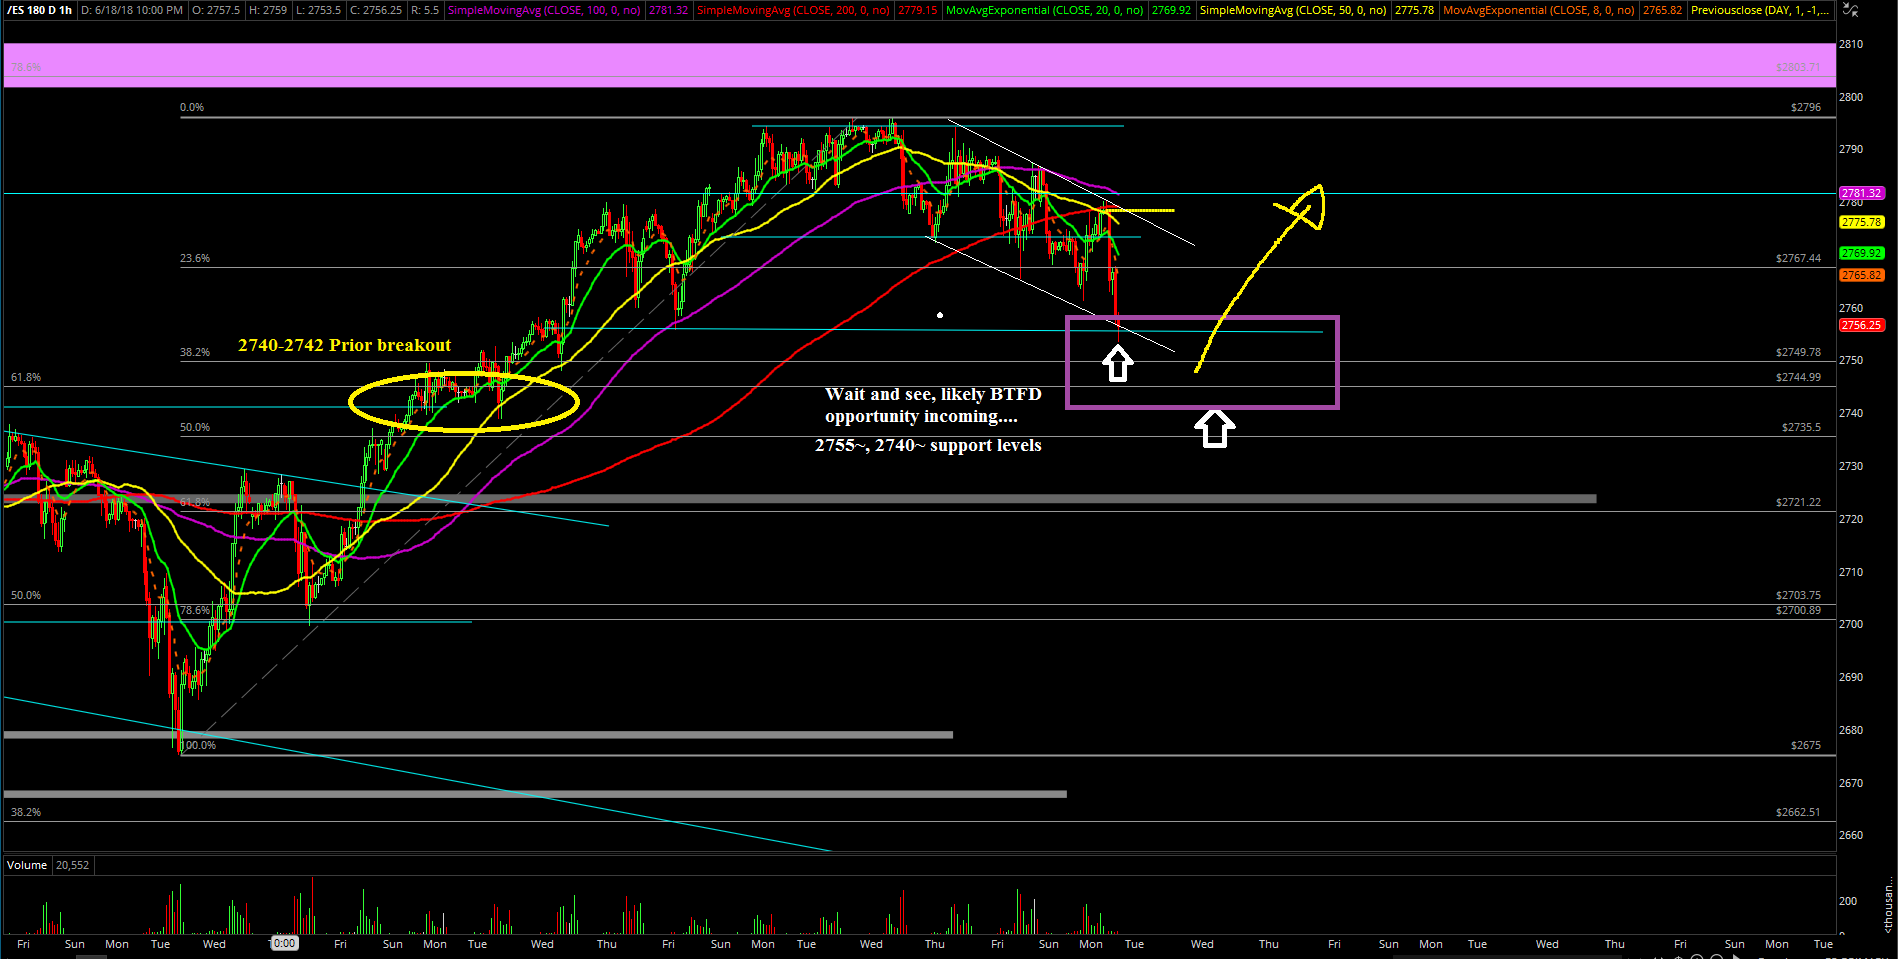
As of writing the ES was rejected at lower highs once again during the overnight hours and has now fulfilled the 2755 back-test of support that is coincidentally also the daily 20 exponential moving average support region. (2755 represents the Friday June 8th low.)
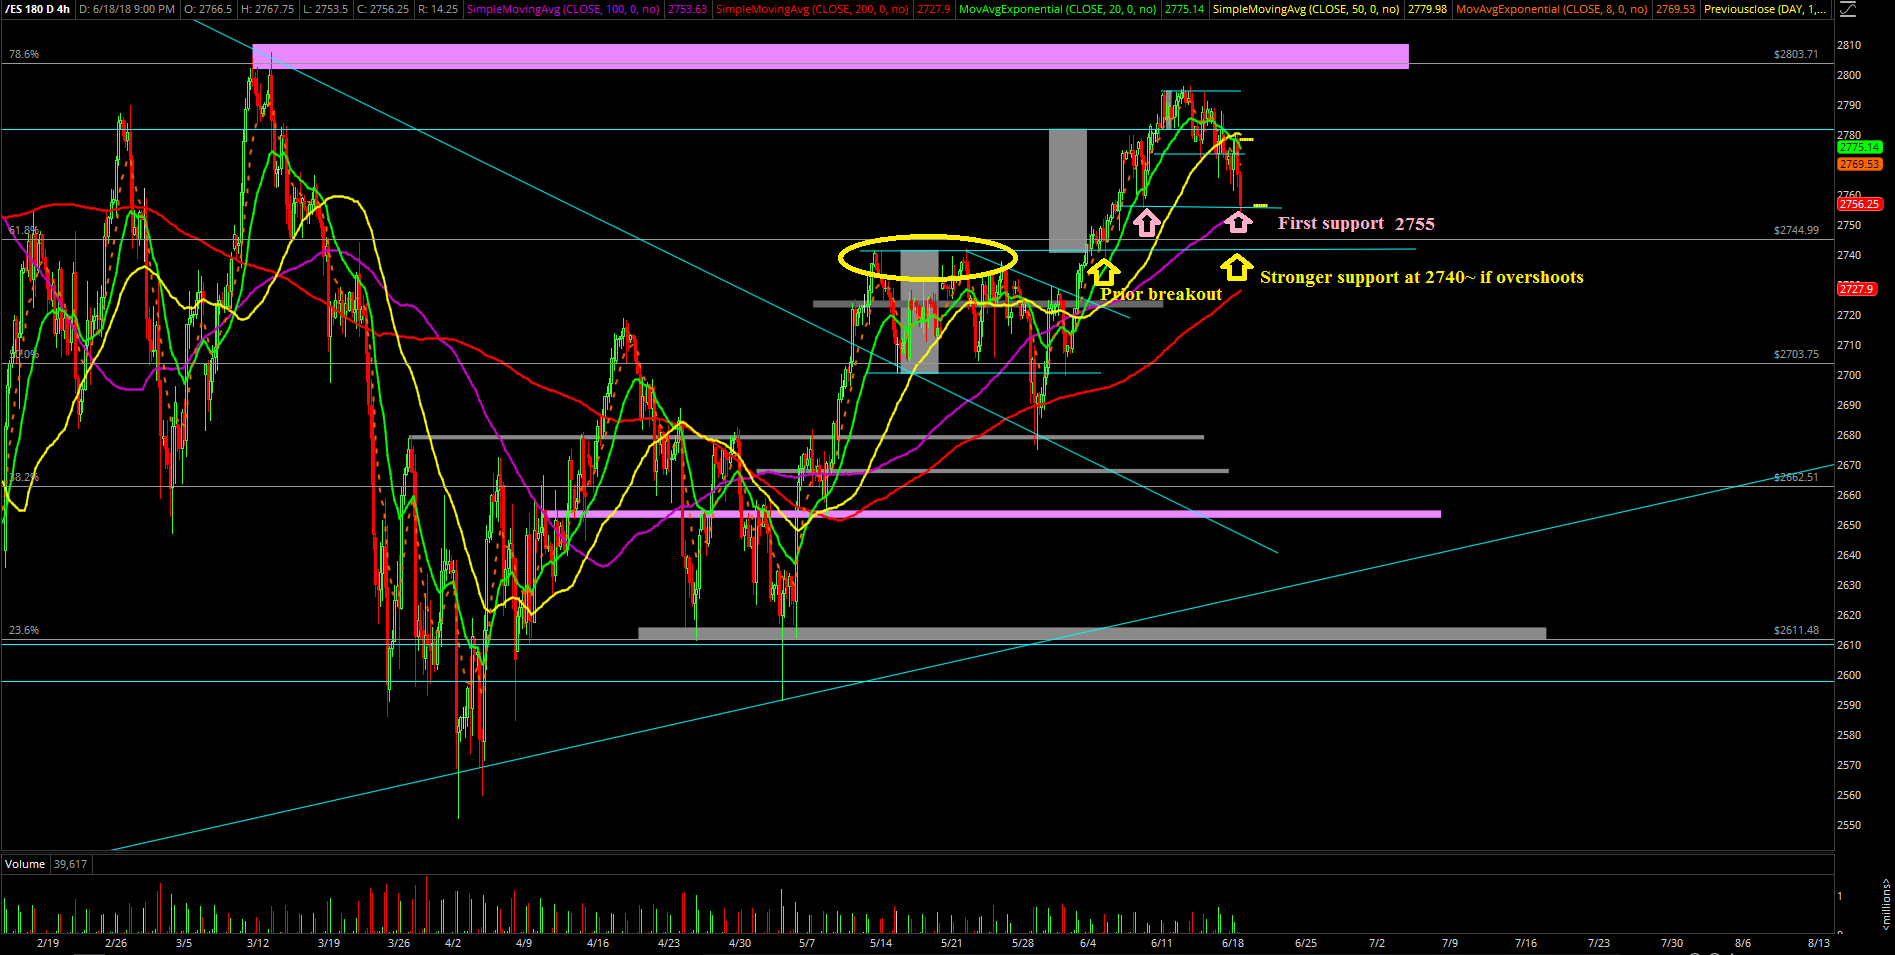
The main takeaway from this session is that the pullback has been fairly controlled ever since we nailed last week’s temporary top setup of 2796 as the bears took advantage of the opportunity. What we have now is that the market is most likely going to bounce from this region or it overshoots a little bit into the 2740 area given that the bigger perspective is still a bull train status. Timeframes matter a lot here.
What’s next?
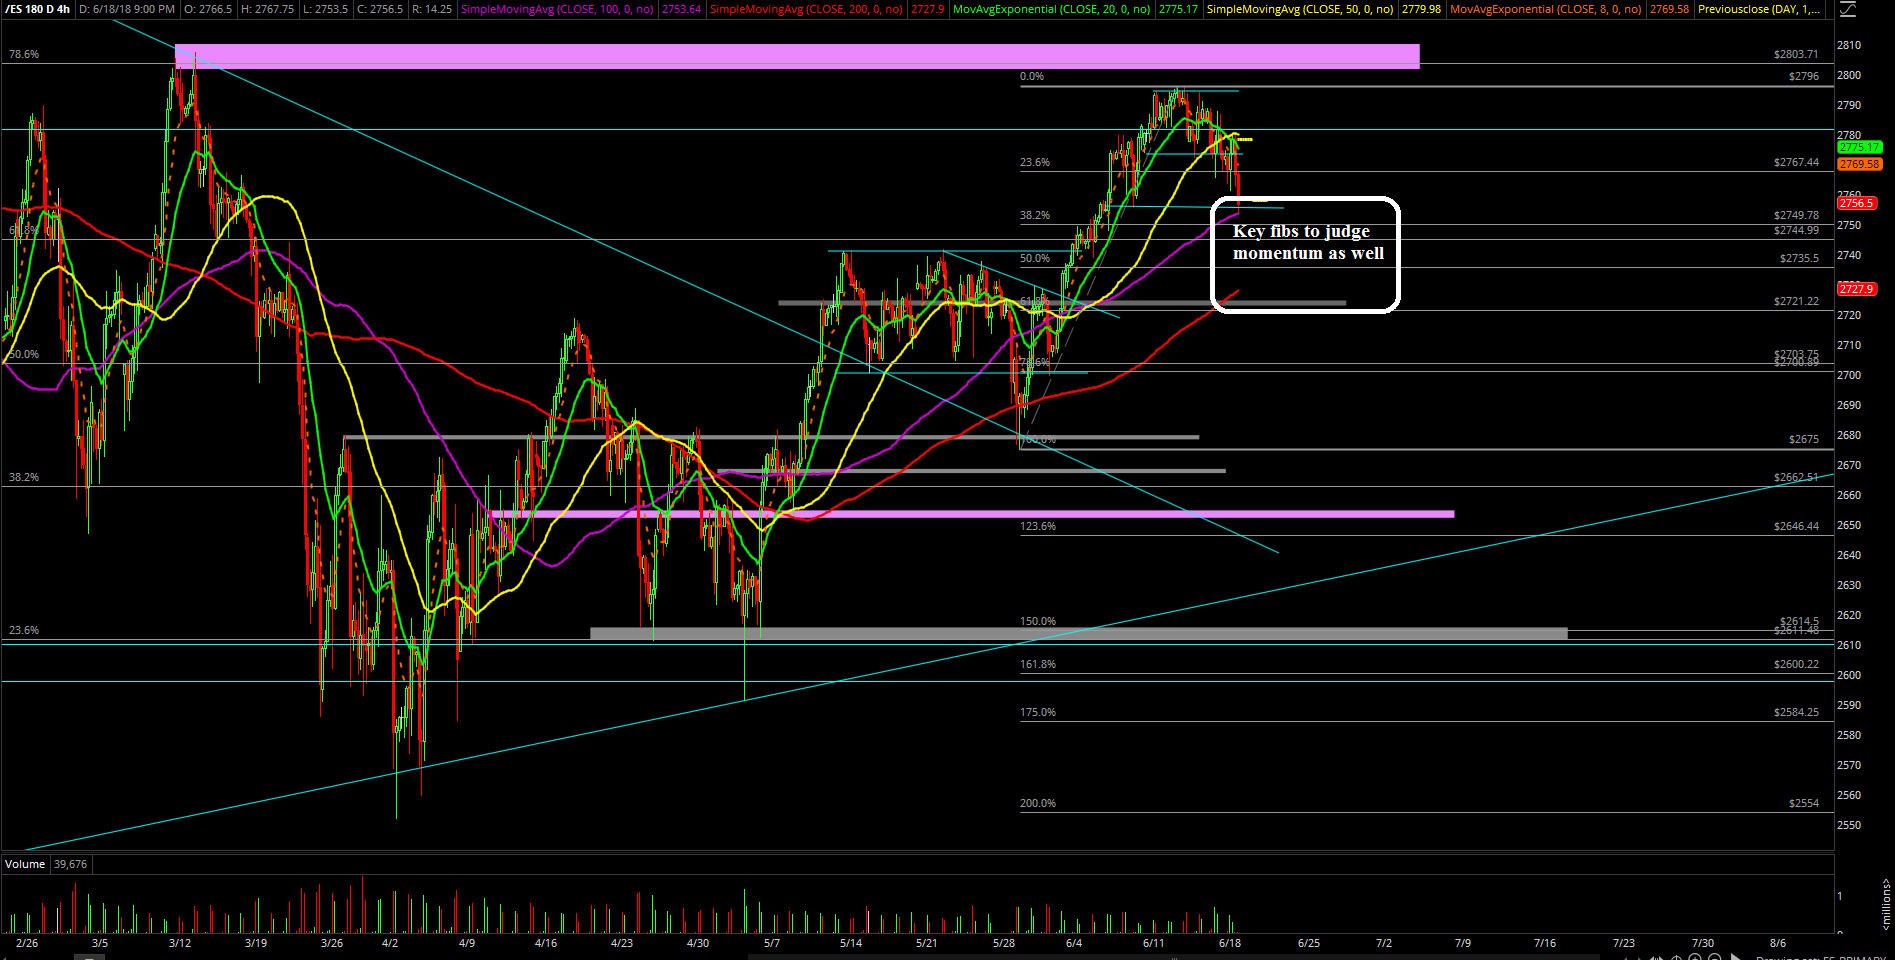
The daily closed at 2778.25 and it was a doji candle. As previously noted, we’re currently hovering around the 2755 level and it’s pretty clear on what bulls/bears have to accomplish based on the overall trend battle here. We’re expecting a stick-save to occur around here or overshoot to the 2740-42 support region where that represents the prior breakout from the May highs. (If you recall, the market broke above 2742 during the first week of June and off it went as expected.)
In simplest terms, heading into Tuesday and the rest of the week, look for a stick save either here at around 2755 or 2740 if this is following a standard bull train pattern on the higher timeframe charts. However, if we start seeing that bulls are too weak or that real bears showing up, then the additional downside levels such as the 2735 and 2729 levels (first week of June lows) would open up immediately. As noted earlier, we’re obviously favoring the first scenario, but need to see more clues by early Tuesday morning in order to judge the momentum of this overnight hours move. Let’s see how this pattern develops, knowing the different timeframes at battle here is very pivotal.