S&P 500 Getting Long in the Tooth
 By
By
I have been struggling with the S&P 500 charts since we held the previous support level at 2722 and made the new high yesterday.
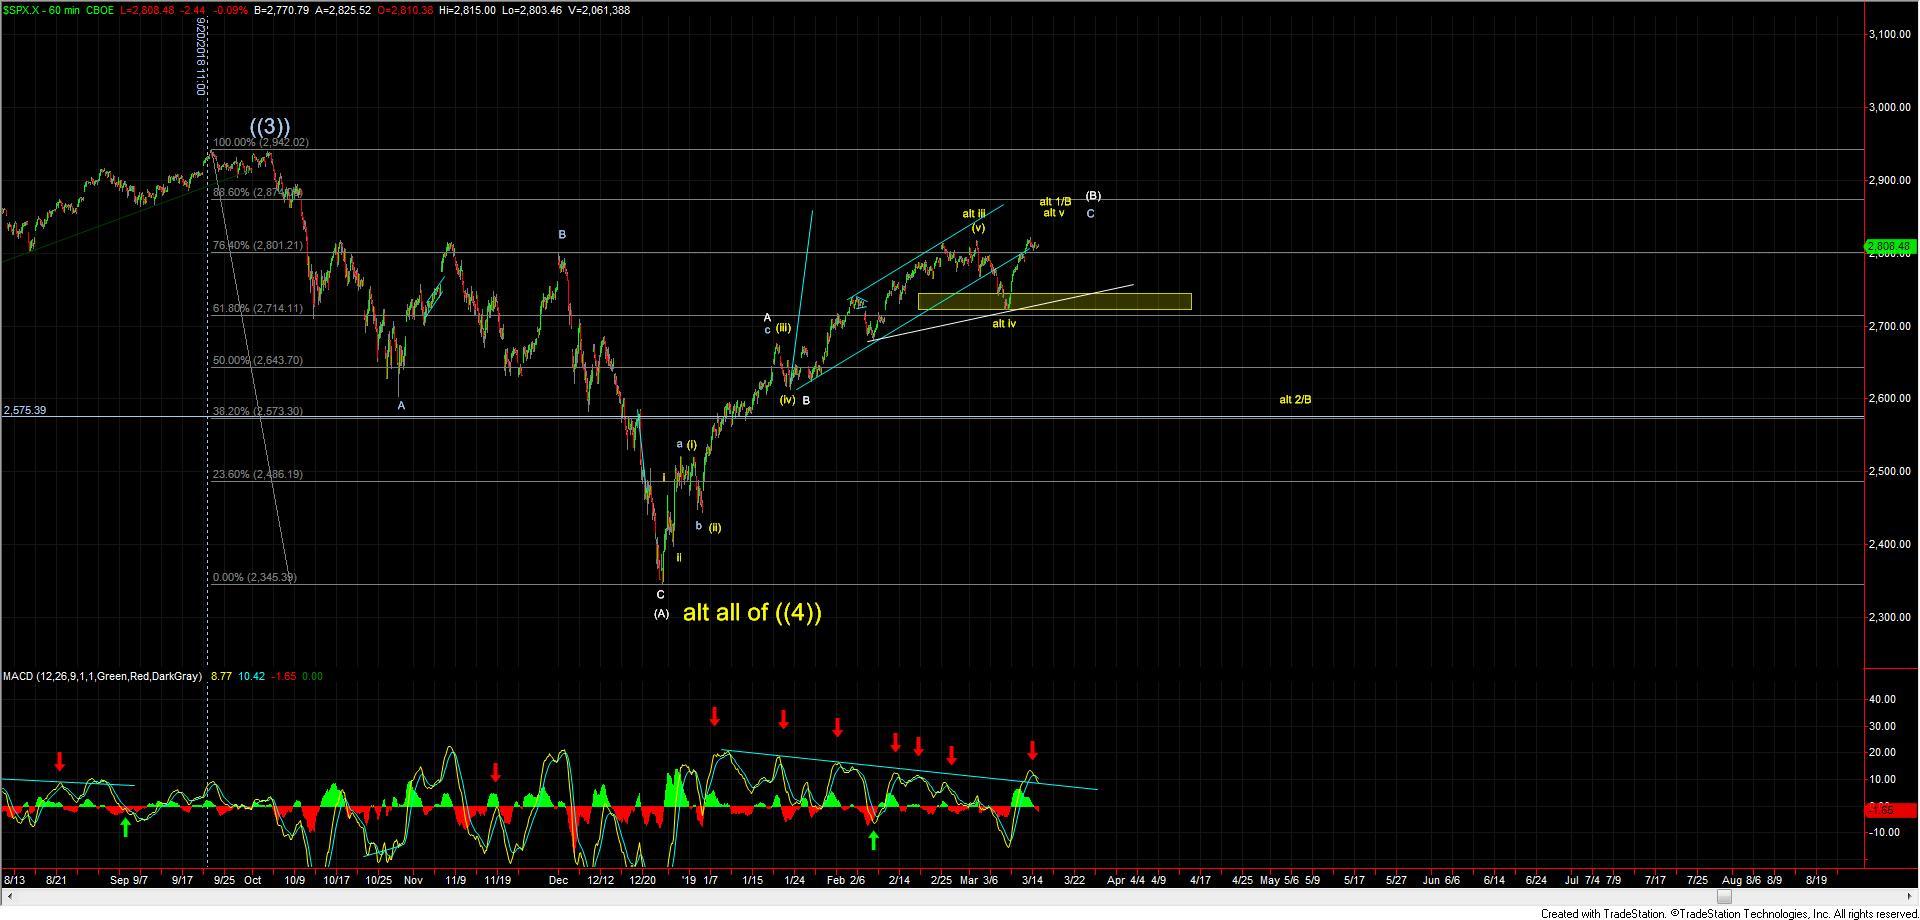
With that, I can now make the case for five waves up off the December lows, which is opening up the possibility that this low was all of wave ((4)). I have been allowing for this potential for quite some time, but with the new high yesterday, I am now giving this potential more consideration than I had previously.
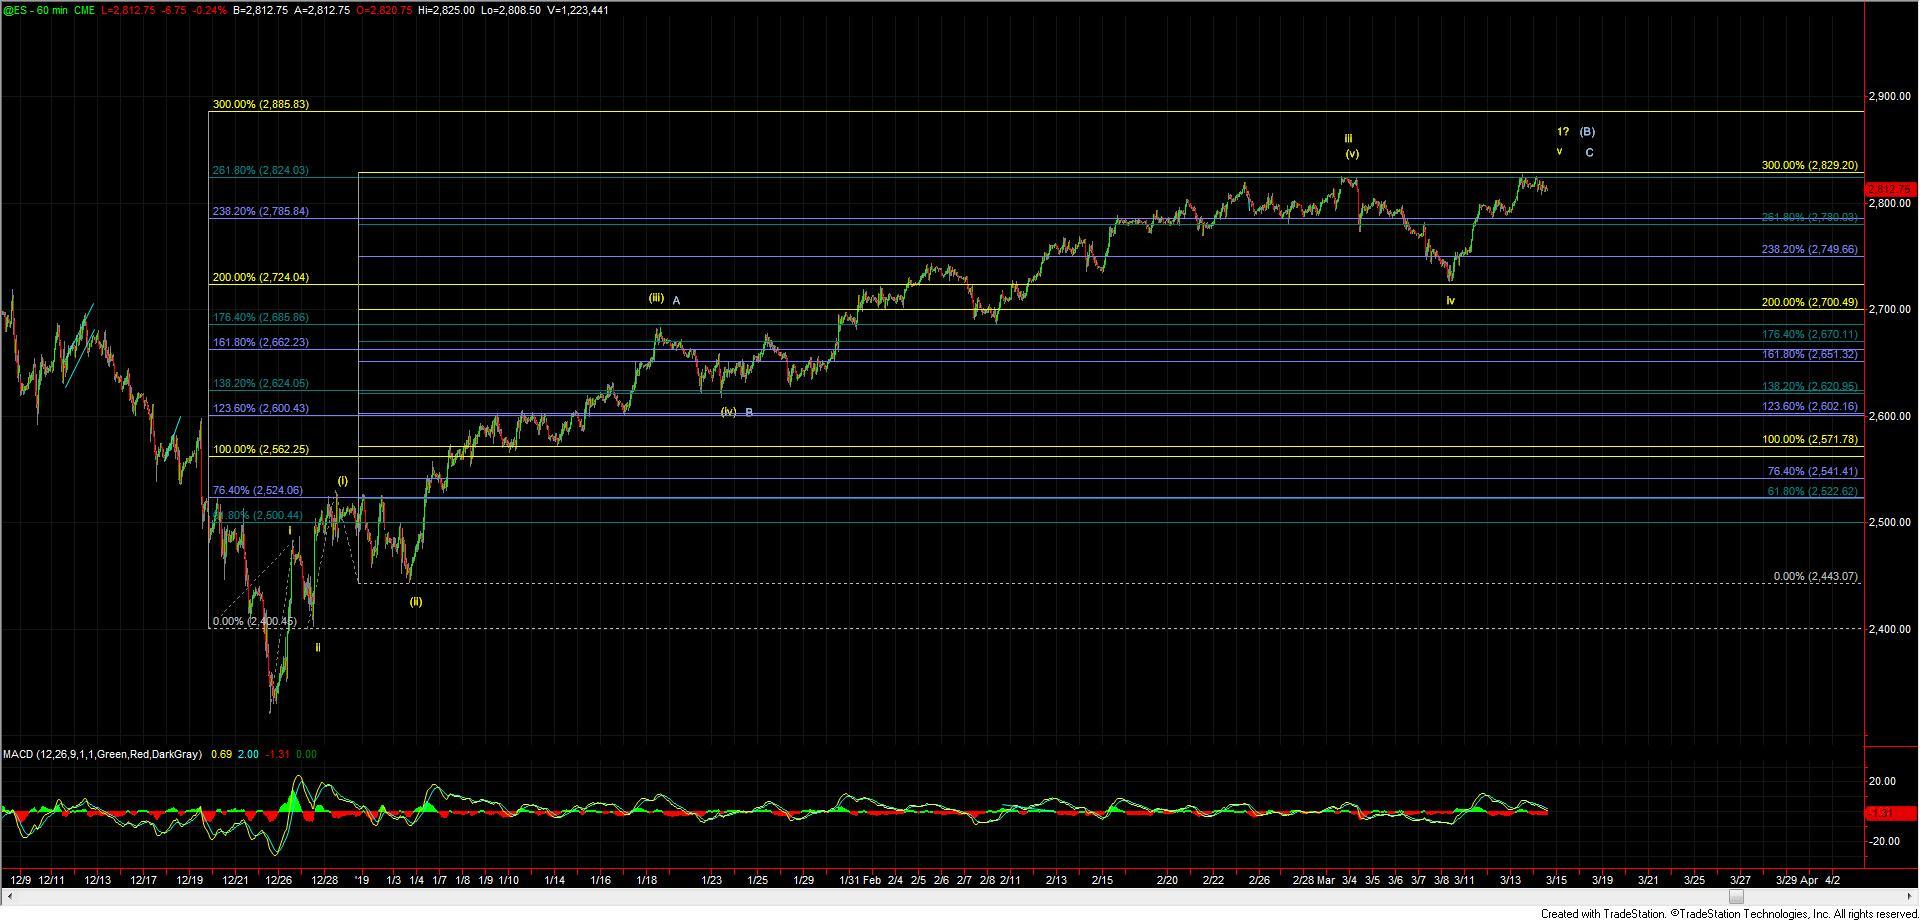
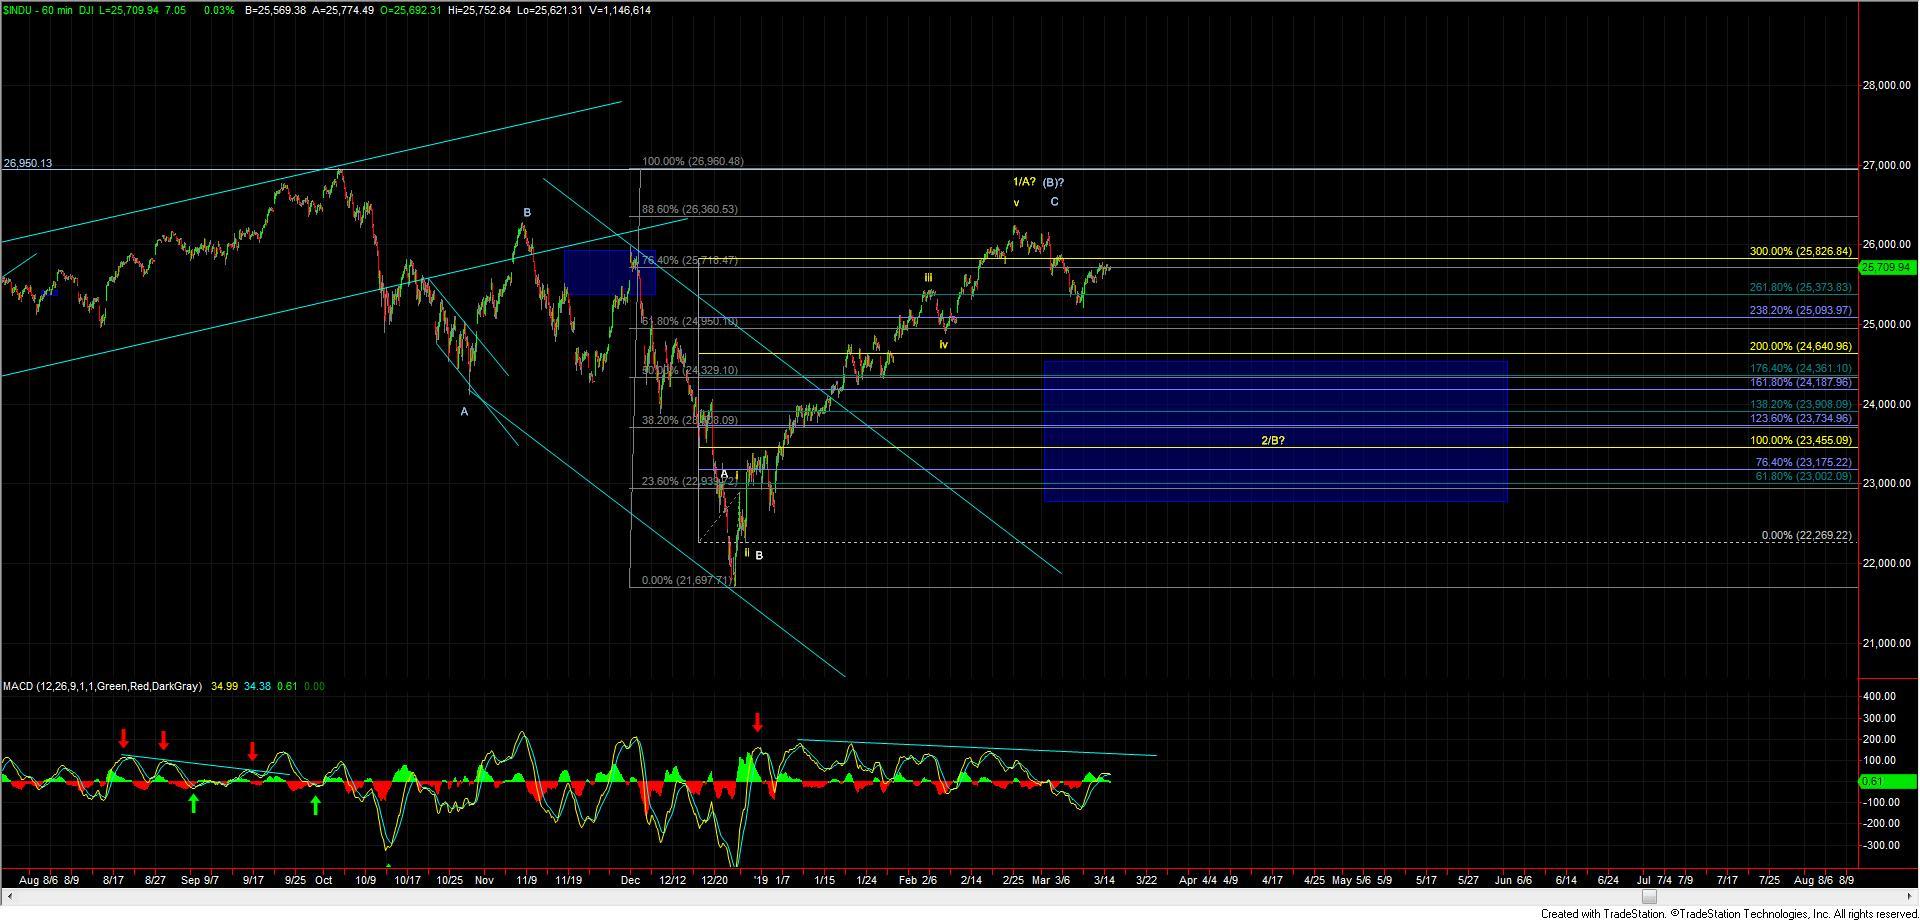
Now with that said, I still have several issues counting the action in this way, one of which being I do not have a great fit with the action I am seeing on the Volatility (VIX) charts. I do think the Emini S&P 500 (ES) has better Fibonacci proportions from the move up off of the December lows, and it looks like the Dow may have already topped on Feb 25.
In either case, white or yellow (SPX chart), I think this move is getting long in the tooth and should be seeing at least a local top sooner rather than later. The big question, of course, is whether this is the top of a wave (B) or simply just a wave 1 that ultimately takes us to much higher levels.
I am initially going to take my cues from the structure of the initial move down off the highs while keeping an eye on the Fib support levels below. But at this point in time, I am keeping an open mind to both possibilities.