SNAP: When Sentiment Takes Over
 By
Levi
By
Levi
By Levi at Elliott Wave Trader; Produced with Avi Gilburt
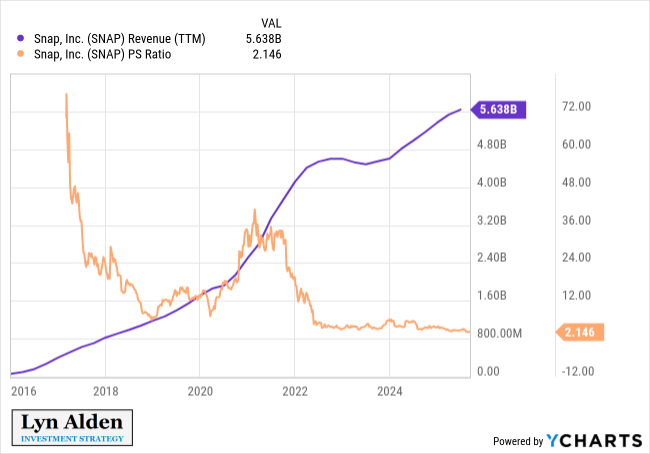
Back in September of 2021 SNAP was valued by the masses at over $100 billion. Fast-forward to today and that number is less than $12 billion. Instead of rehashing the past though, let’s review recent history and project what is most likely to happen next.
Yes, we could discuss the nascent strategy of the “start-up squads”, which may indeed prove fruitful. Or, we could analyze how the CEO is working most diligently to counter the current downtrend weighing on the company. But, there’s another powerful force influencing the stock price, often without many realizing it.
There is some interesting overlap regarding this influence revealed in Lyn Alden’s recent comments:
"SNAP has emerged from a period of stalled revenue growth, and is historically cheap, but serious questions remain about its ability to grow profitably. The main long-term risk at this stage is to become a value trap, perpetually cheap and perpetually troubled, as a platform with an insufficient network effect. I would defer to traders on the stock, since I have not formed any long-term bullish conviction on the company.”
So, what is this apparently enigmatic influence?
It’s sentiment - crowd behavior exhibited via the structure of price on the chart. In the case of SNAP, we were watching this very thing some 4 weeks ago, pre-earnings. Note what our lead analyst Zac Mannes was projecting as the most likely path post-earnings.
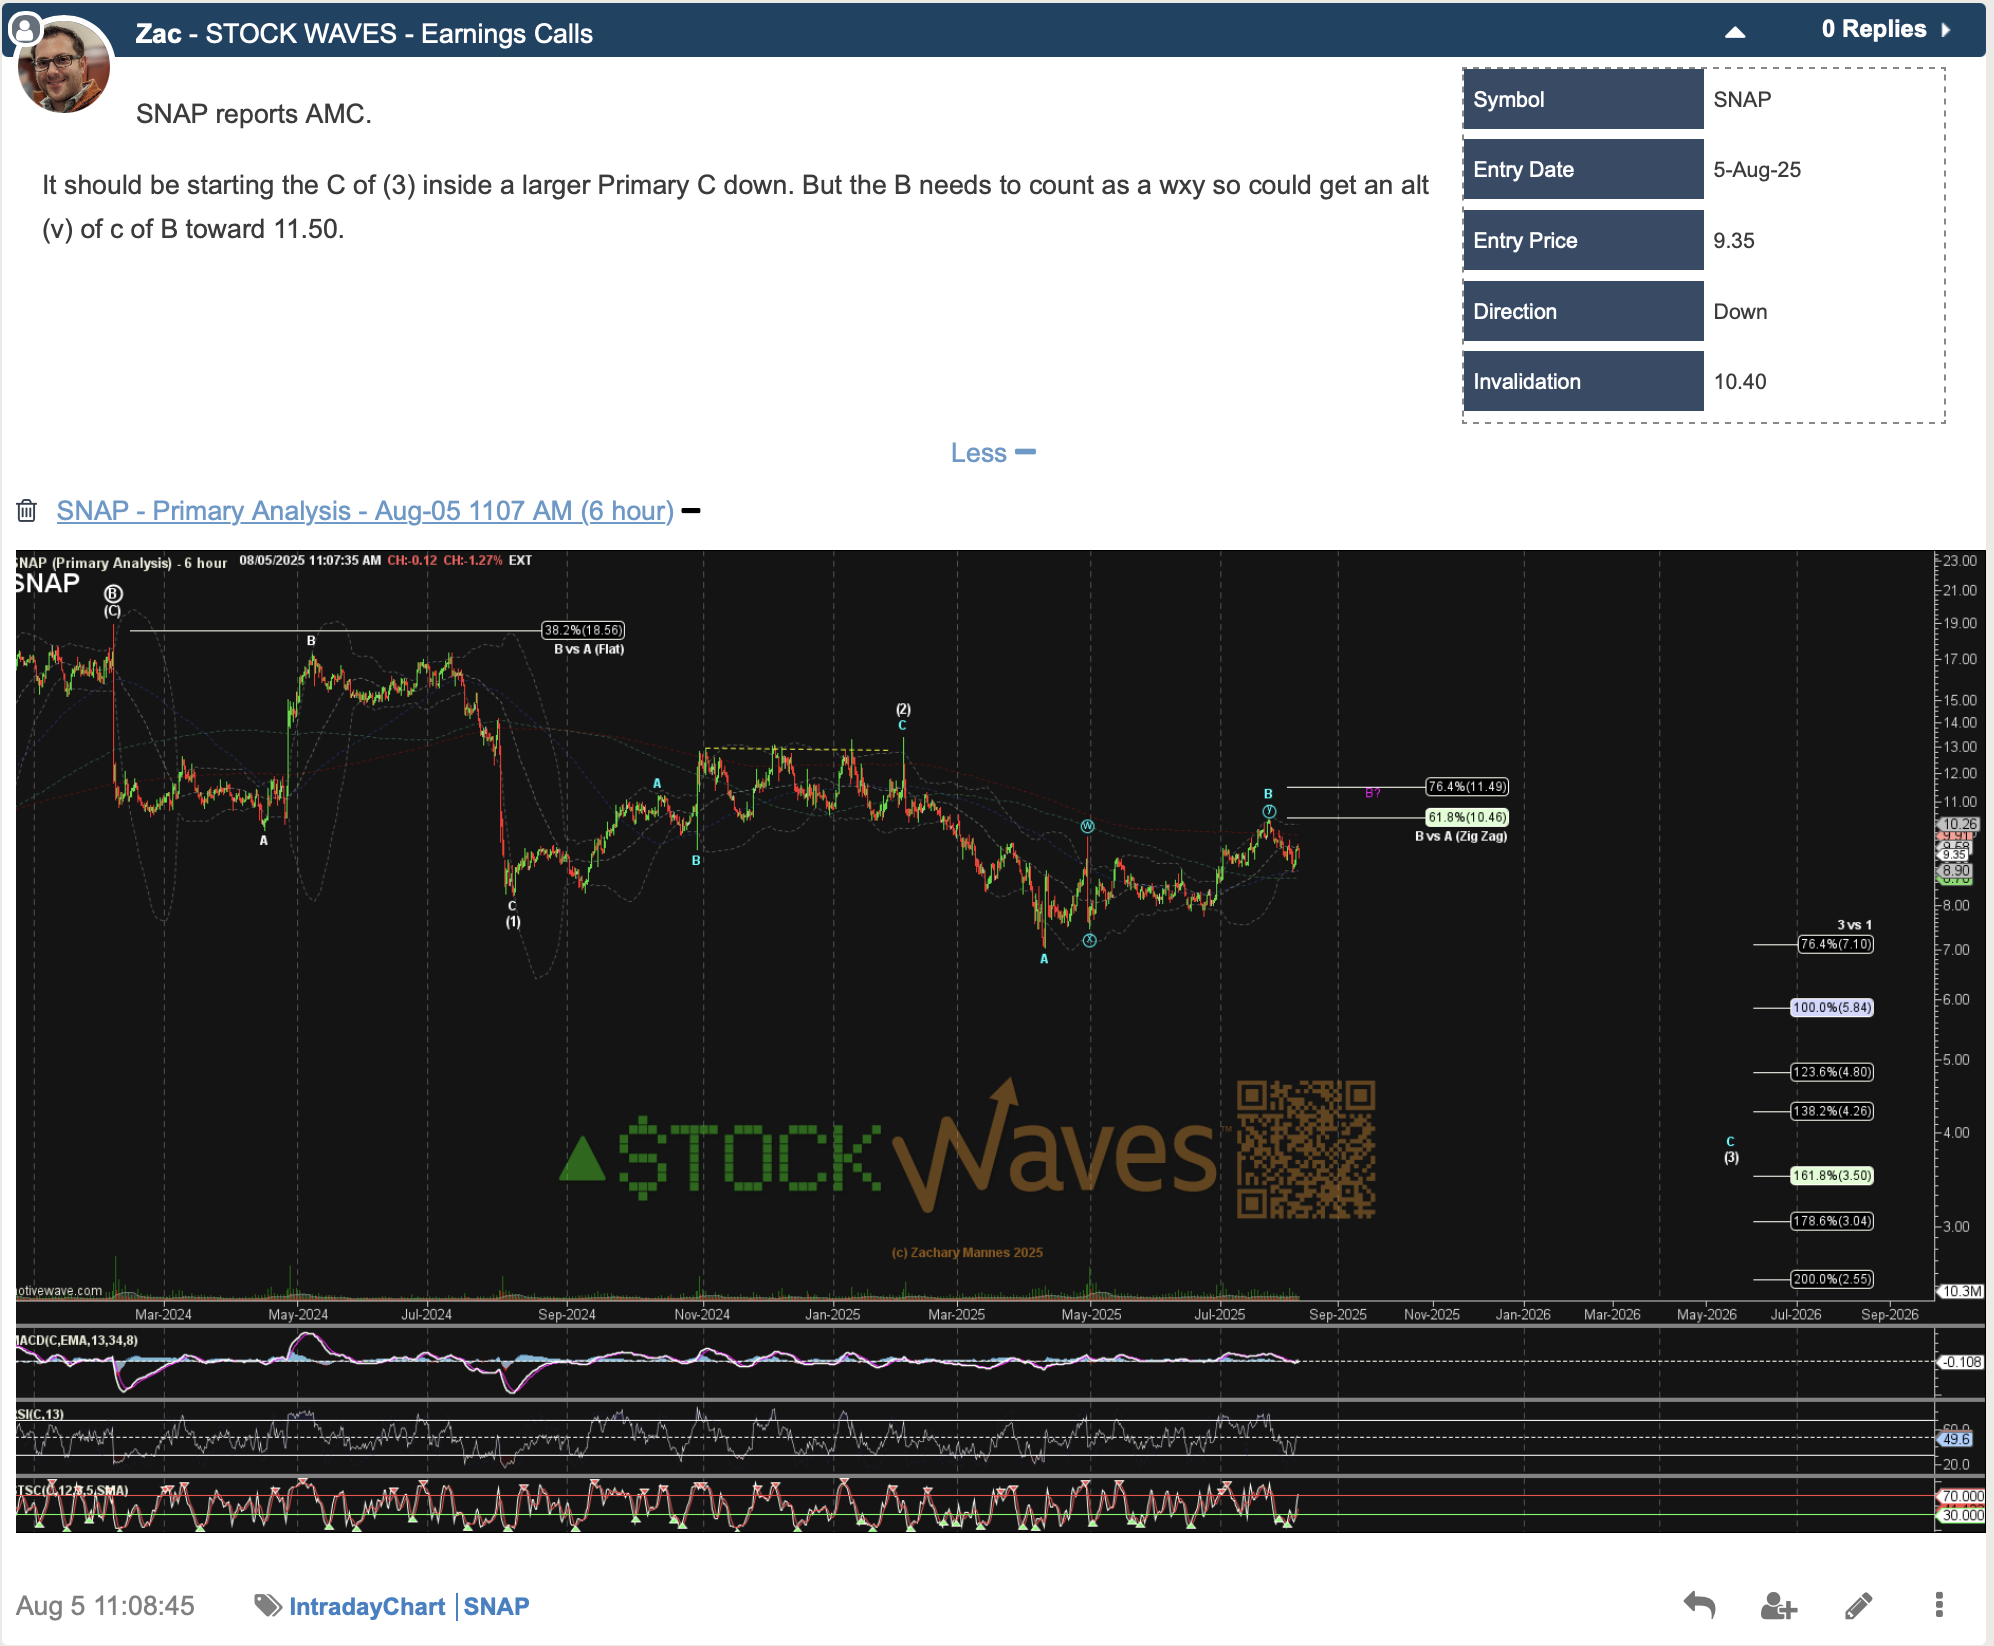
While the chart uses technical labels, the takeaway is simple: SNAP has been locked in a corrective pattern since its early 2024 high.
With that high being a (C) wave of a larger Primary ‘B’, we were anticipating a 5 wave Primary ‘C’ decline. Now the lesser degree intermediate waves (1) and (2) have formed. Notably, this structure resembles a non-overlapping diagonal, with subwaves unfolding in A-B-C fashion. Price is now likely in wave ‘i’ of C of (3), and any wave ‘ii’ bounce should ideally hold under $9.
How are we able to project this type of movement? Again, this is the comportment of the masses in action before our very eyes. These moves form structures that repeat in self-similar patterns across different scales. These fractal forms help project the probable path ahead.
What seems to lie ahead for SNAP? Recall that price appears to be in a Primary ‘C’ wave down. C waves are 5 wave structures. As this plays out we should see wave (3) of the Primary ‘C’ complete in the $3.50 to $4.25 area. A corrective wave (4) likely takes price back to $4.80 to $5.84 before a final decline in wave (5) of Primary ‘C’.
This will take some time. While we do not use this method to project time targets, the structure of price will indicate when completion is likely.
One of the main advantages of this way of viewing the markets is that it provides context in the moment. In the current climate of sentiment, the chart suggests it will take time before a bullish opportunity develops.
