Resurrection Of Bears - Market Analysis for Oct 2nd, 2019
 By
Ricky Wen
By
Ricky Wen
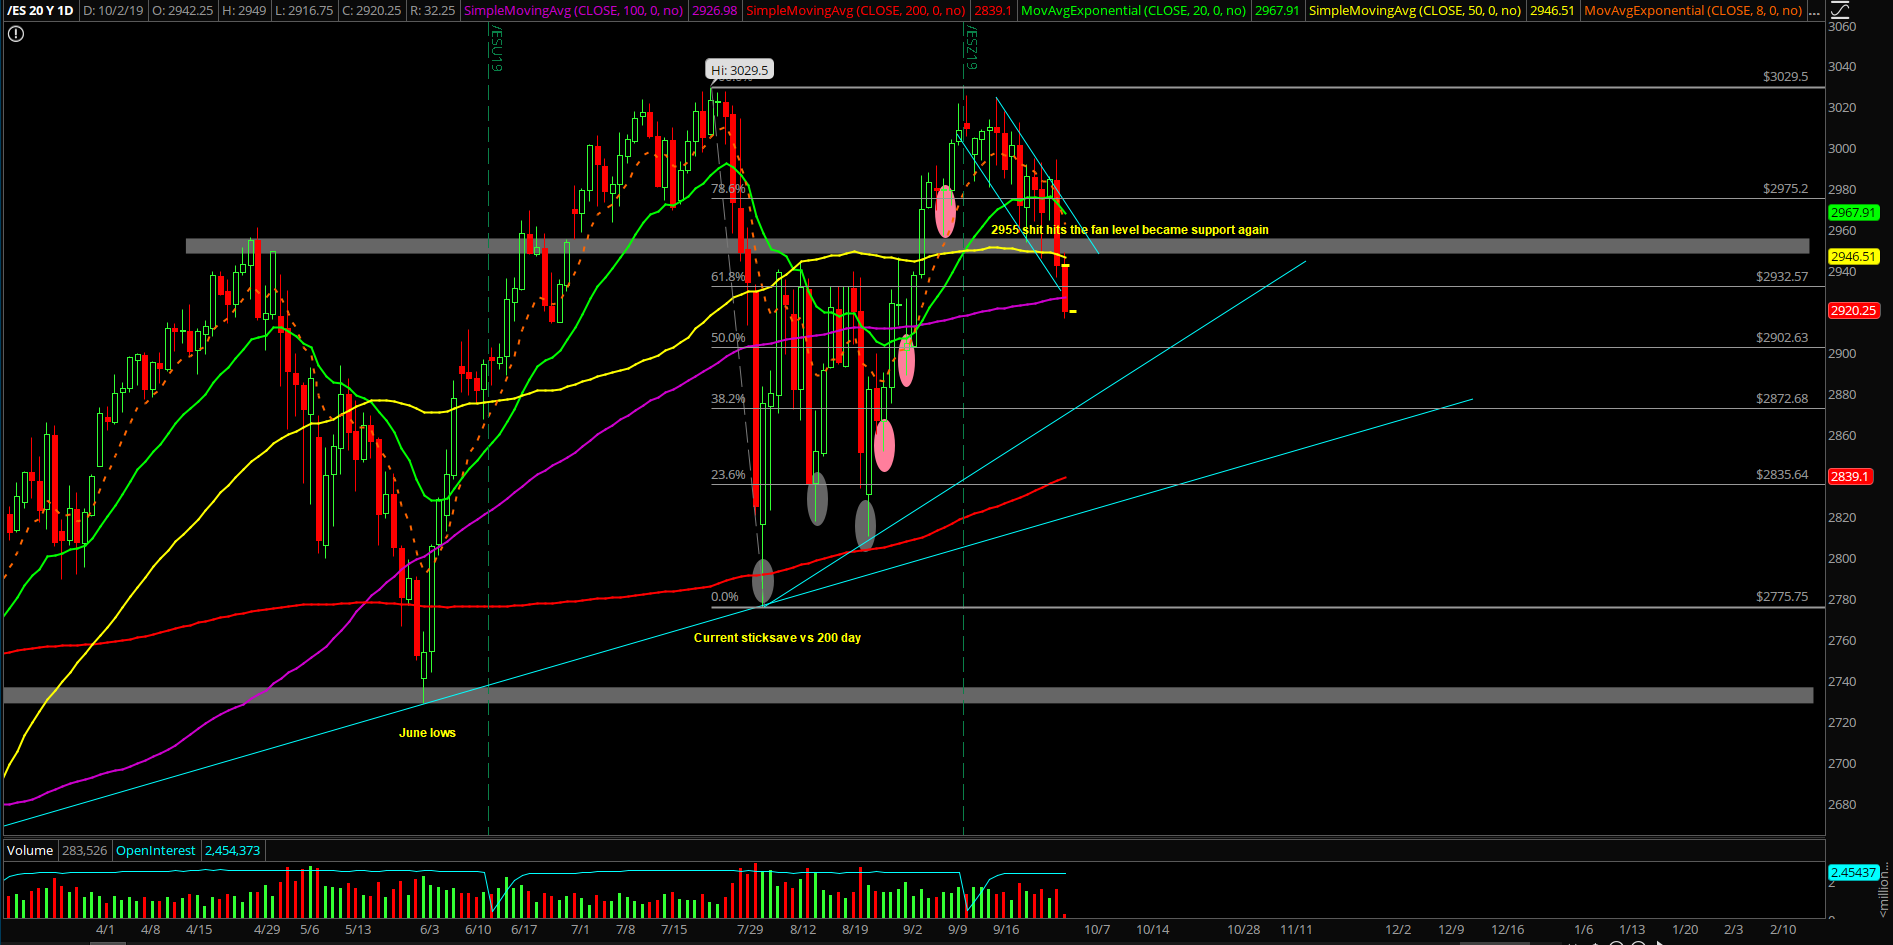
Tuesday’s session confirmed the resurrection of the bears alongside with the initial confirmation of the 3020s double-top pattern on the Emini S&P 500 (ES). Price action accelerated to the downside immediately after the 10AM ISM report timing catalyst and the prior day’s low at 2964 could not hold. And then, the 2955 major level/"sh*t hits the fan" level was triggered shortly after alongside with last week’s 2946.25 low being broken.
All this meant that it was a legit breakdown after numerous attempts from the past 2 weeks and the bears got their wish granted with the daily closing print that was decisively below our 2955 key level. If you recall, 2955 key level has been utilized for the last few months and it was the trigger in late July that initiated the mini liquidation event for August into the 2800s daily 200SMA support area.
The main takeaway from this session is that the immediate trend is obviously in a risk-off manner with the double-top pattern when price trades below yesterday's 2994.5 high and especially when below 2955. Now comes the hard part because October is now going to be an inside month within September’s 2889-3025.75 range until proven otherwise, so traders must be mentally prepared for some shake and bakes ahead. Will bears be able to open up the break of the September low and open up the overall range?
What’s next?
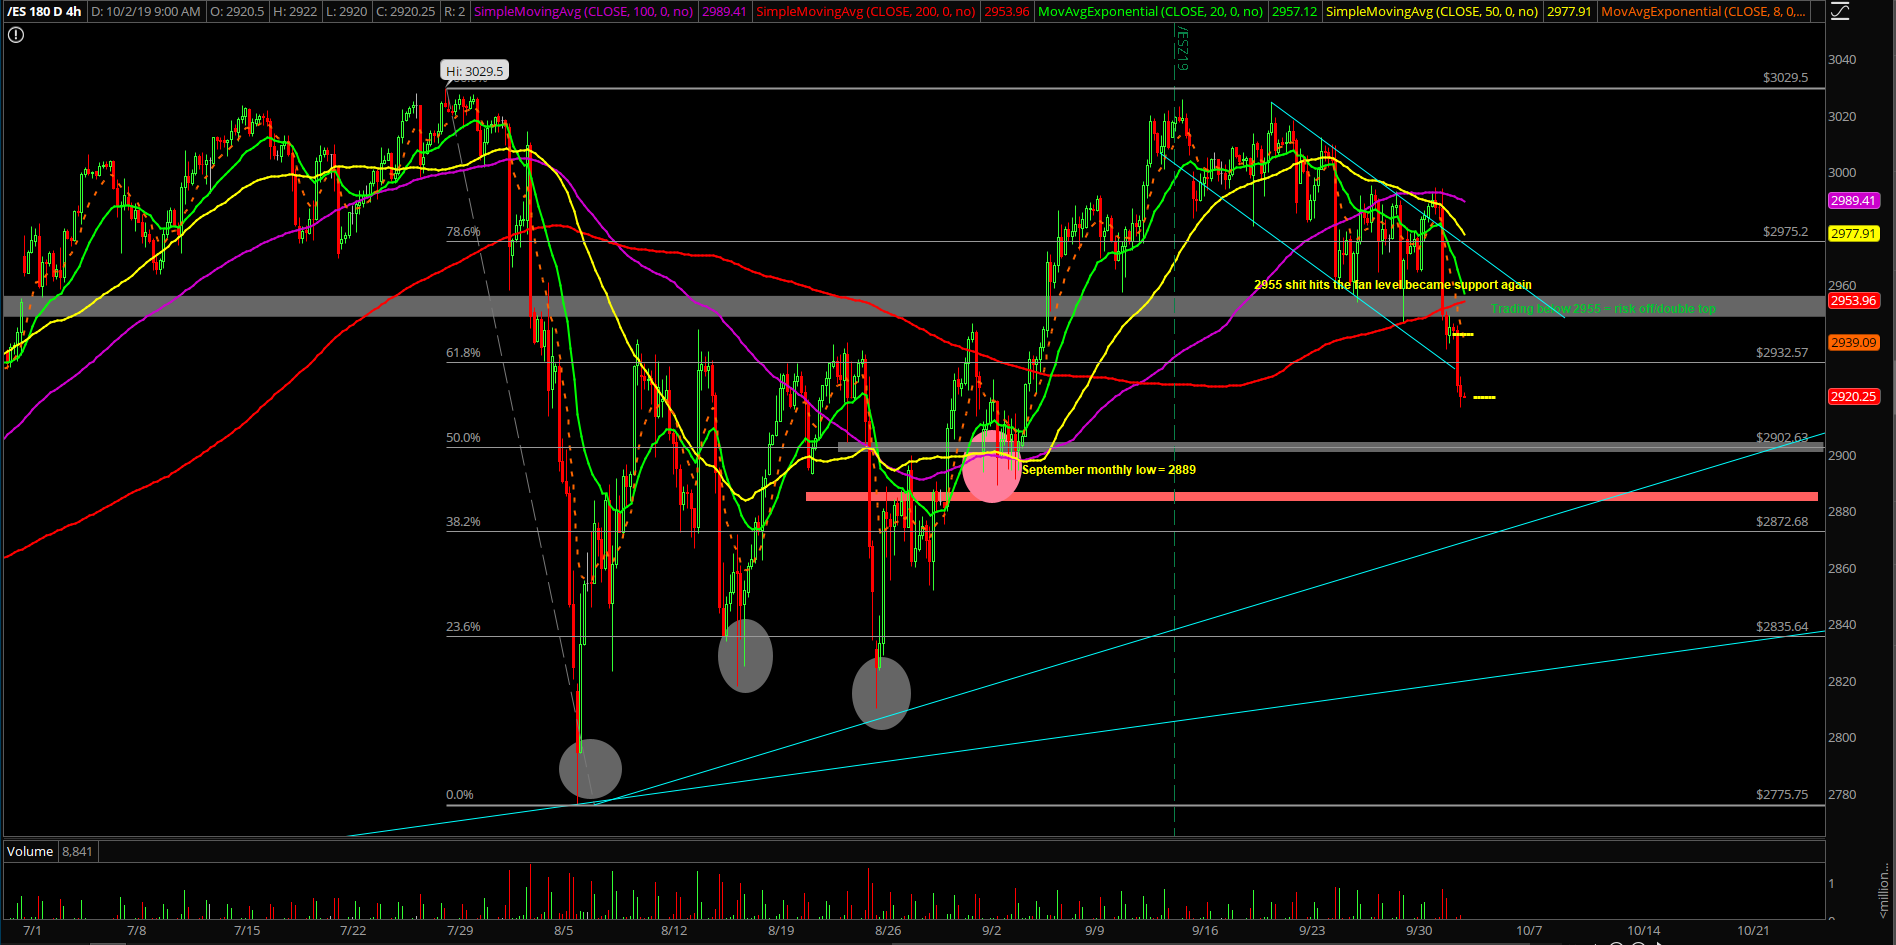
Tuesday closed at 2942.5 on the ES and it was an outside day reversal/massive bear engulf candle. Market is in downside acceleration mode backtesting more key supports and it’s only day 2 of the move, so be aware of being taken out to the cleaners if attempting countertrend longs vs random levels.
We’ll include a few key points from the premarket ES trading room’s game plan below:
- Bearish bias when immediate term below 2955 given the overnight accelerated momentum to the downside setup.
- It’s only day 2 of the downside move so be mentally prepared to look for STFR opportunities into potential day 3 when vs. resistances levels labeled below.
- You know it’s for real when price action trends 1hr 8ema down and yesterday was a massive outside day reversal/bear engulf candlestick on the daily chart.
- No longs allowed unless it’s an oversold/value play with great R/R vs. 2889/2900 because risk off/downside acceleration trumps all right now as everybody and their mother stuck in a mini liquidation feedback loop after 2955 "sh*t hits the fan" level got triggered yesterday.