Resistance Repels Bulls - Market Analysis for Jan 23rd, 2020
 By
Ricky Wen
By
Ricky Wen
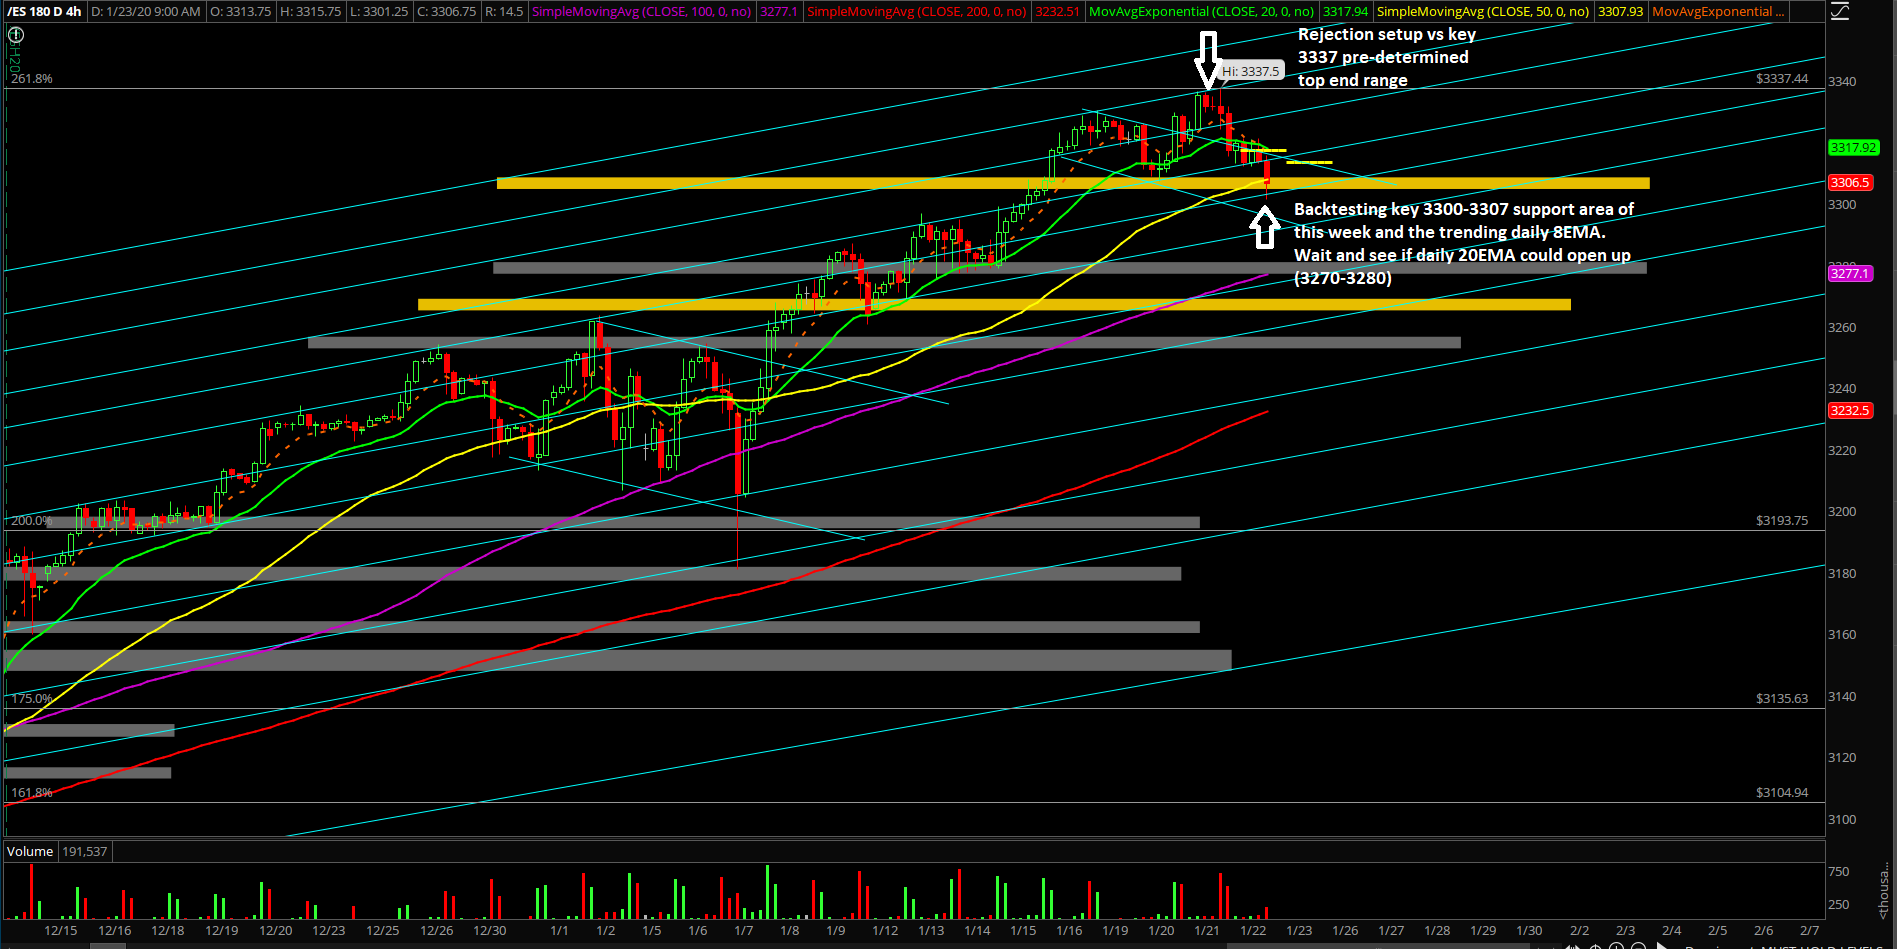
Wednesday’s session played out like a textbook as price action showcased an intraday HOD/top rejection at 3337.50 on the Emini S&P 500 (ES) -- right at the key 3337 level we've been discussing. This also meant that the bulls did not have enough juice to close above 3337 for the closing print and the mythical creatures/bears got what they wanted for just a single day by closing around the lows of the day.
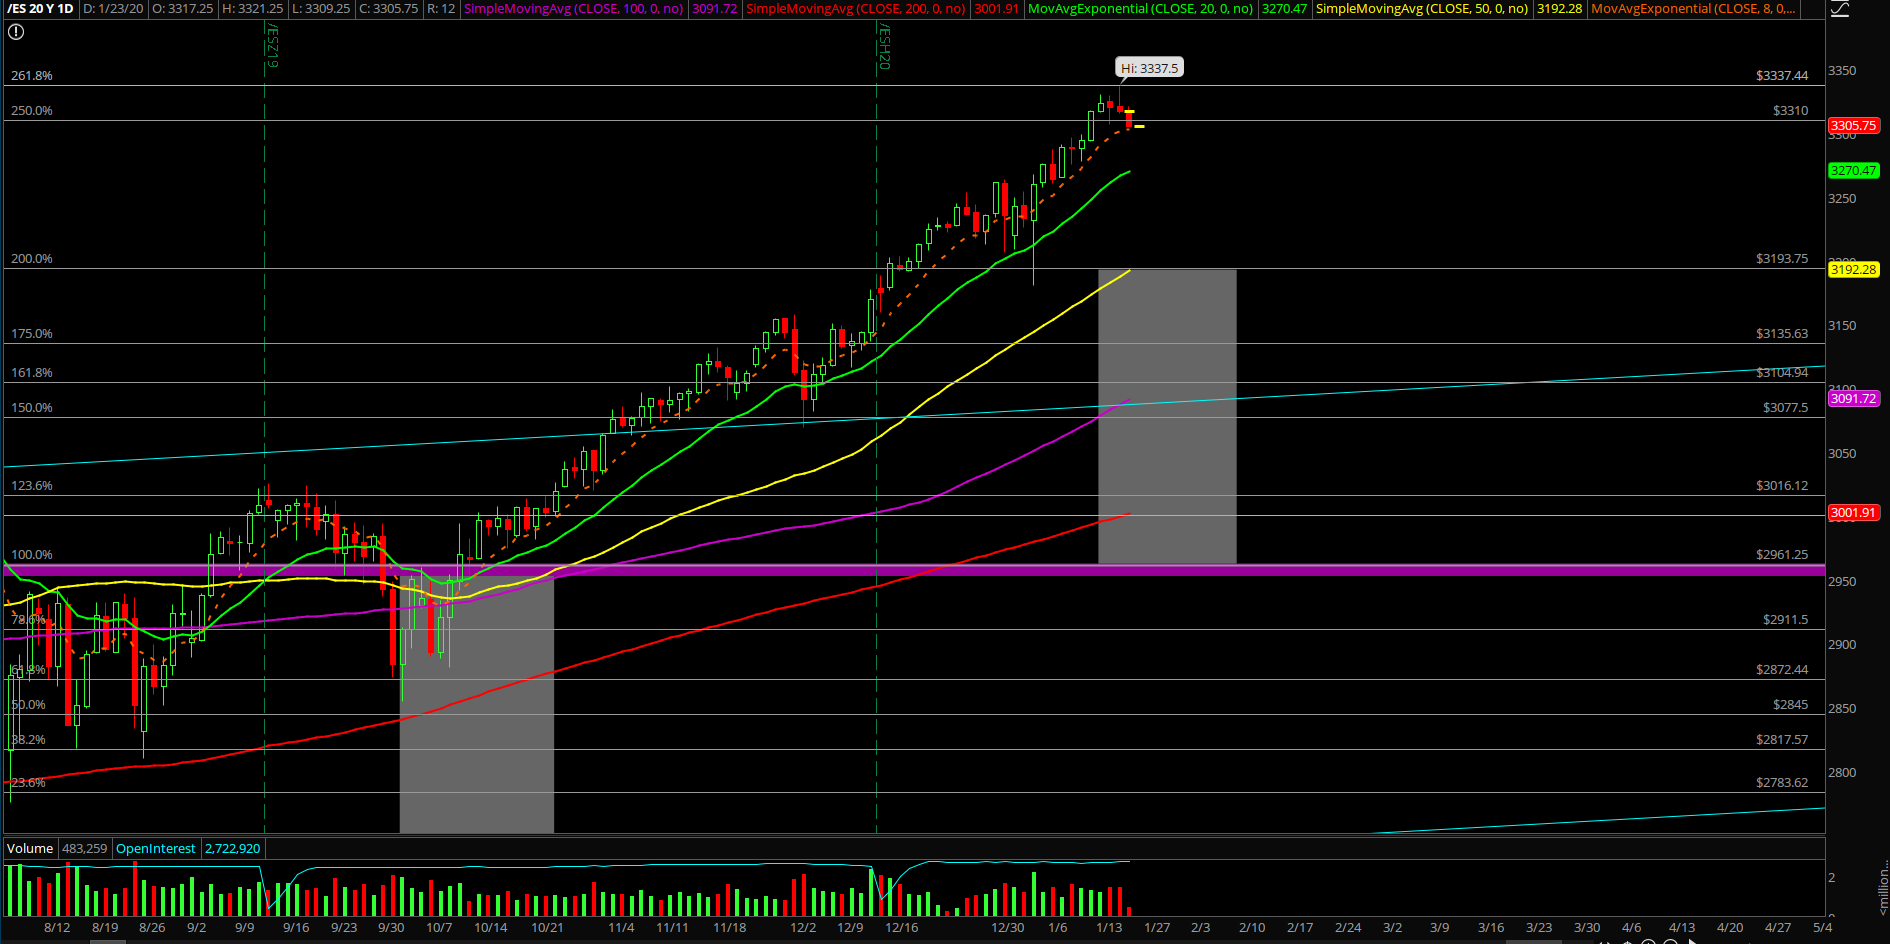
Essentially, this attempt and threat of opening up the January upside range was shot down and the market is still deciding what to do in regards to the trending daily 8/20EMA backtest as no significant support has broken yet. (Market is currently backtesting 3300-3307 area, which is this week’s current low and daily 8EMA.)
If you recall, the market on Jan 8th held the daily 20EMA backtest region across all the equity indices and produced an imminent V-shaped recovery in the next couple sessions followed by the continuation setup into this week’s likely higher lows and higher highs grind into new targets. Obviously, it’s been the same old structure since the October 2019 breakout acceleration as the bull train maintains course and nothing really significant has changed since then with the good old daily 8/20EMA momentum. The bull train structure will be trying its hardest to maintain the same structure into the January monthly closing print in order to produce a decent prerequisite for the January barometer stats.
What’s next?
Wednesday closed at 3317.25 on the ES as a top wick rejection candlestick and overnight continued off with the lower highs and lower lows structure offering no surprises as the highest probability backtest area back to the week’s low of 3307 has been met. What this means is that the short-term setup from yesterday’s high to today’s current morning low has played out in terms of the highest probability portion and now the market is figuring out what to do with the rest of the day vs. our predetermine key levels.
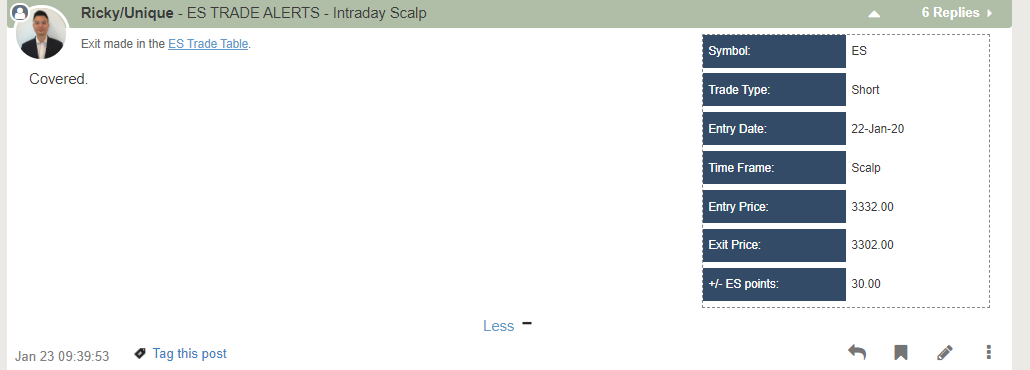
As you'll see below, we covered our short trade in the ES in our ES Trading Room at a strong profit.
Here is a summary of our game plan:
- Backtesting 3300-3307 area which is coincidentally daily 8EMA area , see if price action extends downside into daily 20EMA (3270-3280) next or holds around here as we’re looking to take profit on some shorts soon
- Traders can continue to utilize 3319 and 3307 as short-term trending key pivotal levels for rest week alongside with above/below 3337 as key momentum indicator
- Bulls need a close above 3337 in order to enhance up of opening up the January upside range into the next calculated levels by continuing the grind into month end closing print
- Mythical creatures/bears would need to breakdown vs. 3319/3307 key short-term levels to have a fighting chance into daily 8/20EMA that eventually acts as another buying opportunity. Otherwise, it’s another round of high level consolidation due to the structure of HLs+HHs
- As we may discussed previously, the easy part of this month is pretty much considered over 3181->3337 given the pre-determined range via our calculations. This means that traders ought to stay cautiously optimistic here while hedging themselves properly in a portfolio approach when utilizing/leveraging the trend here being a bit extended here according to standard deviation calculations+stats
What are the key levels to be aware of?
- Resistances 3319, 3337, 3345, 3350, 3367, 3385
- Supports 3307,3300,3294,3280,3273,265,3250,3235,3225, 3215,3208,3200,3190 ,3177, 3172,3165,3158, 3150, 3140,3135, 3125, 3120, 3117, 3112, 3107, 3100, 3095, 3082, 3074, 3063, 3050, 3035, 3030, 3016, 3000