Reminiscing About 2015 - Market Analysis for Aug 1st, 2018
I will probably repost this in my weekend update, but I was asked a question of whether the action we are seeing now is similar to what we saw at the end of 2015 right before the complex bottomed. And, as I thought about it, allow me to say a bit about it, especially since there is not much more in the way of technical update I can provide.
When the market initially topped within $6 of our target back in 2011, I was looking for at least a .382 retracement of that rally, which was a sizeable correction anyway. Once we got that, I gave the market an opportunity to prove it wanted to continue to be bullish from those higher levels. Clearly, it invalidated that potential, which then had me focusing on my deeper potential target in the 700-1000 region for gold.
Yet, once we moved into 2015, it became clear that the downside pattern had morphed into an ending diagonal for the final 5th wave. That meant that, when it completed, I expected a very strong reversal back to the upside. What struck me about the period towards the end of 2015 was how certain so many in the market were that gold was going to drop below $1,000. Yet, the pattern was exhibiting an overlapping structure, and each time the sellers tried to push it down further, it bounced right back up – hence, the ending diagonal pattern. This caused me to abandon my initial expectations of at least striking that $1,000 region, and when we hit the lows near $1,045 that evening in December of 2015, I bought more gold, and noted it in the trading room, as there was strong potential the bottom was at hand.
In this current drop since early July, I am getting a similar type of feeling. While I don’t trade on “feelings,” I did want to note that I am seeing many similarities. But, remember, even though markets are fractal, they do not play out in the exact same way, but they often do rhyme.
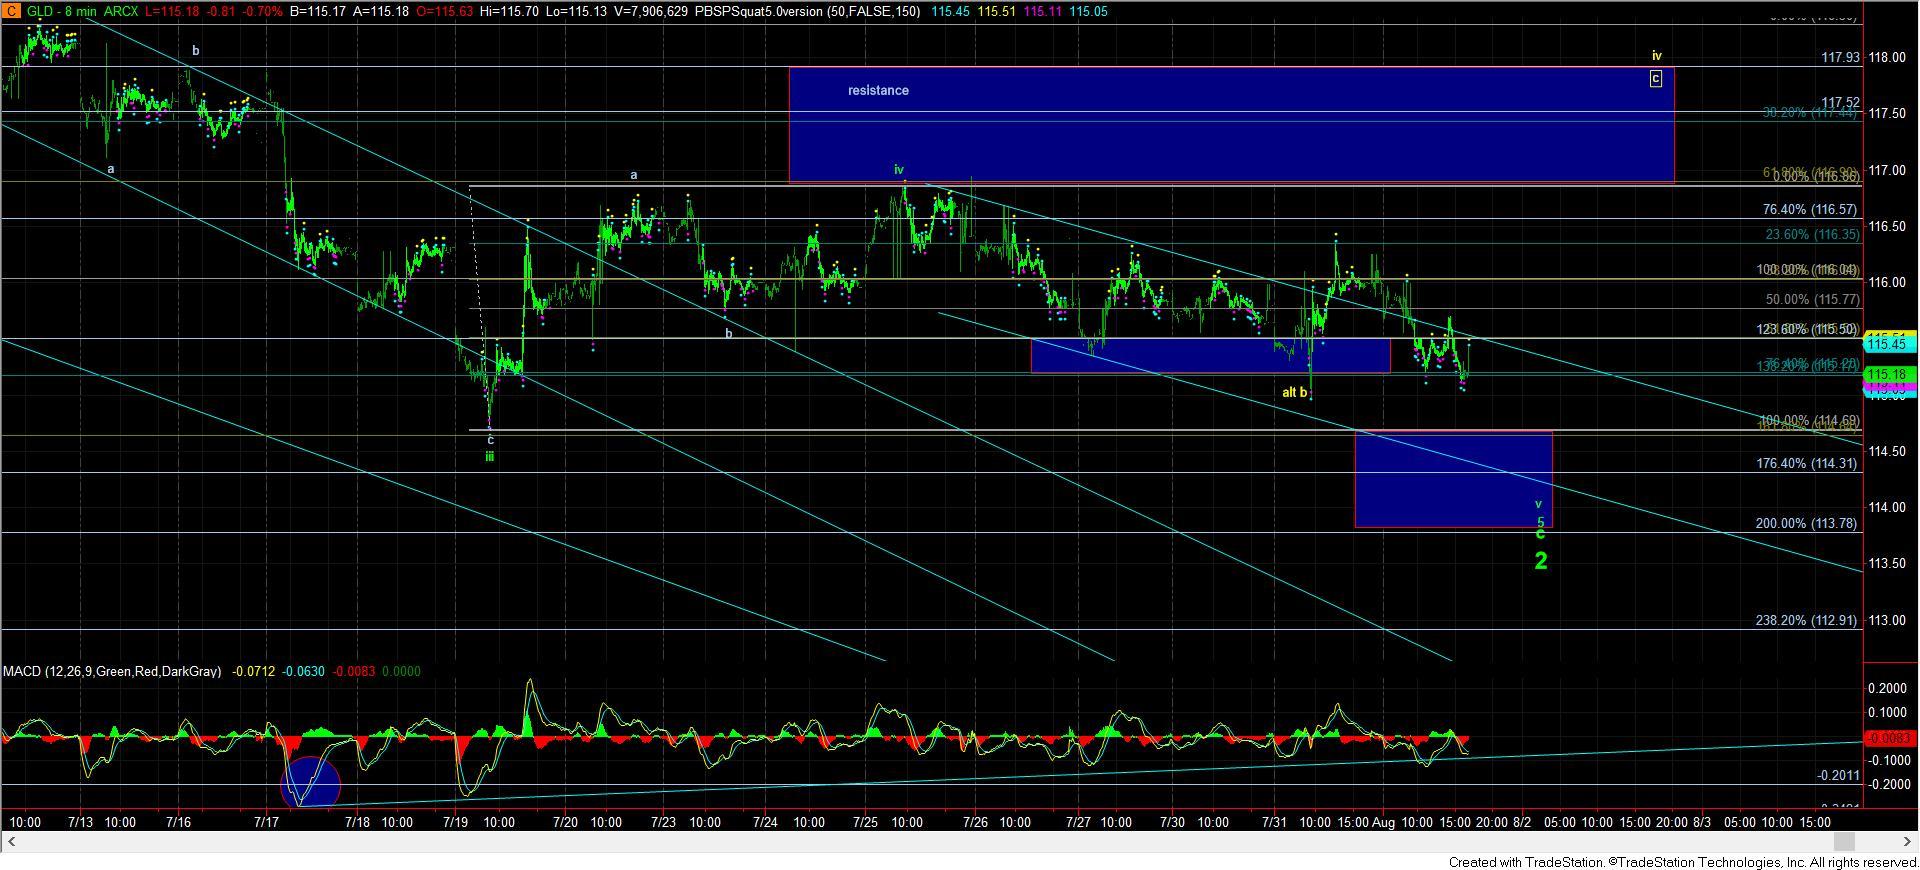
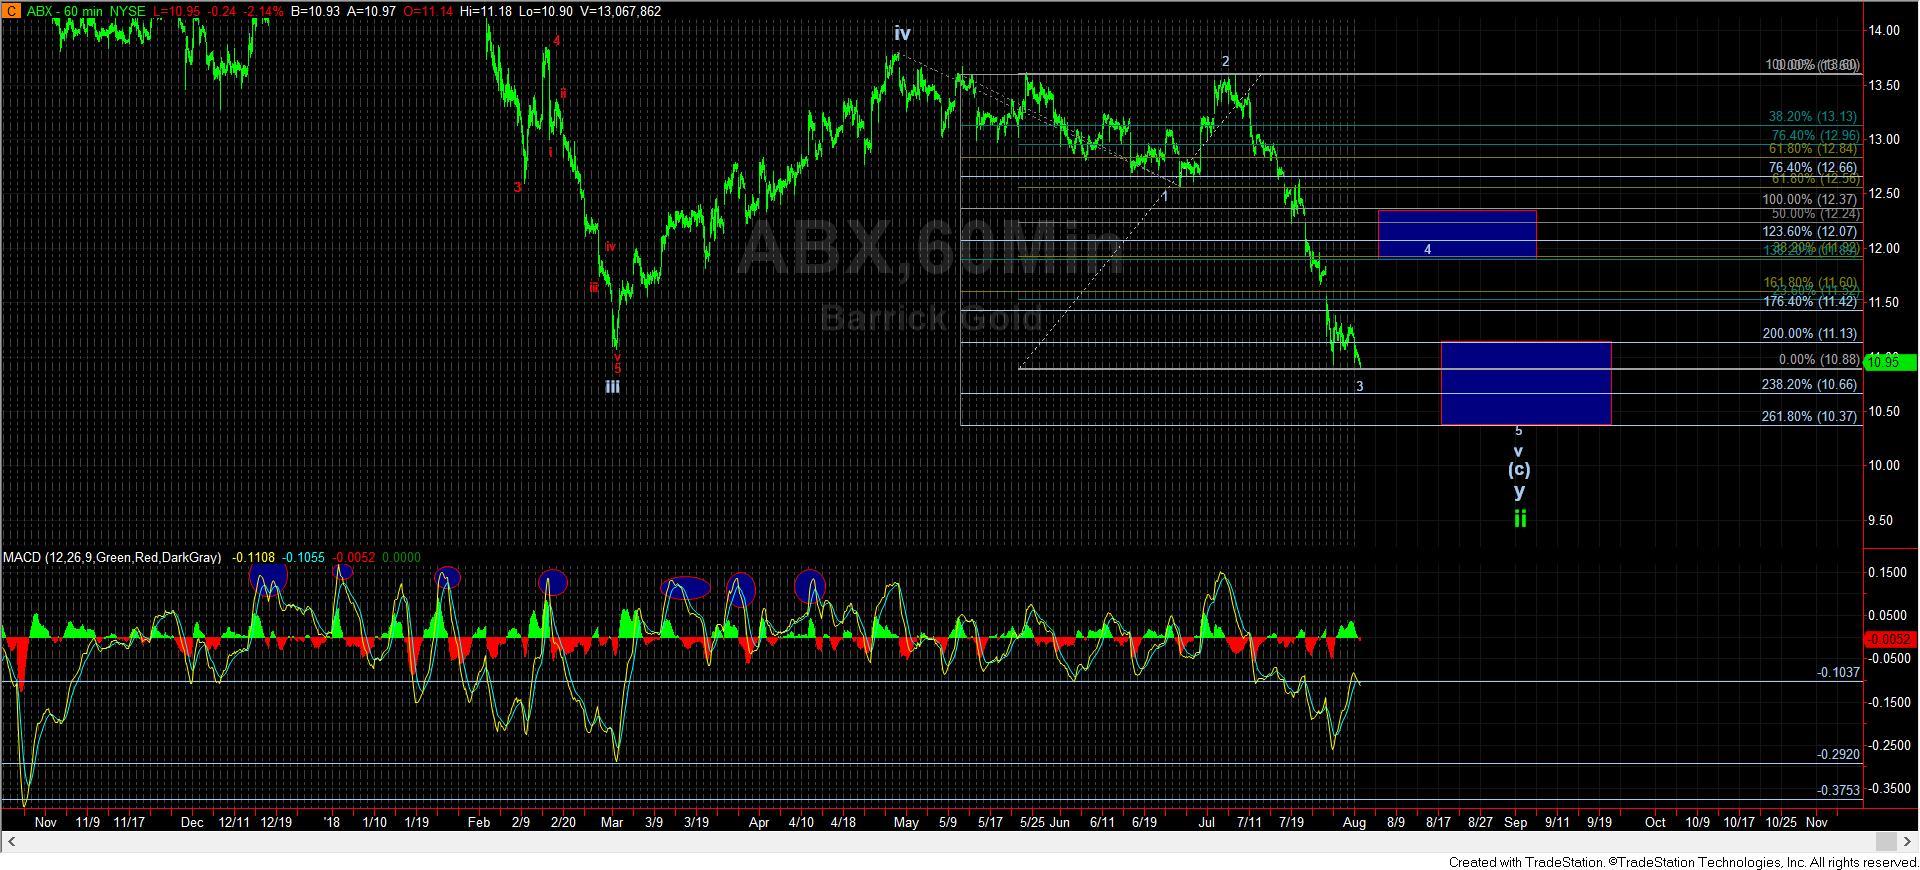
However, from a technical perspective, I have no clear indications that the low has been struck. So, nothing has changed from my analysis posted over the weekend. But, with many of the miners we track hitting their ideal 2nd wave retracement targets, with some still needing a bit more until they get struck, it seems as though we are replaying the last quarter of 2015. That means that we may be close, but we can still see an additional 4-5 before we finally bottom out, as presented on the 60-minute ABX chart. It also means that if the market is going to bottom before that happens, it will have to prove it to me with an impulsive rally through resistance I noted over the weekend.