Relief Bounce Faces Resistance
 By
Ricky Wen
By
Ricky Wen
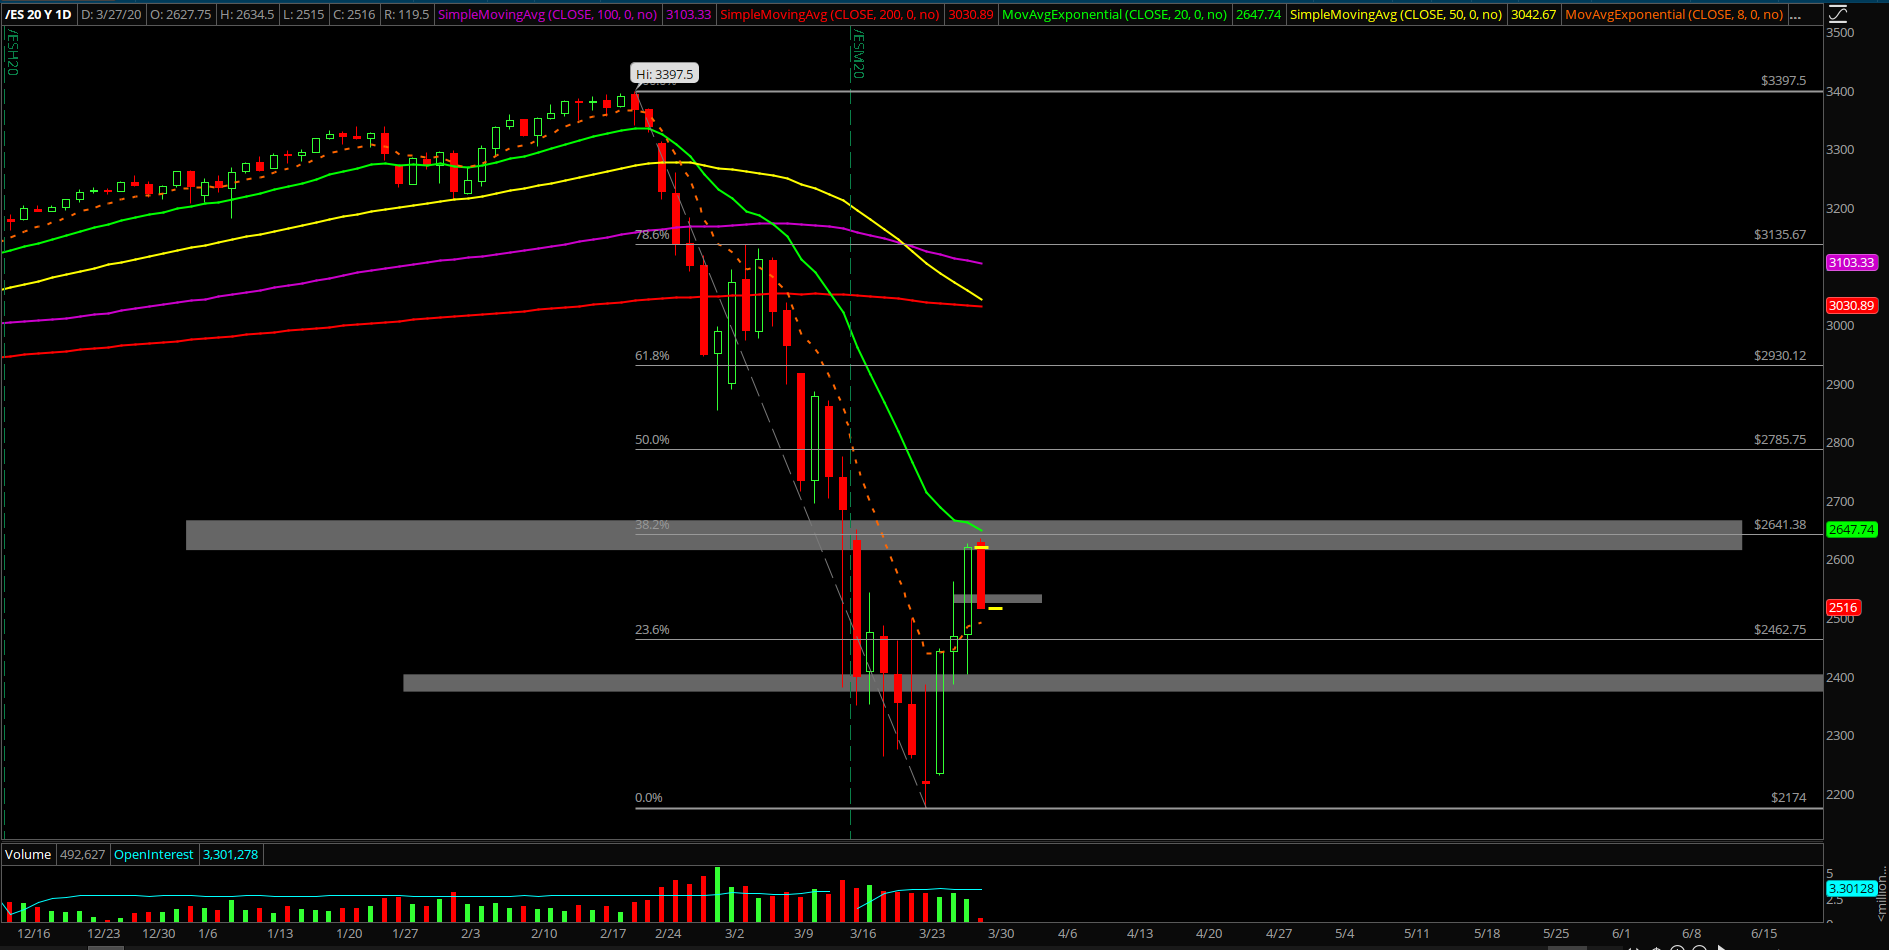
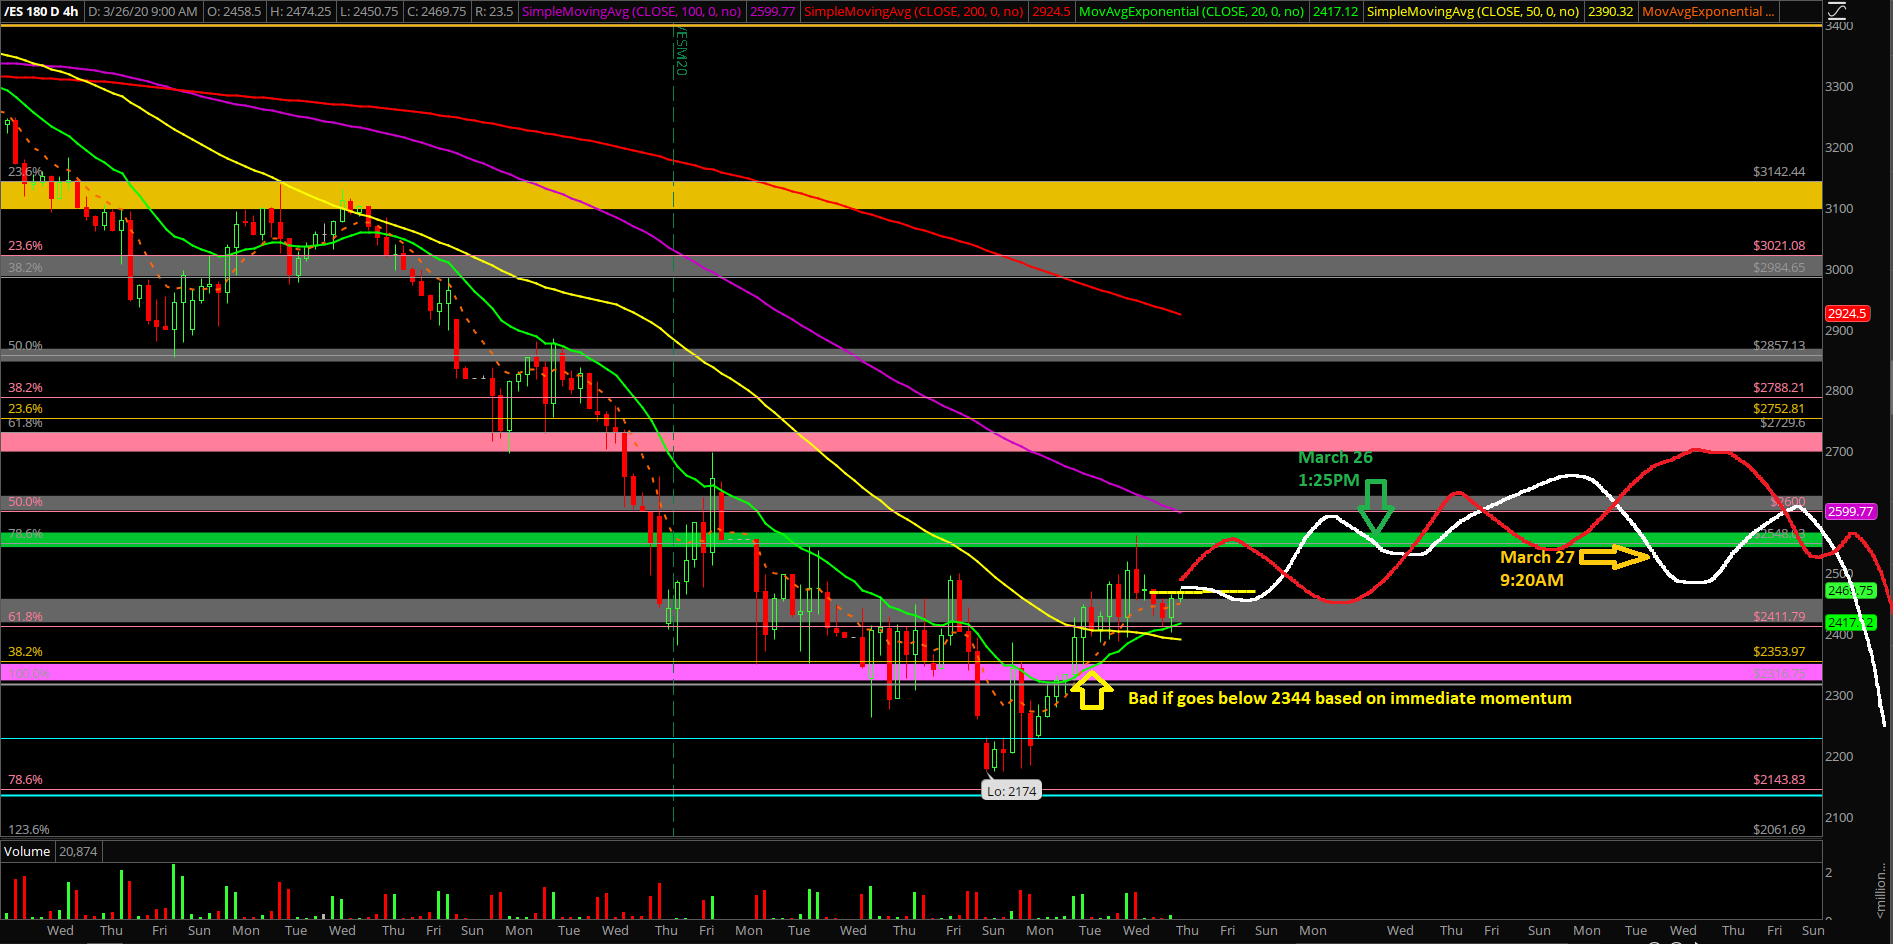
Thursday’s session showcased the continuation of our multi-day relief bounce setup as price action geared towards the 2650 range high target on the Emini S&P 500 (ES). It played out as the third day of the relief bounce, and, if you recall, day 3-4 is usually where markets tend to turn and these odds could be enhanced when you pair it with a confluence of resistances around the 2650 area, with the 2700 level being the maximum extension allowable.
The main takeaway remains the same with the ongoing thesis. Price action went from 2174 to the range high 2500 in a span of 48 hours and then that upgraded the overall range to become 2174-2650.
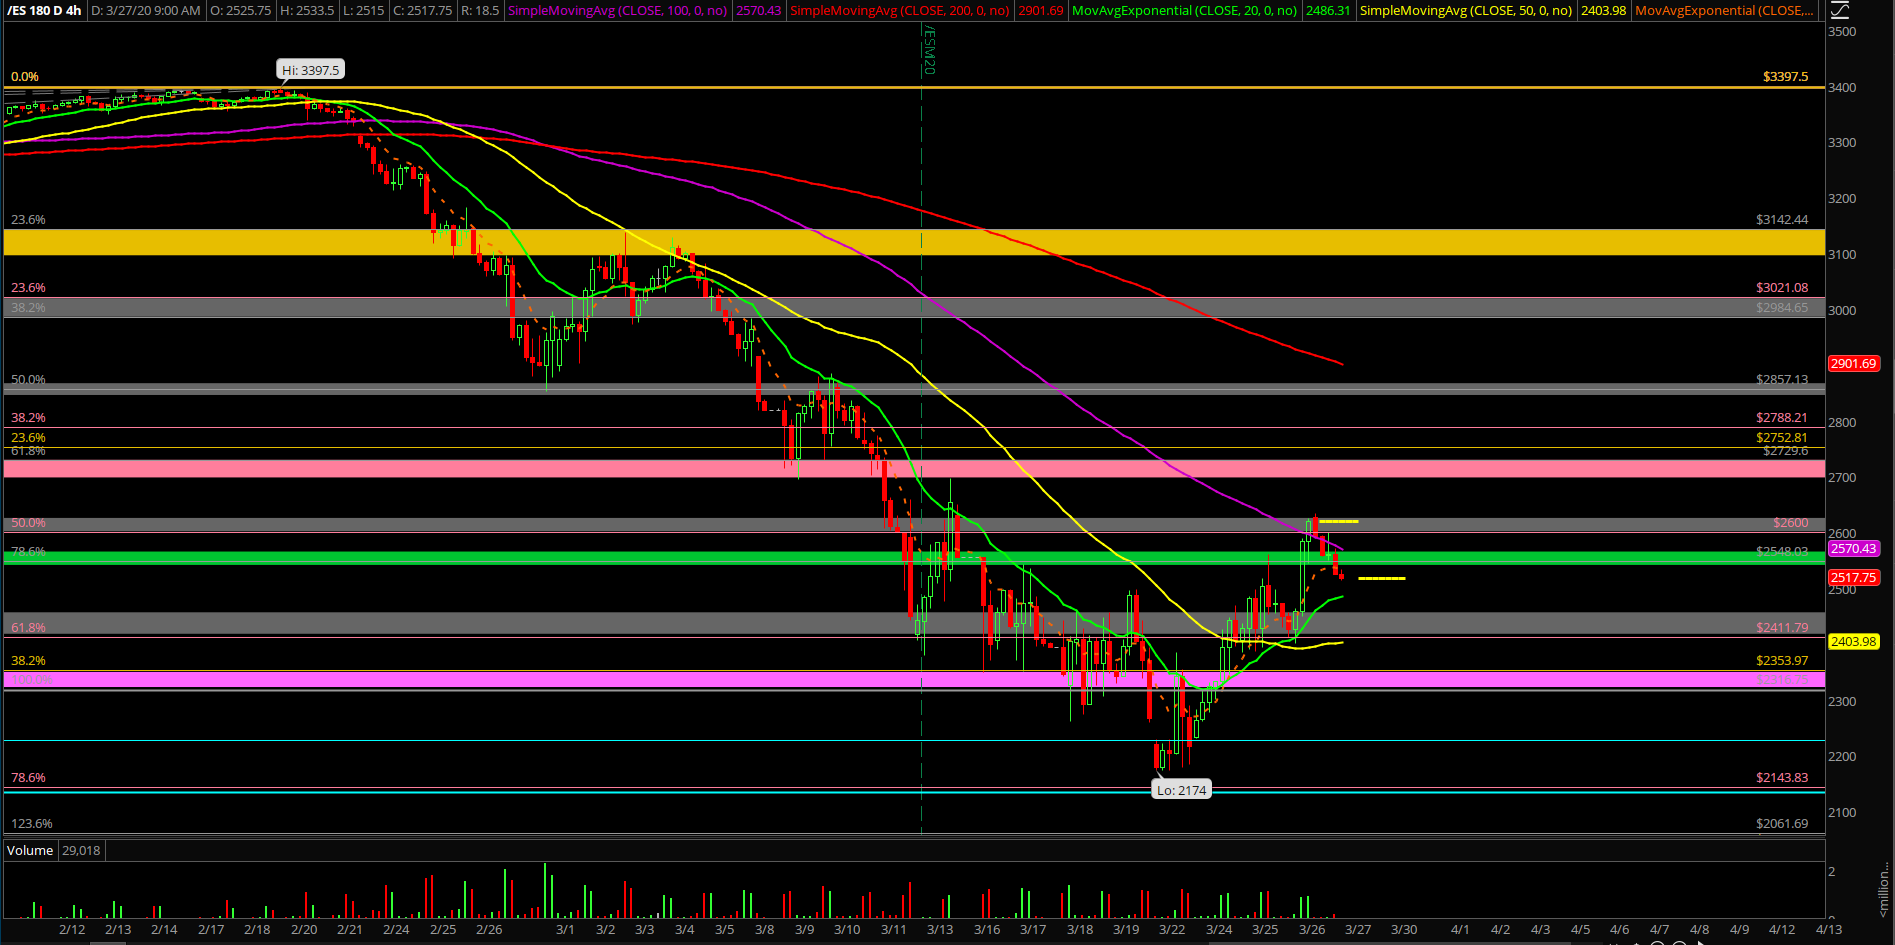
Now, the real question is whether 2174 will go from a temporary bottom to a more concrete bottom once we have a pullback into support to tell us the reaction. Thus far, overnight has topped at 2634.5 and starting the southbound turnaround as we’ve been tracking with our beloved 4hr white line projection. Basically, price went from a range low to range high and is now waiting for some digestion to go back into midpoint of the range and then near range low.
What’s next?
Thursday closed at 2619.25 around the dead highs of the session and into the daily 20EMA/2650 confluence area. The clock works right now and it’s a very cleanly defined battleground here as we head into today’s weekly closing print.
Game-plan highlights:
- Look for a lower high/double top setup in the 2600s area to ride southbound
- If cannot form the bearish setup, then 2650/2700 max remains possible for the turnaround
- First concrete indications that things have topped would be a break below 2475/2411 key levels
- 4hr white line projection remains valid for now as we navigate this range in real-time
- Once a high has been established, pullback targets are 2411/2344/2220, level by level approach
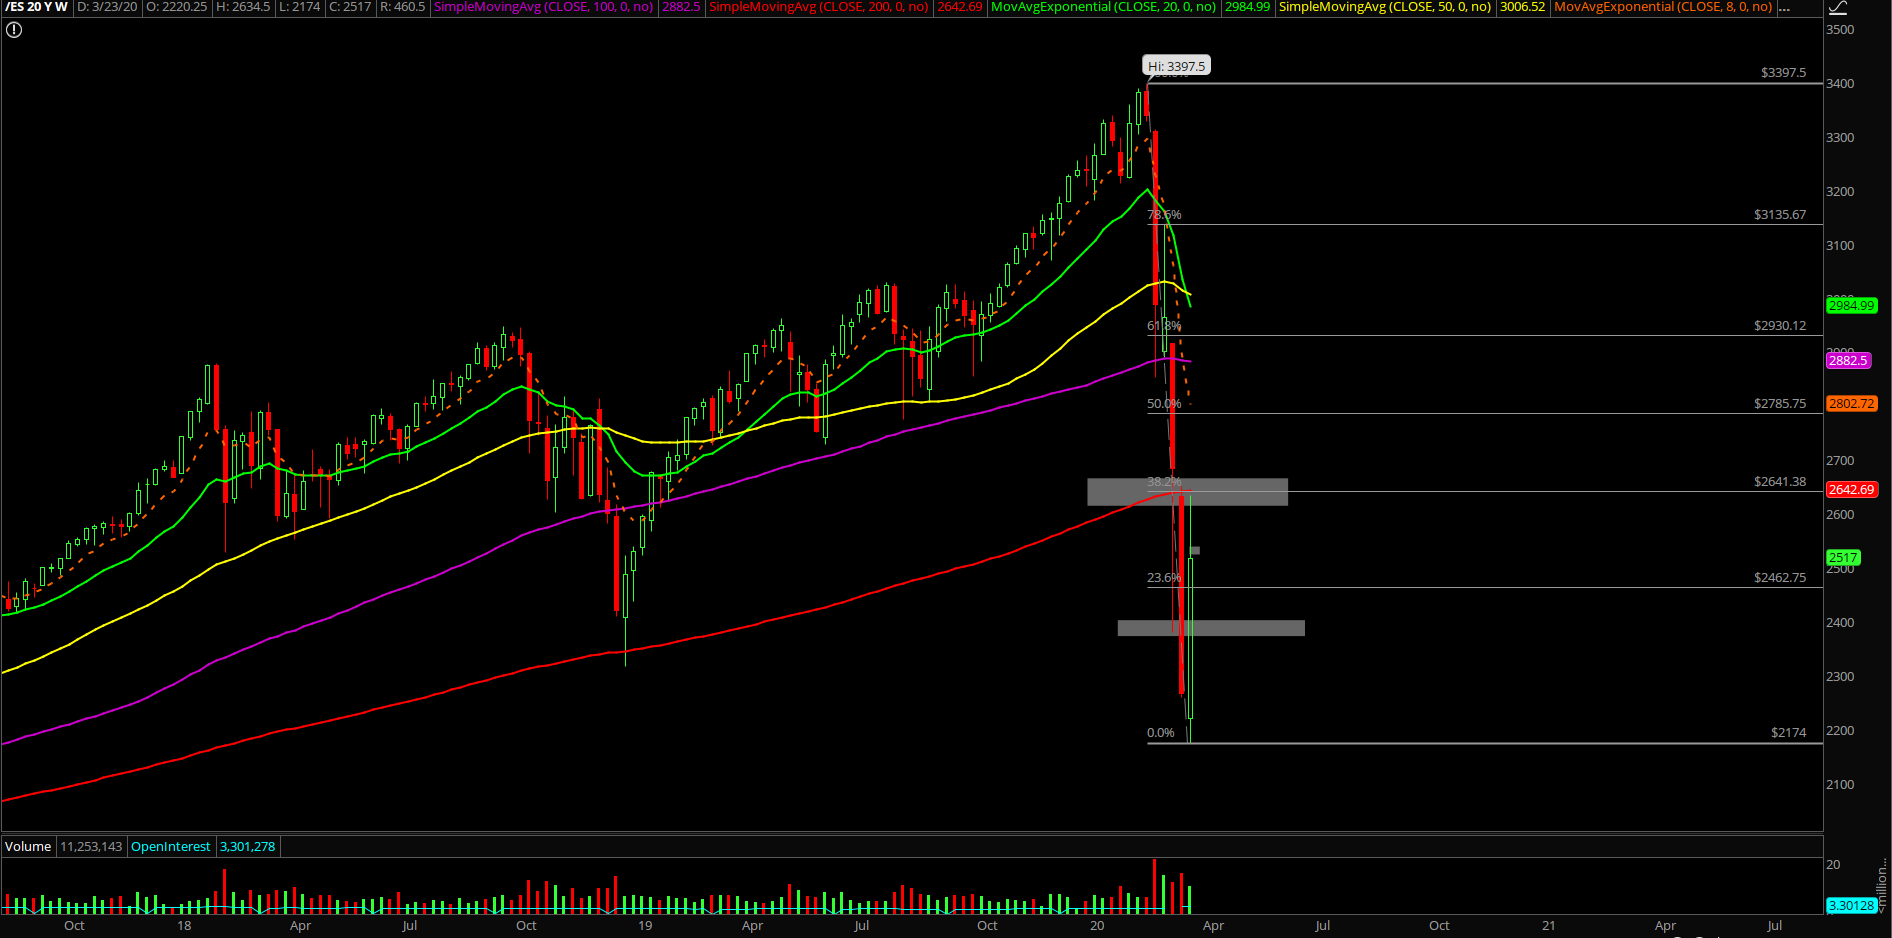
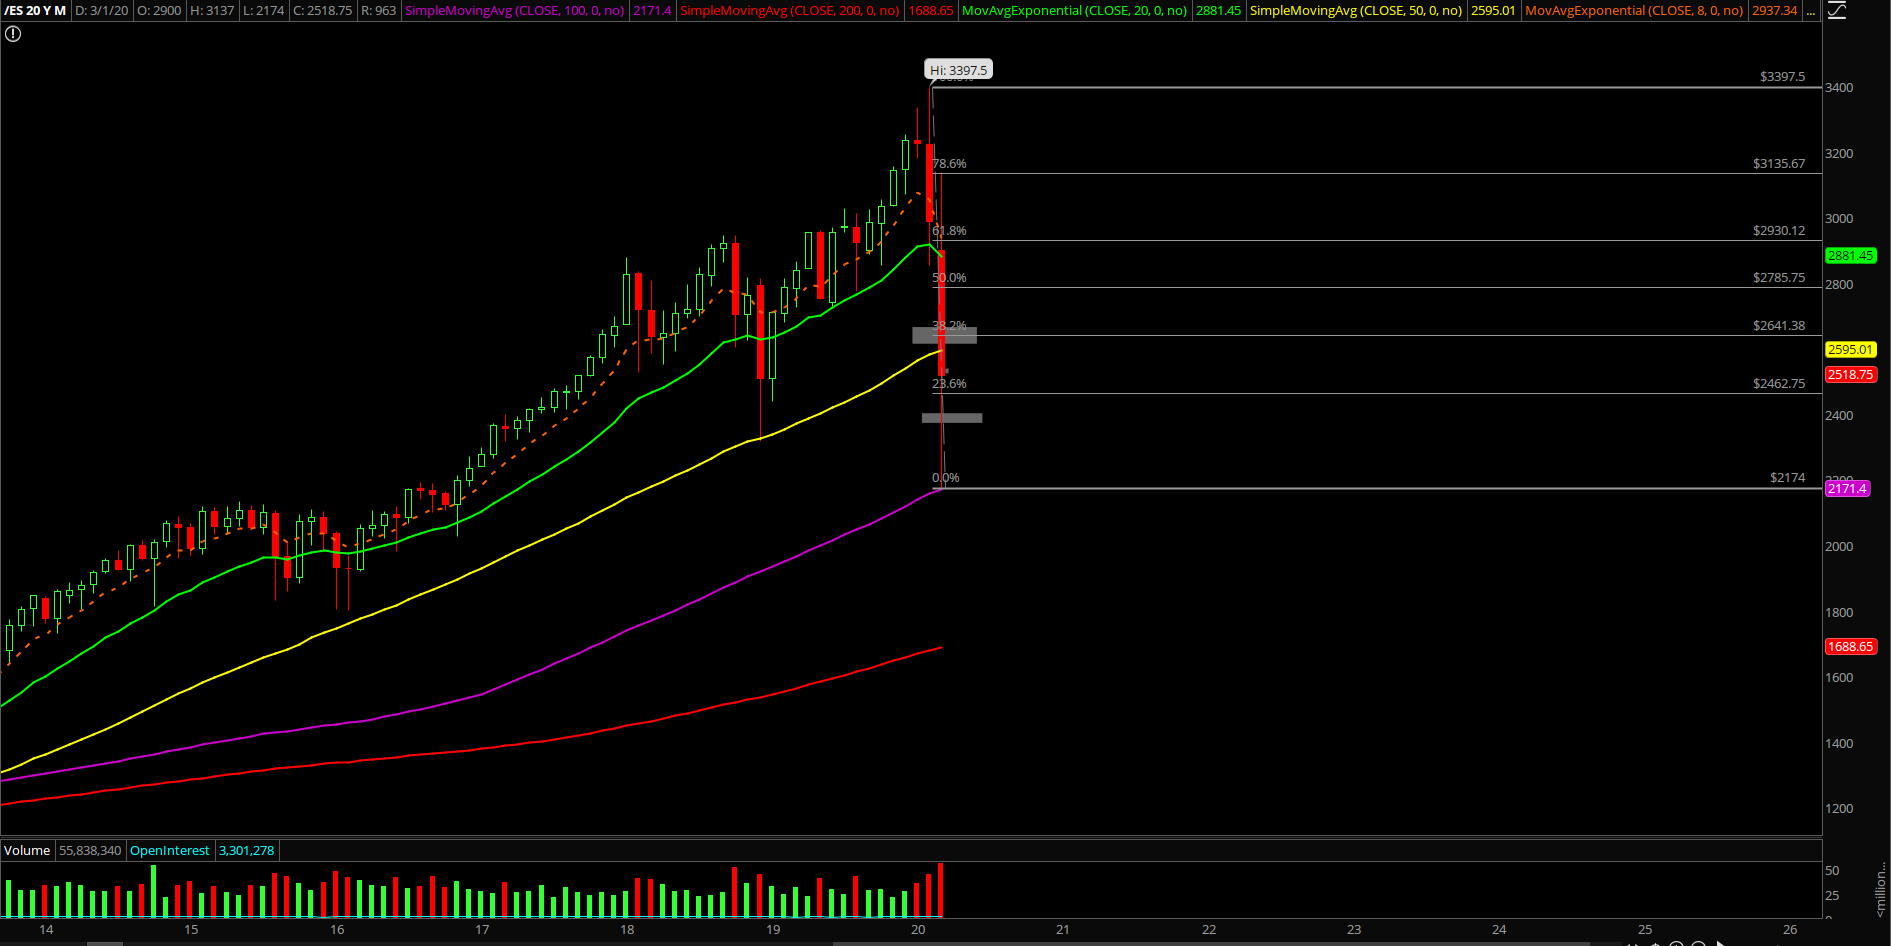
- Zooming out, continue to watch daily closing prints 2316.75 vs 2650 battleground given the current situation of the market backtest against the Dec 2018 lows and the Sunday night high (March 20+23 closed below 2316.75, March 24, 25th, 26th closed back above 2316.75…confirming the temporary bottom setup in development)
- Dec 2018 lows to Feb 2020 highs range: 61.8% fib = 2729, 78.6% = 2548, 100% = 2316.75
- Feb 2016 lows to Feb 2020 highs range: 50% fib = 2600, 61.8% = 2411, 78.6% fib = 2143, 100% = 1802.50
- There’s some real panic in the global markets and it is greatly appreciated because we’ve been lacking that extra juice in the first week of March as it was relatively easy or a bit too calm like we demonstrated in real-time
- We’ve been fully prepared with lots of cash on hand to re-deploy into long term investment accounts in case the shit hits the fan and It looks like we may get our wish for fire sales across the globe
- If you are in the same age bracket as us in like 20s, then, you have the next 30-50 years for dollar cost average for these plan B long term investment accounts. When the sh*t hits the fan you get a better long term average that will be worth millions
- We are down to about 67.5% cash leftover and looking to deploy more as market hits near our support levels. The bigger the drop, the better for our long-term average cost as the market has been giving us a great discount since the breakage of the daily 20EMA trend that occurred in late February.