Regarding Correlation and Correlating
 By
Ryan Wilday
By
Ryan Wilday
The EWT team follows an ‘each chart its own’ approach to analysis which I want to expound on. I also hope this article has a life of service as questions of correlation come up on the board. As we all know, those questions will never dissipate.
Often discussions regarding correlation start with a question such as:
‘In view of Avi looking down in Bitcoin, what is your outlook?.
And, this question comes despite having already given my outlook. In this situation, I can only surmise that the inquirer expects the SPX to take Bitcoin by the reins, assuming correlation equals causation.
I know this question arises because over the last few years we’ve had liquidity events that brought many risk-on assets to a correlation of one (maximum correlation). In such events, riskier assets are sold to cover margin calls. And, the Dollar index flies because there is a run on dollars to pay debts. This can happen in demonstrable events like March 12, 2020, or small intraday moments of crisis.
I have also seen some sparse evidence of intraday correlation in SPX and Bitcoin as I trade the e-mini futures, SPX options, and Bitcoin intraday. It is likely driven by algos. But I can say with certainty that correlation comes and goes like the wind.
Now, I must diverge here to first level set how I trade, and therefore analyze markets. It is not enough to say whether an asset is going to go up or down. Since any trade involves risk my goal in any trade is to ascertain the risk involved, generally by determining support levels. Further, I ascertain the target or profit potential. By trading as close to support as possible, and as far as I can from the target, I produce high risk to reward trades. And by doing so, I care much less about win rate than the variance or skew between the measured risk of the trade and the potential reward. If your typical winning wins three units of reward for every unit of risk, you can lose 60% of your trades and still be long term profitable.
Further, I do this on multiple timeframes. So, I may find the risk reward of short in one timeframe being advantageous while I’m long in another timeframe. This is why levels are so important. And the levels I use cannot be determined by looking at another chart.
When I was an early member at EWT, I was so amazed by Avi’s ability to call the SPX that I quickly blew up an account trading the e-mini. I had to learn to risk management using those blue boxes.
Many subscribers have blown themselves up or left the crypto service because they only want buy here, sell here, up, and down analysis. You know I spend a lot of time trying to unwind that concept so each of you become more strategic in your thinking. And, I try to teach you to extract a return at low risk, so you can run the marathon despite losing a few sprints.
Further, I do not completely ignore correlation completely in investing. In a webinar many months back I talked about how I have built up a portfolio of slow yielding assets. As a trader of high beta crypto, futures, and options, I need to have a base of slow returning assets that I can go to in emergencies and to pull from in big opportunities like March 12th, 2020. Those assets, tend to be less correlated to the ‘risk-on’ assets in my trading accounts.
But beyond that macro design of my long-term and trading balances, correlation is useless given that I trade the specific levels revealed by the chart I am trading. I cannot determine those levels that are key for trading, such as in a Bitcoin mining stock, while staring at a chart of the SPX.
But let’s imagine all this above is ‘hot air’, and you are determined to create a robust strategy for trading correlations. I’m going to walk through how I would go about doing that. Let’s use the SPX and Bitcoin example.
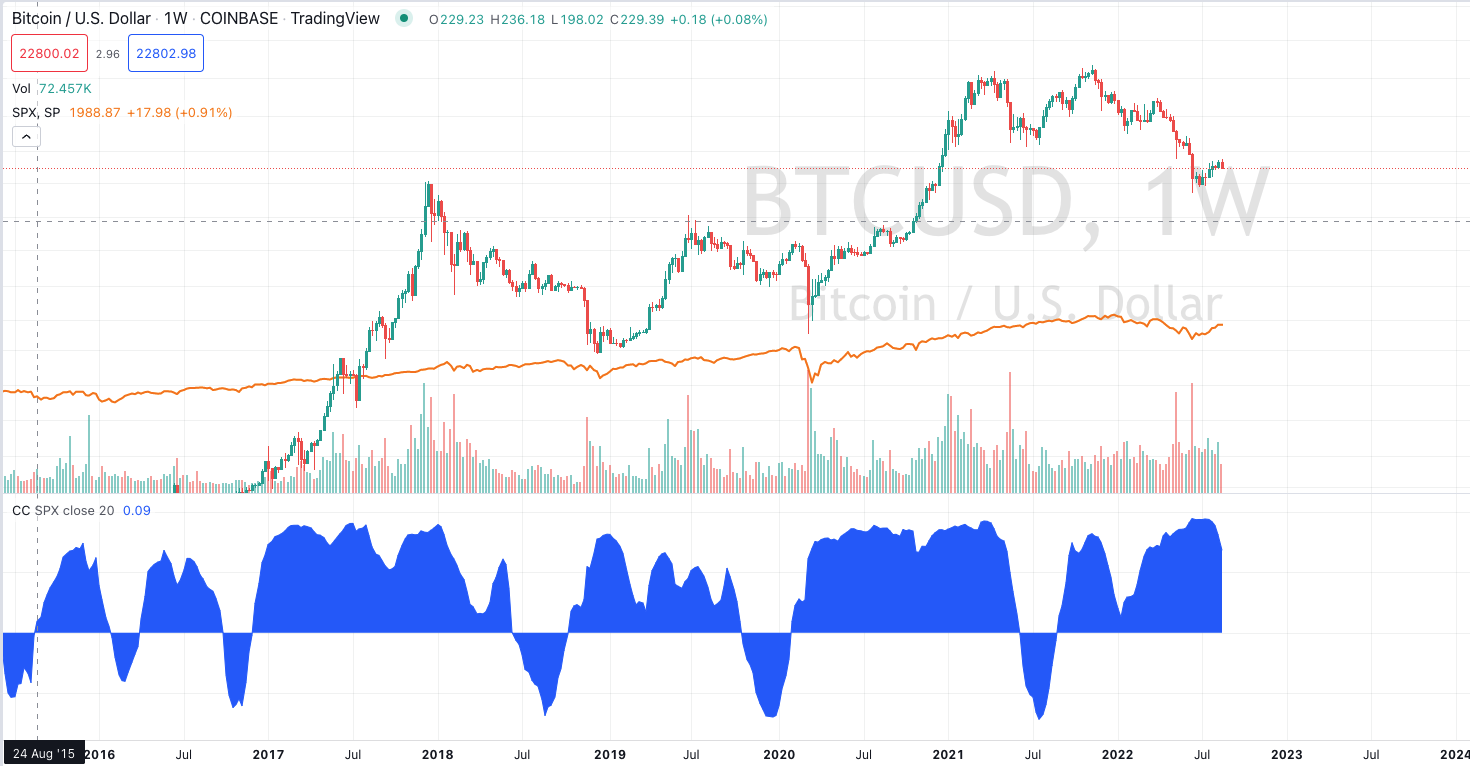
First the big thesis is that the SPX and Bitcoin are highly correlated. In the above chart, Bitcoin and SPX are overlaid and the correlation coefficient is on the lower panel. I see a couple of observations:
There is significant periods of correlation with significant periods of inverse correlation.
Those periods of high correlation don’t necessarily happen when they are both going up or down. And the times when they start to inversely correlate also says nothing about the direction of each market.
Given the above, to develop a reliable strategy for trading correlation you would need a signal that says when they are going to swing in and out of correlation. And, you would need a signal to suggest which one was ‘lying’ when they started to go inversely correlated.
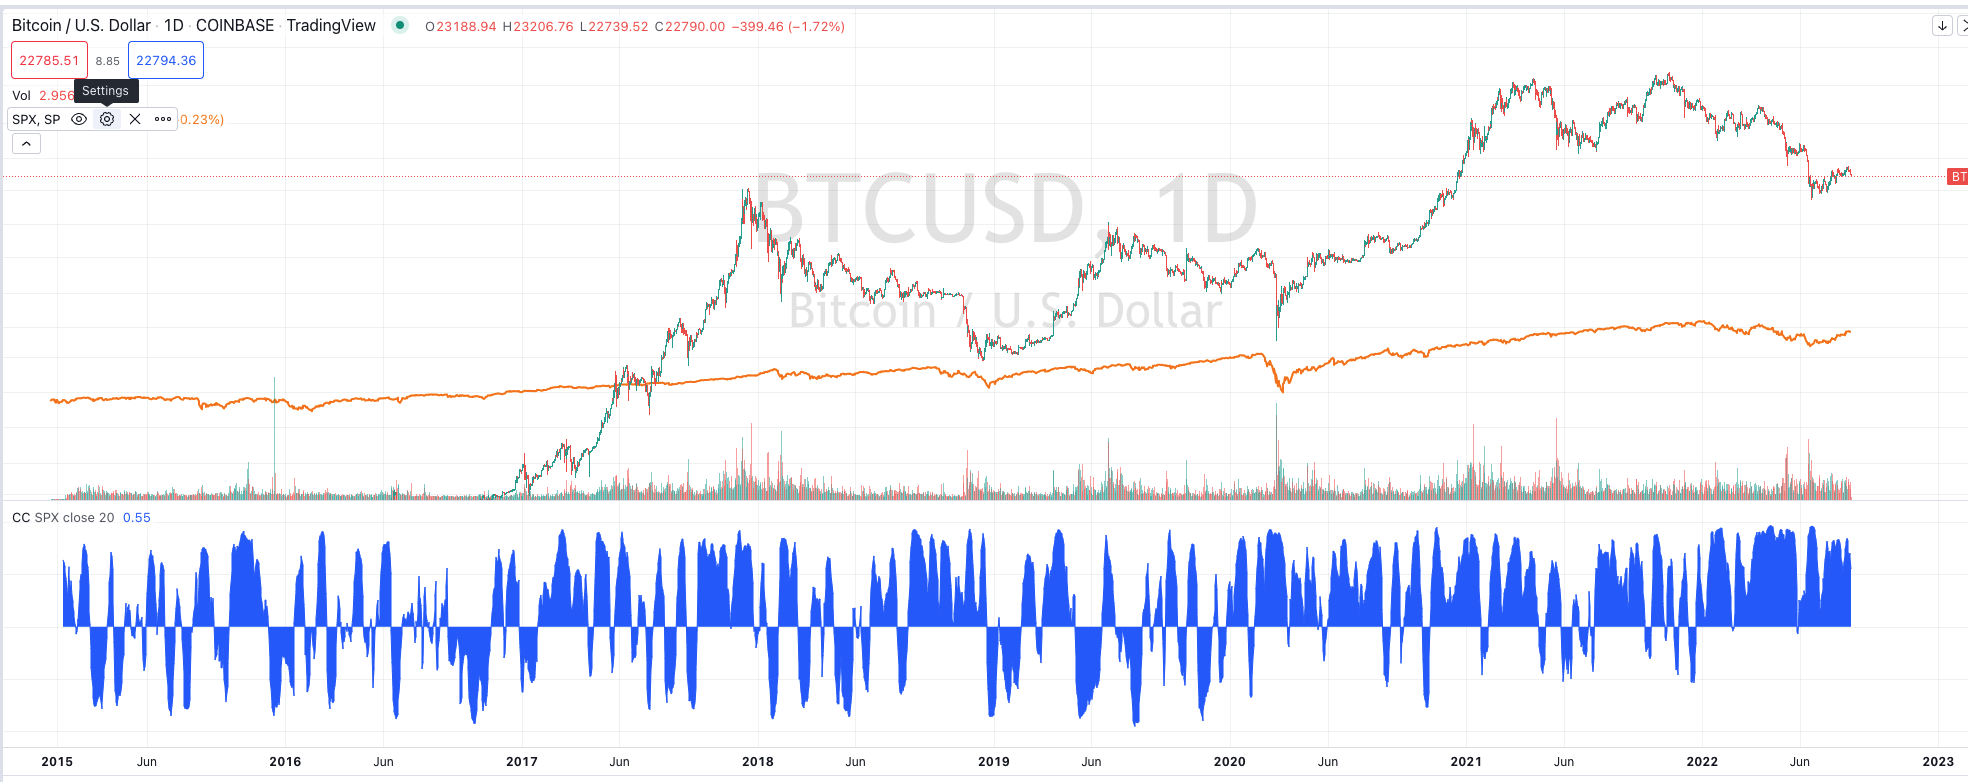
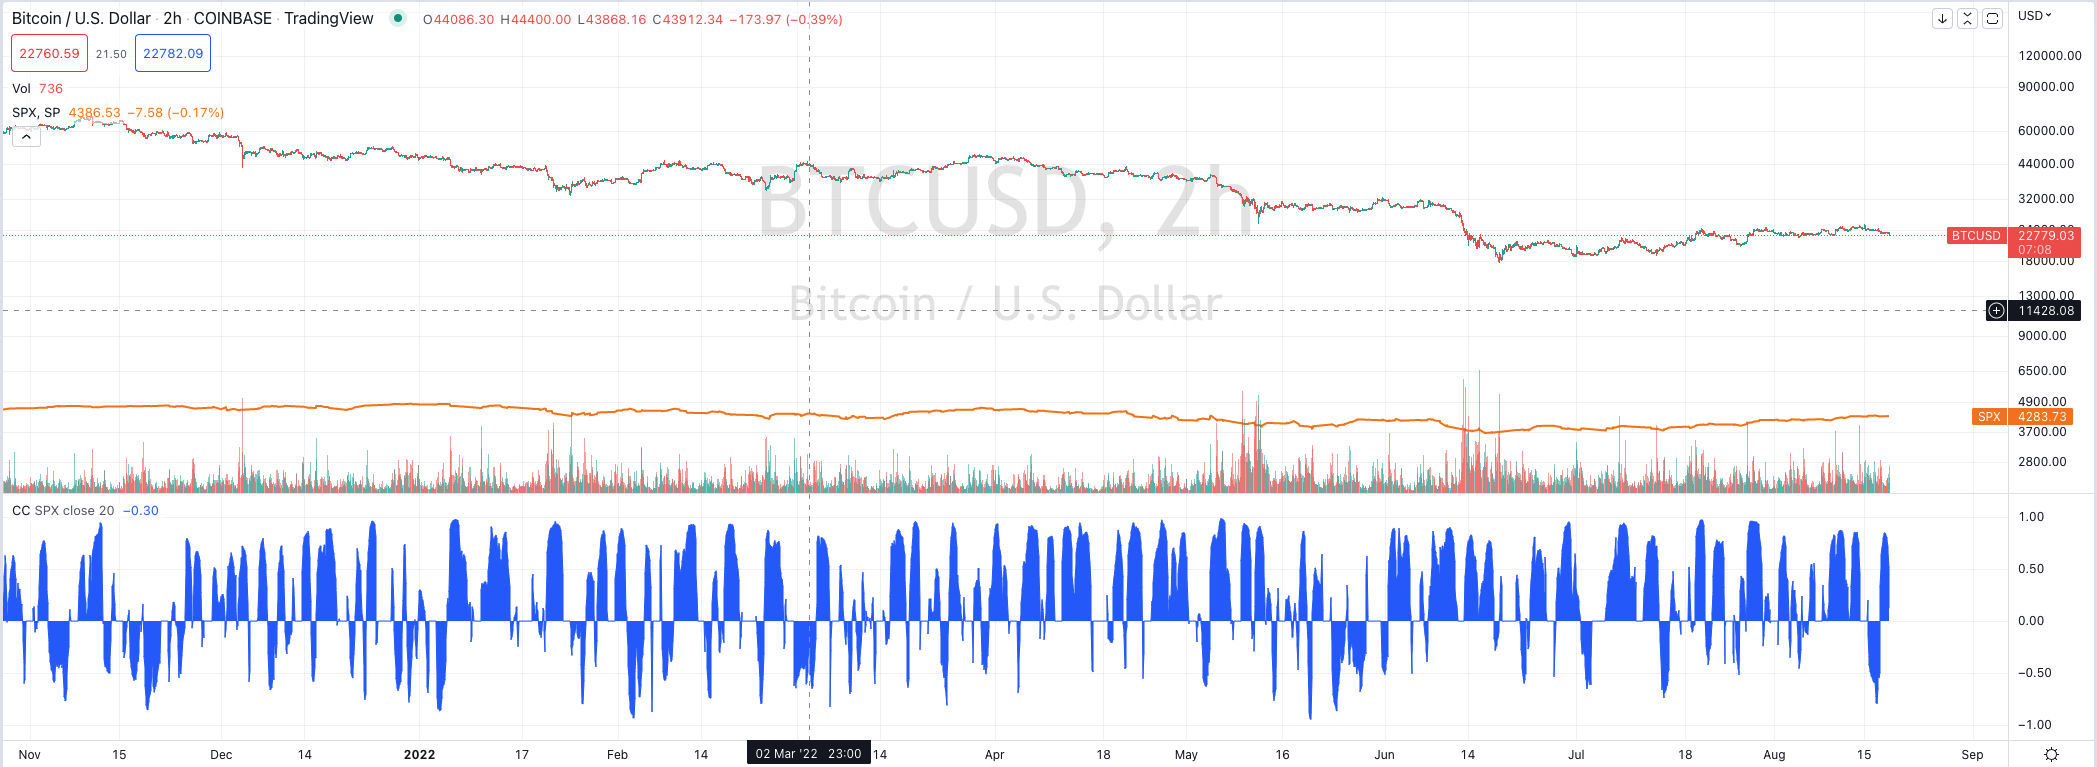
The above chart is a weekly chart. Now let’s move to look at the correlation on the daily and 2H. As you can see the swings between correlated and negatively correlated swing more rapidly. So the same two signaling questions must be answered, but now on a more rapid basis.
There is another challenge one faces in attempting to trade correlation, and that is one of degree. If the SPX is crashing, even if we know that Bitcoin is going to correlate we don’t know if it is going to crash or just spill. The same occurs in rallies. In the weekly chart above we can see many times where they were correlated in upward movements but one was very tempered compared to the other. Knowing the degree of correlation requires a future prediction and one that correlating won’t produce.
In my view, these requirements for trading correlation strategically involve serious mental gymnastics. And, if a reliable means to trading such correlations can be devised, It appears to me it must be done with machine learning. Or, at least it involves developing several theories for signaling, determining degree, then backtesting, and testing forward. So, you can imagine the headache I get when I get the simple question that starts this debate:
‘In view of Avi looking down in Bitcoin, what is your outlook?.
To many, this question seems simple, but unfortunately, it is far too simplistic given the rigor required just to begin to answer that question. And, even if I was to go through that rigor, there may be no answer on the end of that exploration.
I much prefer the simplicity of trading against levels determined by the chart I am trading, through the use of the Elliott Wave theory. Using those levels for measuring risk, minimizing it, and maximizing reward potential have served me well since I started learning to practice the approach with some skill. Or, I appreciate the algorithmic methods I trade which are built far more simply, sometimes with machine learning, than the complexity involved in correlation. And, finally, I appreciate the simplicity of just focusing on the chart I am trading, without being paranoid about what another chart is doing.
To summarize:
1. Correlation happens, but it is not causative.
2. I value correlation in designing my overall asset allocation for holdings I do not trade, mainly to determine how exposed I am in the next liquidity crisis.
3. Correlation comes and goes so there needs to be a quantified signal that says when the correlation is moving from positive to negative.
4. Correlating assets says nothing regarding the degree such moves will make, even if you can devise a signal that indicates correlation. And, if you can’t determine degree than you can’t determine an entry and exit. And those final details are required for every trade.
