Recent Pullback Considered Completed
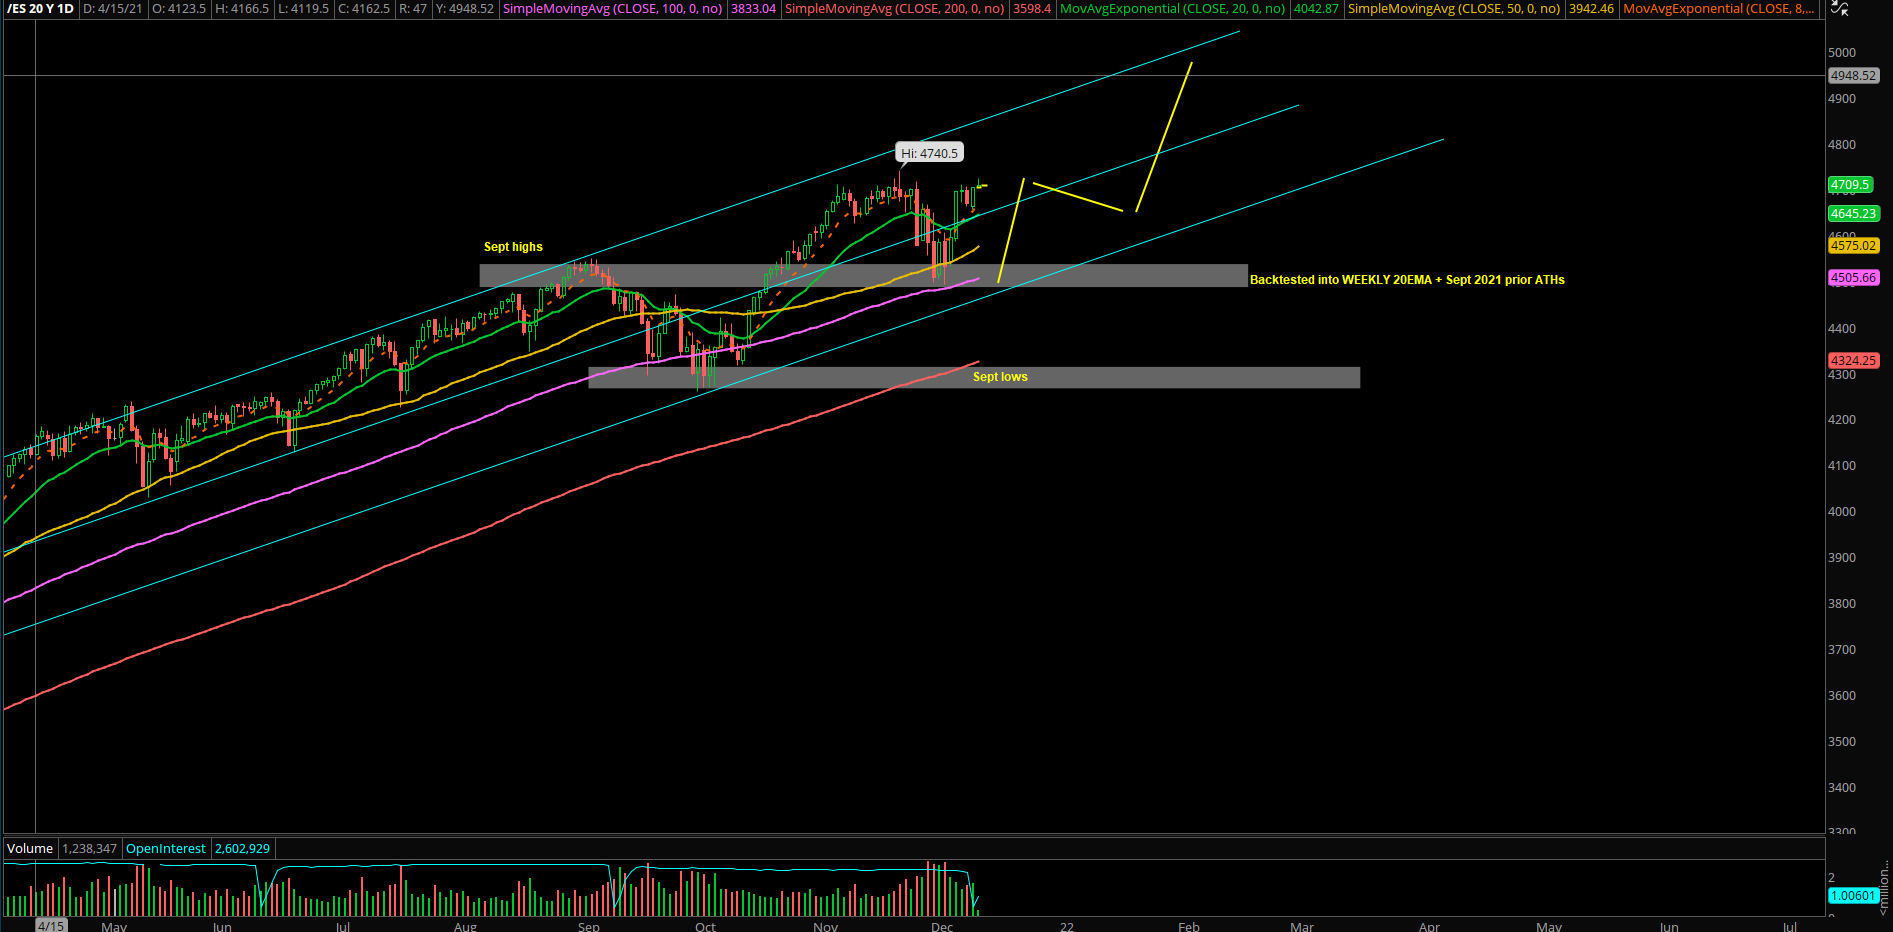
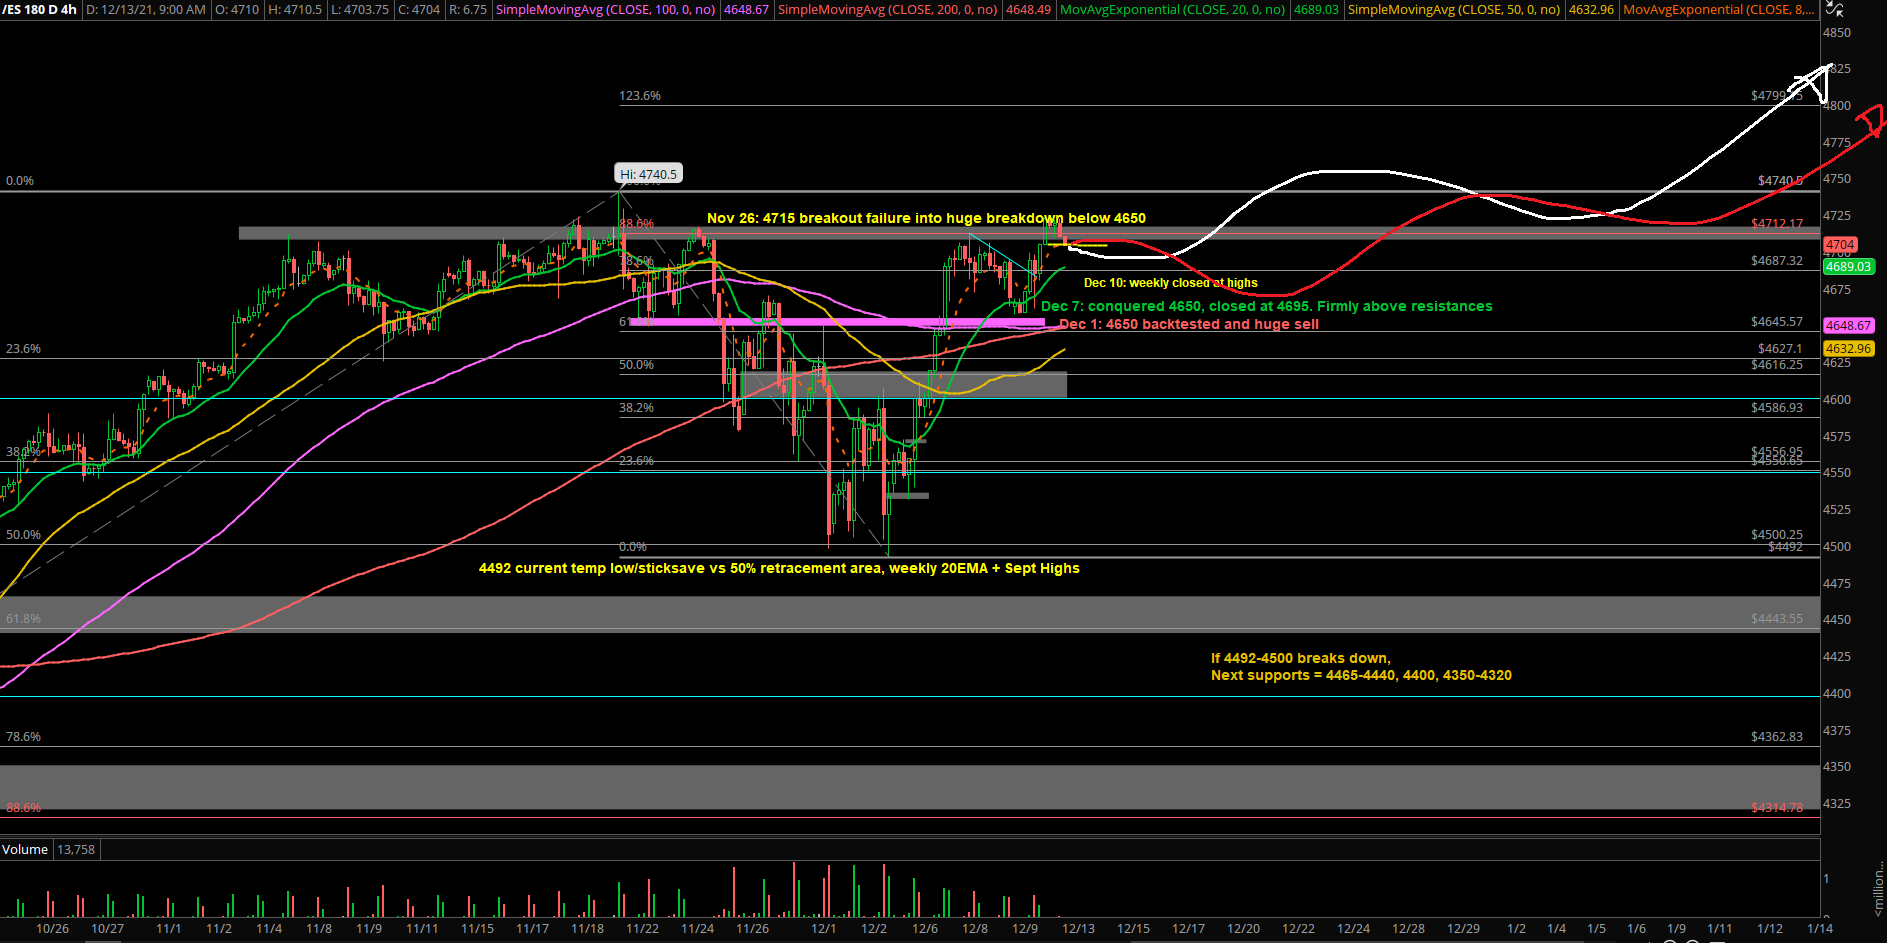
Last week, the bulls made a clear message, as price action closed back above 4600 and 4650 on the Emini S&P 500 (ES) with a firm breakout. It also did a tight bull flag breakout above 4690s-4700s, indicating continued strength.
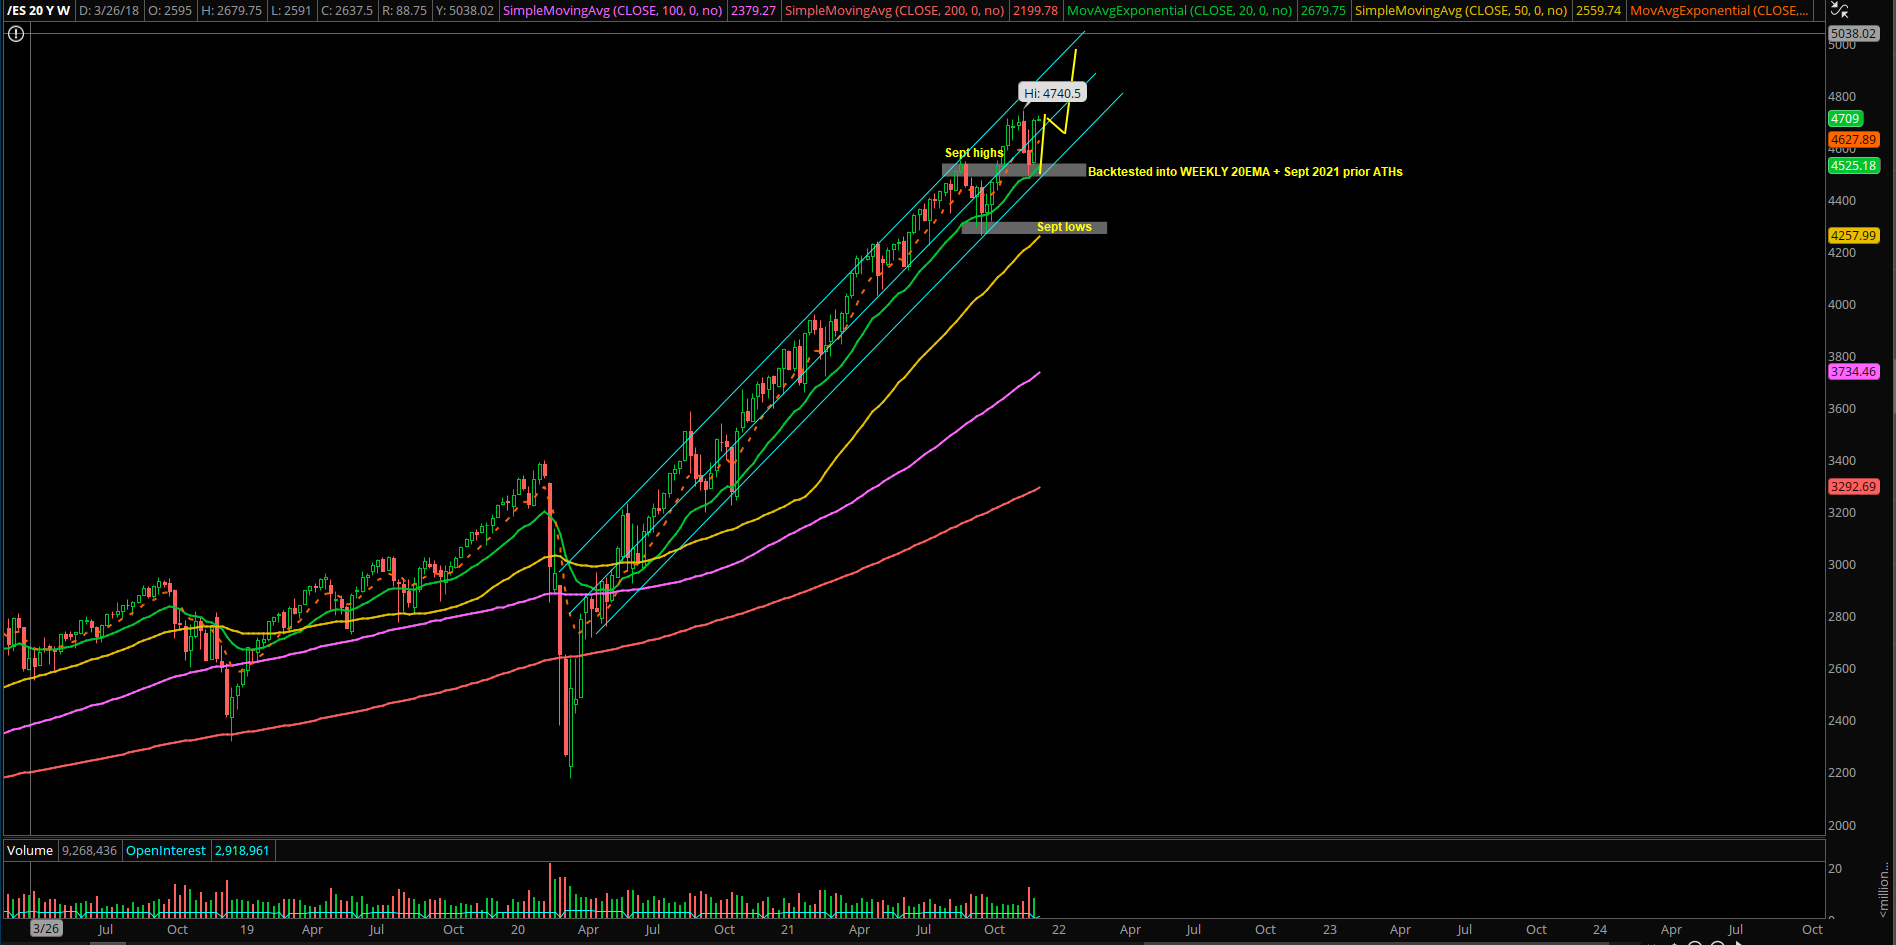
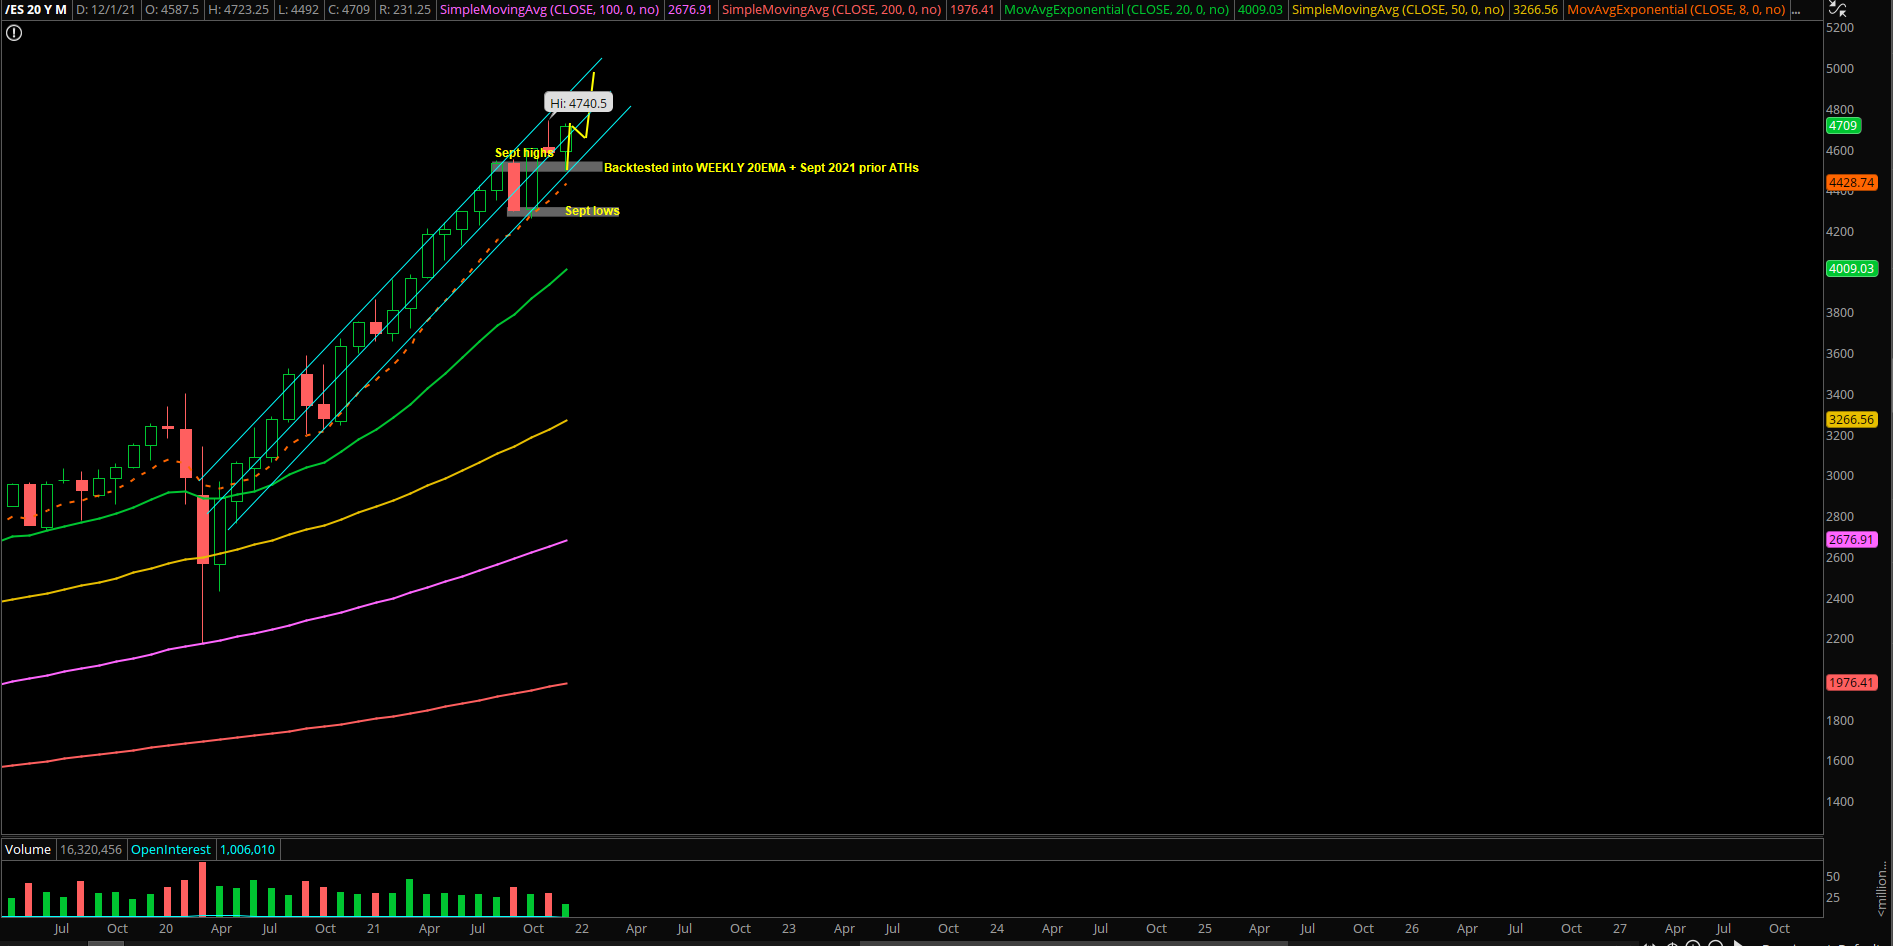
Bigger picture wise, we could effectively treat ES 4492 and NQ 15538 as tradable swing bottoms. This means that in the coming sessions, look for a higher-lows swing setup on a dip, so we could hitch a ride for ES 4800 and NQ 17000 towards year end into Q1 2022.
In simplest terms, this means that the recent 5-7% pullback in indices is considered over in ES and NQ and we’ll be looking for higher lows and higher highs until price proves us wrong (e.g., bears would need below ES 4492 and NQ 15538 to confirm more selling ahead until a real bottom occurs).
For reference, the odds of the current multi-day/week swing low increases further when/if we get multiple daily closes above ES 4650 and NQ 16300. Know your timeframes here!
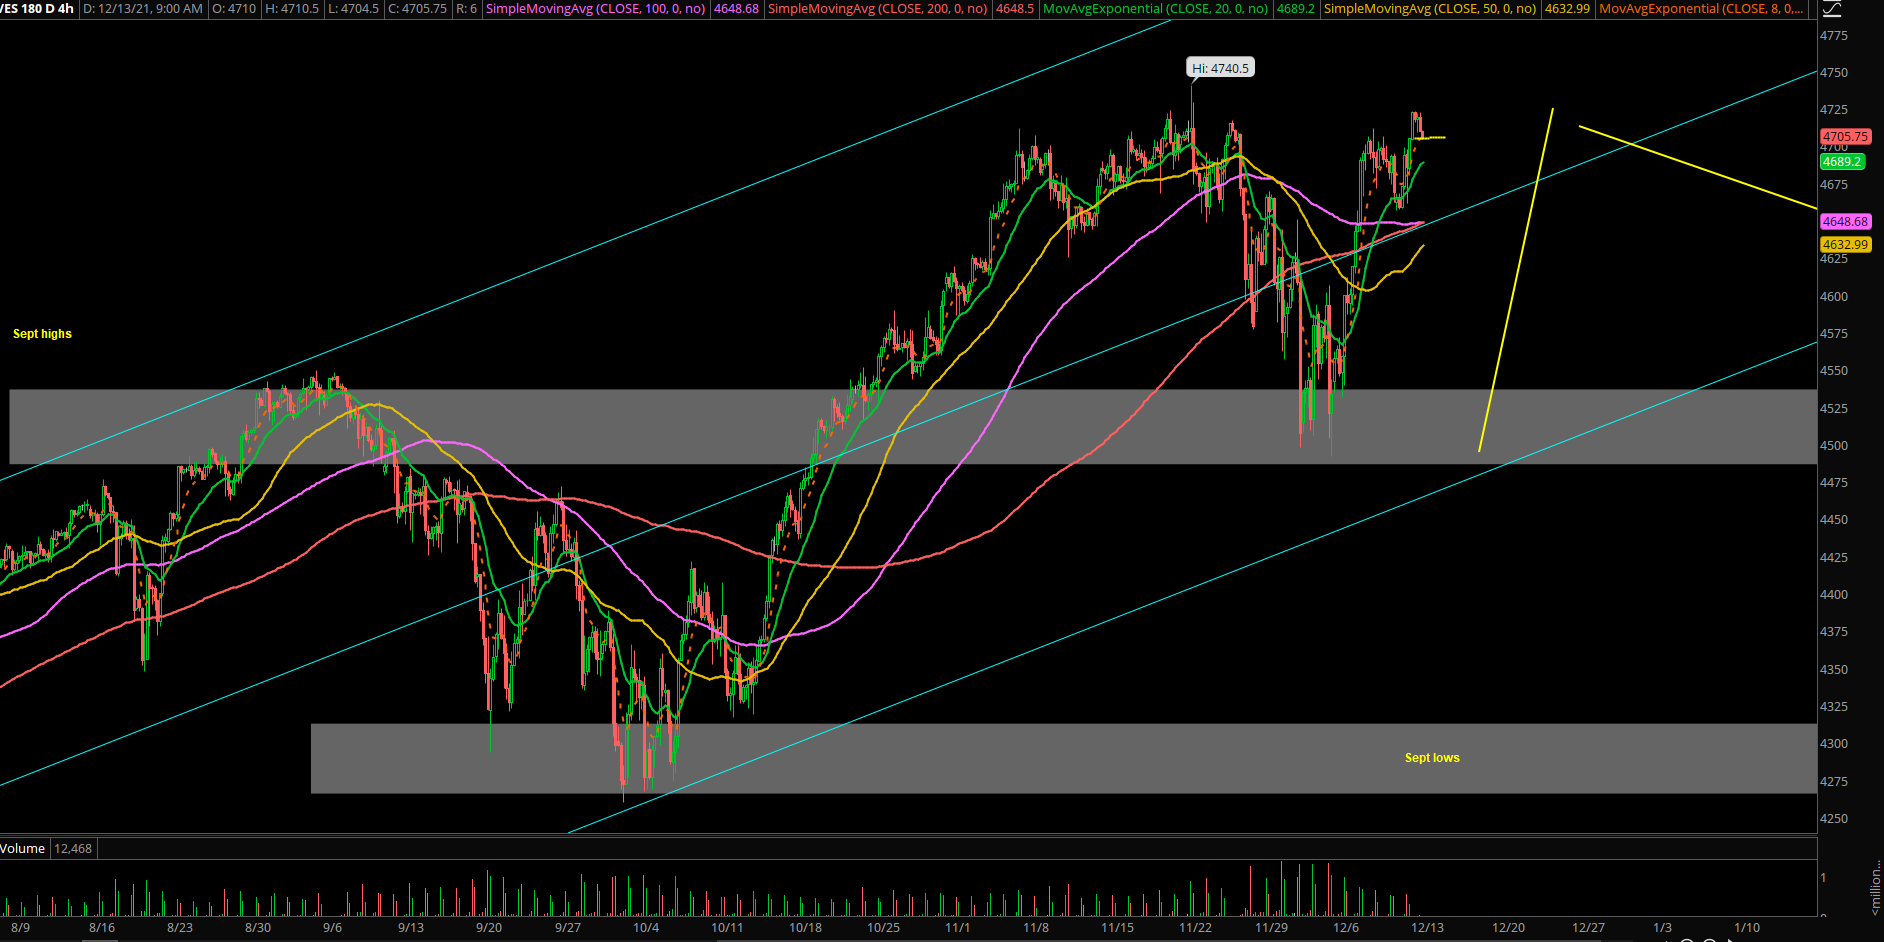
As of Monday Dec 13th morning, the overnight low was 4703, O/N high 4723 indicating continued higher lows and higher highs off of Friday’s end of week highs
Going into today/this week, utilize 4700 and 4685 as immediate key trending supports given last weekly performance of +3.6% or +4.9% from low to high
This week is mostly about how price action reacts into Wednesday FOMC catalyst and Friday quadruple witching (stock index futures, stock index options, stock options, and single stock futures expire simultaneously)
A break below 4650 would be considered another bullish breakout failure into a big sell/
For now, price action is following our 4hr white line projection until price proves otherwise (red line= alt).
Bigger picture wise, market participants need to be aware of the current bounce into ATHs area look like a lockout rally, meaning shallow dips and grind higher. This is especially true for many of the important mega-cap stocks/components of the indices displaying V or W-shape setups to new highs.

