Real World Example Of Using Fibonacci Pinball Pivots
 By
By
A REAL WORLD EXAMPLE ON USING FIBONACCI PINBALL PIVOTS
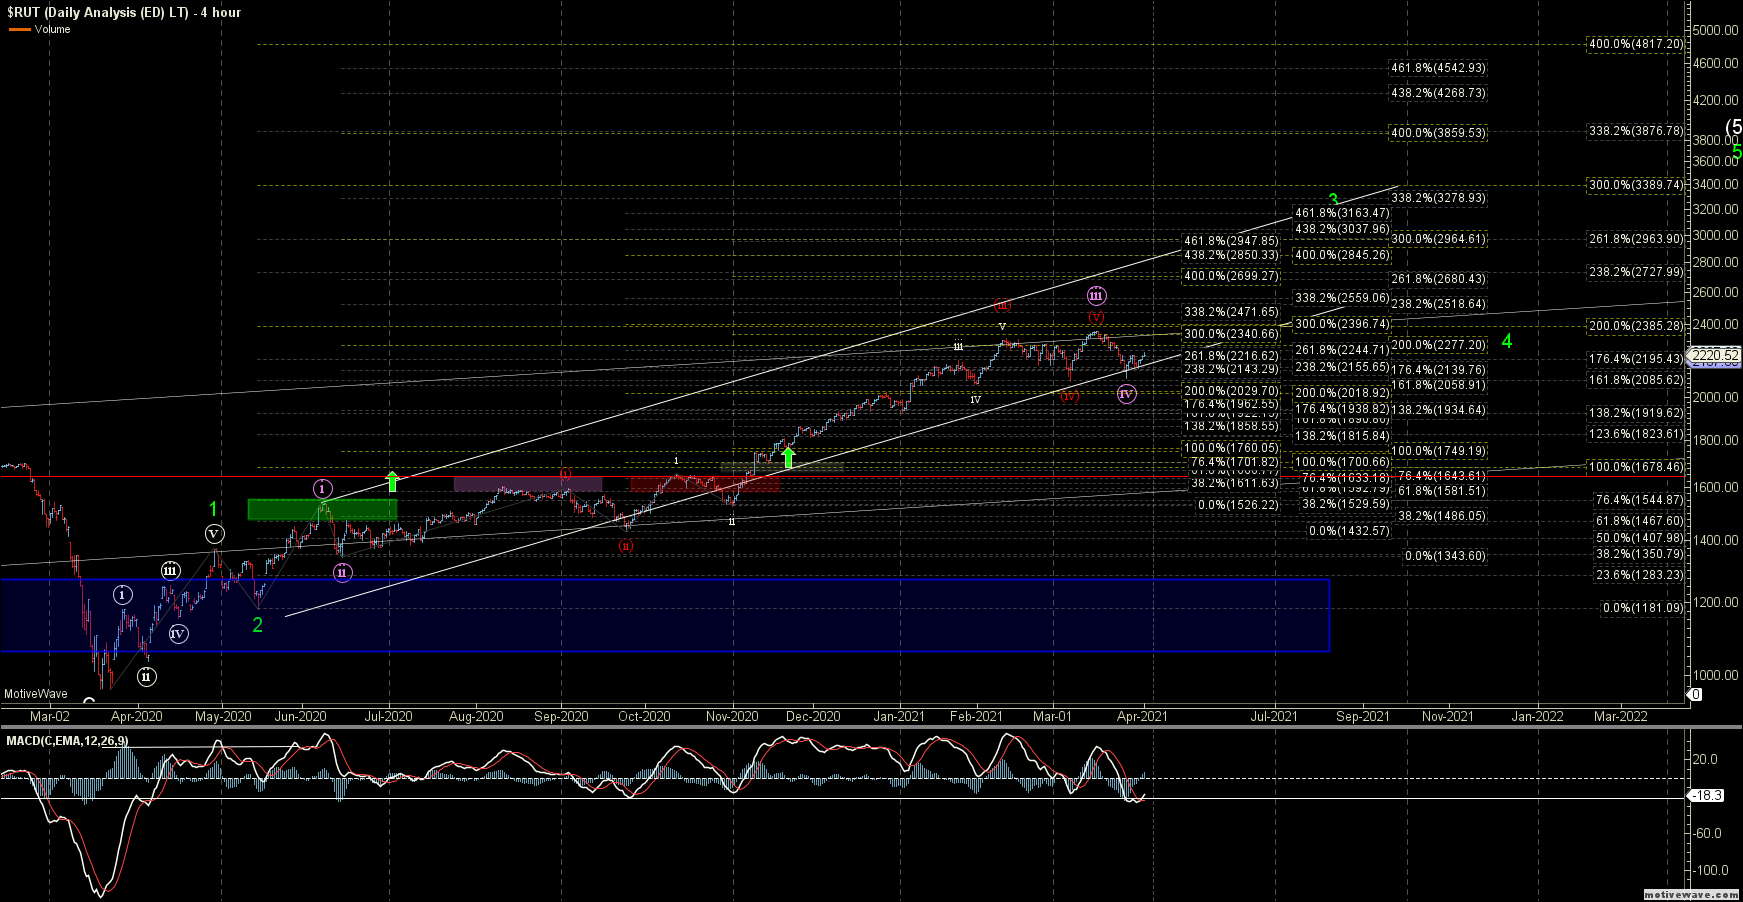
To expand on my post regarding pivots and how and why we use them in Elliott Wave and Fibonacci Pinball I want to show the RUT chart off of the March lows. As we have been noting for quite some time this pattern has been much more clear than the other indexes that we have been watching as it seems to be following a slightly different pattern and is a bit ahead of the other indexes. The clarity of the pattern off of those March lows gives us a very good real-world example of pivot levels on multiple degrees of Elliott Wave fractals. We can also see that once we clear those pivots levels is typically when we will see the strongest portion of the move occur as the pattern heads into the heart of a third wave of multiple degrees. I am using different colors on the various wave degrees here to illustrate the pivot levels for those various degrees.
Starting at the left of the screen we see that the RUT formed a wave 1-2 off of the March lows which I am showing in green. At that point, we can layout or first set of fib extensions and our first upside pivot level which is shown with the green box which is the 61.8-76.4 extension level of the initial move up off of the lows.
As we can see from this chart the next move up off of the wave 2 bottom hit the upper end of that first pivot and turned back down. This signals that we are not quite ready to break directly higher just yet and is a common spot to see a retracement for a wave ((ii)) of larger 3 per fib pinball. So with the fail at the pivot and retrace we label that top as wave ((i)) as shown in purple.
Once we confirm a bottom in the purple wave ((ii)) we can then lay out our next set of fibs from the purple ((i))-((ii)) and set up our pivot levels for this wave degree which again come in at the 61.8-76.4 extension of the move up off of the bottom of the green wave 2 to top of purple wave ((i)). From there we saw the next move up off of the bottom of the purple wave ((ii)) top right in that purple pivot zone again. We then saw another retrace lower off of that pivot which is labeled as a red wave (ii).
From there we can then layout fibs again from the bottom of the purple wave ((ii)) into the top of the red wave (i). We once again find the 61.8-76.4 ext and use that as our pivot. In this case, that pivot level is aligned almost spot on with the previous pivot level. So we now have pivot levels of multiple degrees coming into alignment. This is a very good signal that once we break the upper end of that pivot level we likely will be in what we call the heart of a third of the third wave. This portion of the pattern is where we see "melt-up" type of action and when the chart typically grinds higher with very shallow retracements.
In the case of the Russell 2000, this is exactly what we saw occur. We not only broke the pivot but we exploded through it and never looked back and the move simply pushed higher on very small retracements until the point which we currently find ourselves in which the chart now looks to be working its way through a series of fourth waves on multiple degrees.
So from a trading perspective, there were many different ways to trade this chart. One could have entered upon any of the wave 2 retracement levels and put stops under the previous lows and continued to move those stops up to the bottom of the wave 2 of the next degree. One could also have bought upon a break of the pivot and put stops under the lower end of the pivot or the bottom of the last wave ii shown in white and rode the chart up towards the top of third-wave fib targets. Or one could have used a combination of those methods and had a successful trade.
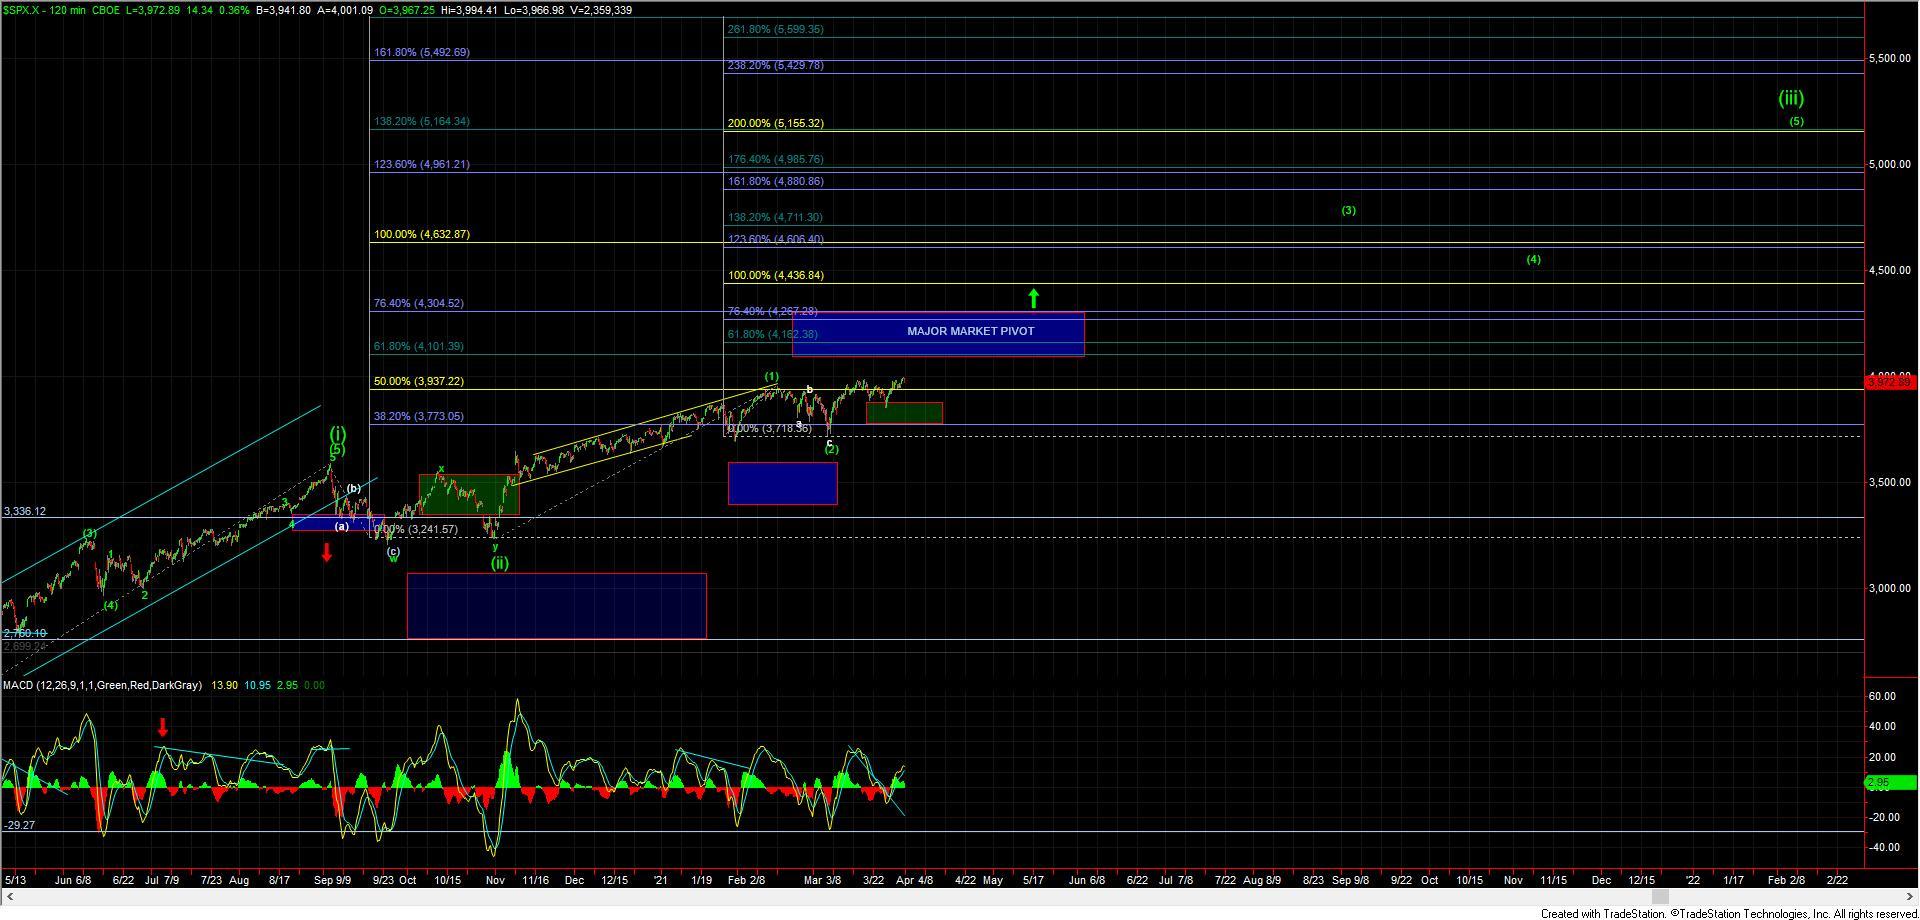
Circling back to where we are currently with the SPX we have yet to break-through the major market pivot on this chart (as it does appear the RUT has been ahead of the SPX and is following a slightly different pattern off of the March lows).
Looking at the SPX 120min chart we can see that we have a (i)-(ii) pattern up off of the March lows. The 61.8-76.4 ext of that initial move comes around at the 4100-4300 zone. So this is our first pivot zone off of the lows. After bottoming in the wave (ii) we do now appear to have a completed (1)-(2) off of that low so we are able to layout another setup of fibs of one smaller degree. The 61.8-76.4 ext of this move comes in at the 4162-4276 zone. Right in the middle of our pivot of one larger degree. So with two pivots of two degrees in alignment, we have a fairly high probability that should we see a break through the pivot of those two degrees that we likely are in the heart of the wave (iii) up on the SPX and should be in the "melt-up" stage similar to what we saw occur when the IWM broke through its pivots of multiple degrees.