Ramaco Resources (METC): Early Bullish Setup May Lead To A 2026 Rally
 By
Levi
By
Levi
By Levi At Elliott Wave Trader; Produced with Avi Gilburt
Zac and I periodically review favorable setups — both bullish and bearish in structure. (METC) appears to be in the early innings of a bullish setup. Clear parameters are emerging in this initial phase, offering high-probability trade opportunities for tactically minded traders. Once that setup is confirmed, a larger bullish rally may be unleashed.
First, to specify: we’re talking about Ramaco Resources (METC), a metallurgical coal company that produces and sells coking coal, a key ingredient in steelmaking. The company presents a mixed financial picture. Its strengths lie in strong production growth, low production costs, a solid balance sheet, a diverse customer base, and a promising rare earth element discovery.
As well, steelmakers are turning capital spending back on as global infrastructure demand increases. Coal producers based in the U.S., like Ramaco (METC), stand to benefit. Ramaco, with its low-cost operations and newly announced rare earth element added to its strategies, may be positioned at the intersection of a resurgent U.S. industrial spending as well as strategic resources Stateside.
There are persistent concerns regarding profit margins and debt management. However, ask yourself, “What turns first, fundamentals or crowd sentiment?”. And you would be making a crucial query in this regard. We will discuss how crowd behavior will typically turn a stock or index far ahead of fundamentals. As well, we will share the setup in development for (METC). Lastly, a brief discussion of how proper risk management is a must for any trader/investor. Let’s get to it!
Viewing Through A Purely Probabilistic Lens
Please allow me to share with you the reason our methodology produces so many successful setups. It’s certainly not guesswork, nor the reading of tea leaves. What is it, then? This is simply human behavior that manifests itself in the form of patterns on the chart. These patterns exhibit self-similarity at all degrees, or intervals, of the structure of price. It means that the smaller structure will form similar larger structures. So, with this in mind, when the analyst correctly applies the theory, a high-probability scenario can be projected going forward.
This is not a way to explain what happened after the fact. Other than reporting the news, of what use would this be to an investor/trader? However, armed with a specific risk versus reward and a probable path, the individual may then take positions based on their plan and set of goals. Each trade would have near and longer-term targets, resistance, support, and invalidation levels distinctly determined before even entering the trade.
Over many years of careful observation and application of this methodology, we have come to appreciate that mass sentiment will turn much sooner than the fundamentals of the macro economy or the specifics of a company and its balance sheet or future prospects. What’s more, the fundamentals will commonly align with the price movement of the stock or index somewhere in the middle or sometimes even closer to the top of a rally.
So, how can we use this in the case of (METC) stock? We have a setup in its initial stages. Should this play out as we anticipate, it will be forming the base for a much larger bullish move into 2026. What might this look like?
Theory Applied To The Chart
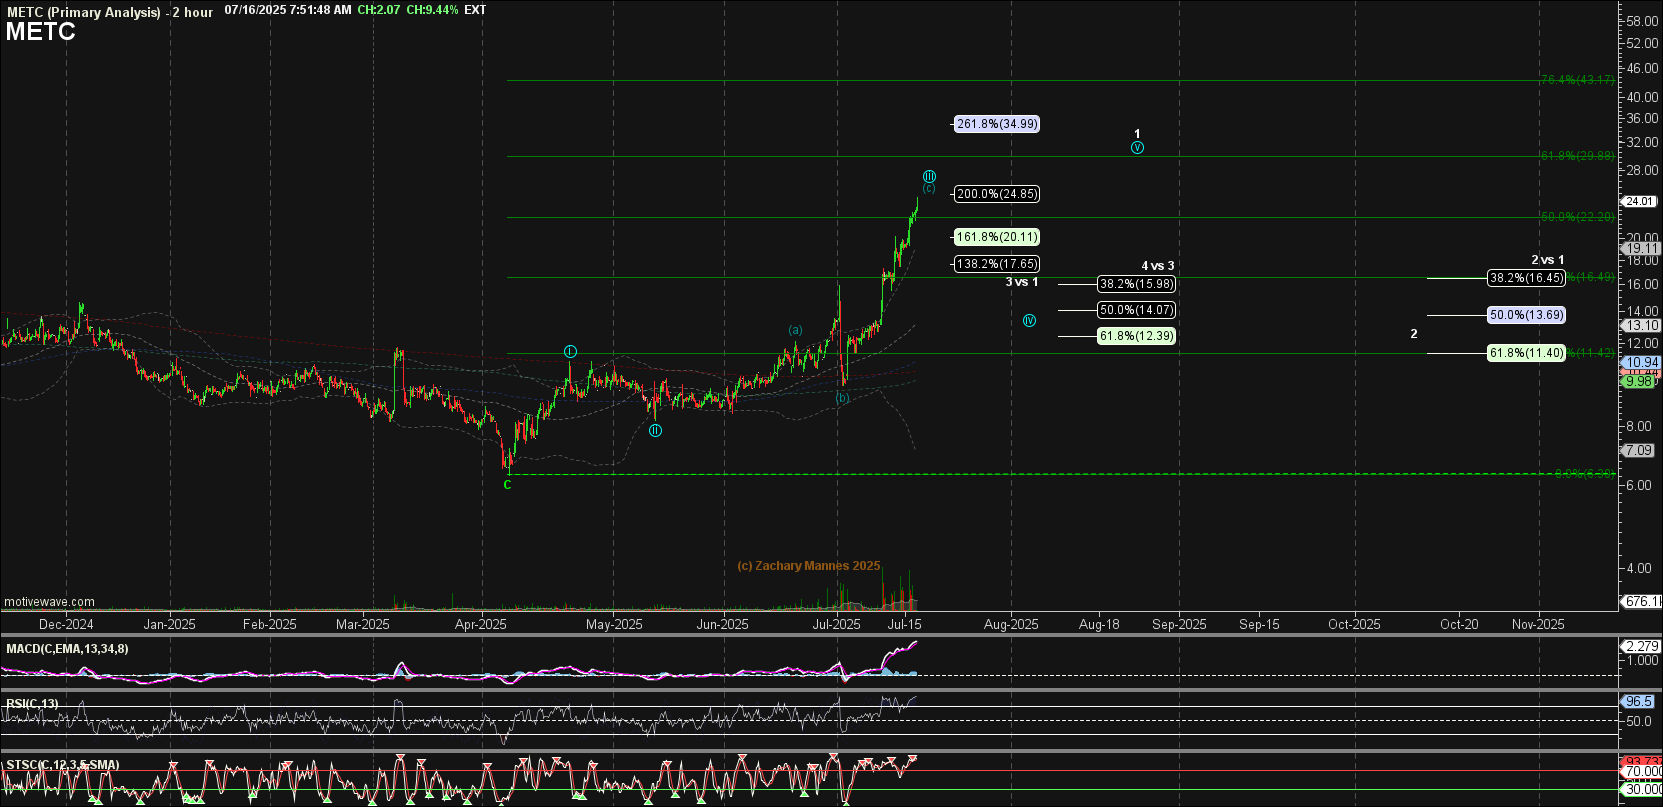
If you zoom all the way out on the (METC) chart you will see that price recently hit an all-time high. However, it is the move up from the low struck in April of this year that has our attention. Note how the structure may actually just be in the initial phases of setting up a wave 1 and then a wave 2 pullback.
What does this mean going forward? Zac has commented that he anticipates a pullback from current levels to the $14 - $16 area as a wave ‘iv’ of the larger wave 1. Wave ‘v’ of 1 should take price back to recent highs and a bit more. Thereafter, a further consolidation period for wave 2 would pull back in corrective fashion.
As you can see, this setup may provide some trading setups for those so inclined and ones that are nimble enough. Some investors may choose to accumulate on pullbacks and trim on rallies. Each individual has their own trading plan, style, risk profile, goals, time frames and the like.
From a general viewpoint, as mentioned, we anticipate price to pull back from current levels in wave ‘iv’. The completion of the rally in wave ‘v’ will help determine proper pullback levels for wave 2. Once wave 2 is in place we will then project the wave 3 rally structure that may lead into 2026.
If price were to take out the wave ‘ii’ low struck in May then it would invalidate this near term setup and we would reevaluate our present bullish leanings.
Risk Management
We have specific price levels to provide guidance along this likely bullish path. Can it invalidate? Of course? It’s OK to be wrong, just don’t stay wrong. Not all setups are certainties, just as projections are not prophecies.
Yes, there are nuances to the analysis. Once familiar with our methodology, our members discover a powerful ally on their side to provide guidance and risk management in their trading/investing.
The following note is posted on the main page of our member chatroom:
Important Risk Management Caution: We want everyone on ElliottWaveTrader to understand that markets are fluid, dynamic, non-linear systems. In order to trade such systems, one has to develop the experience necessary to navigate its complexities. Therefore, we strongly suggest that a trader takes the time to learn Elliott Wave and supporting technical analysis BEFORE beginning to trade his or her hard-earned money. Unfortunately, we have seen too many new traders attempt to jump in with both feet without an appropriate background. This is the easiest way to blow up your trading account, so we strongly caution against it. Also, our general advice is that you do not enter any trade with more than 3% of your trading account and ALWAYS use stops.
A learning curve exists to properly harness the power of crowd sentiment. We have an extensive learning and education section at Elliott Wave Trader. There are two analysts on our team that are dedicated to helping members learn the structures and subtleties of this methodology.
Would you like to discover an entirely new way of viewing the markets? Come see how we do this every day!
